The Best Five Sectors This Week, #36
Key Takeaways
- Financials return to the top 5 sectors, displacing Materials.
- Technology remains #1.
- Communication Services and Consumer Discretionary display strength.
- Industrials and Financials are at risk of further weakening.
Sector Shifts: Financials Back in the Game
The S&P 500 ($SPX) and broader markets had a solid week, prompting only one notable shift in the sector ranking. Financials clawed its way back into the top five, pushing Materials down a notch.
Technology remains in the top spot. Communication Services, meanwhile, made an impressive leap back up, climbing from third to second place, while Consumer Discretionary has been nudged down to third. Industrials is holding steady at number four and, as mentioned, Financials rounded out the top five, up from sixth place.
The rest of the pack remains unchanged: Energy at seven, Utilities at eight, Real Estate at nine, Health Care static at 10, and Consumer Staples bringing up the rear.
- (1) Technology - (XLK)
- (3) Communication Services - (XLC)*
- (2) Consumer Discretionary - (XLY)*
- (4) Industrials - (XLI)
- (6) Financials - (XLF)*
- (5) Materials - (XLB)*
- (7) Energy - (XLE)
- (8) Utilities - (XLU)
- (9) Real-Estate - (XLRE)
- (10) Healthcare - (XLV)
- (11) Consumer Staples - (XLP)
Weekly RRG
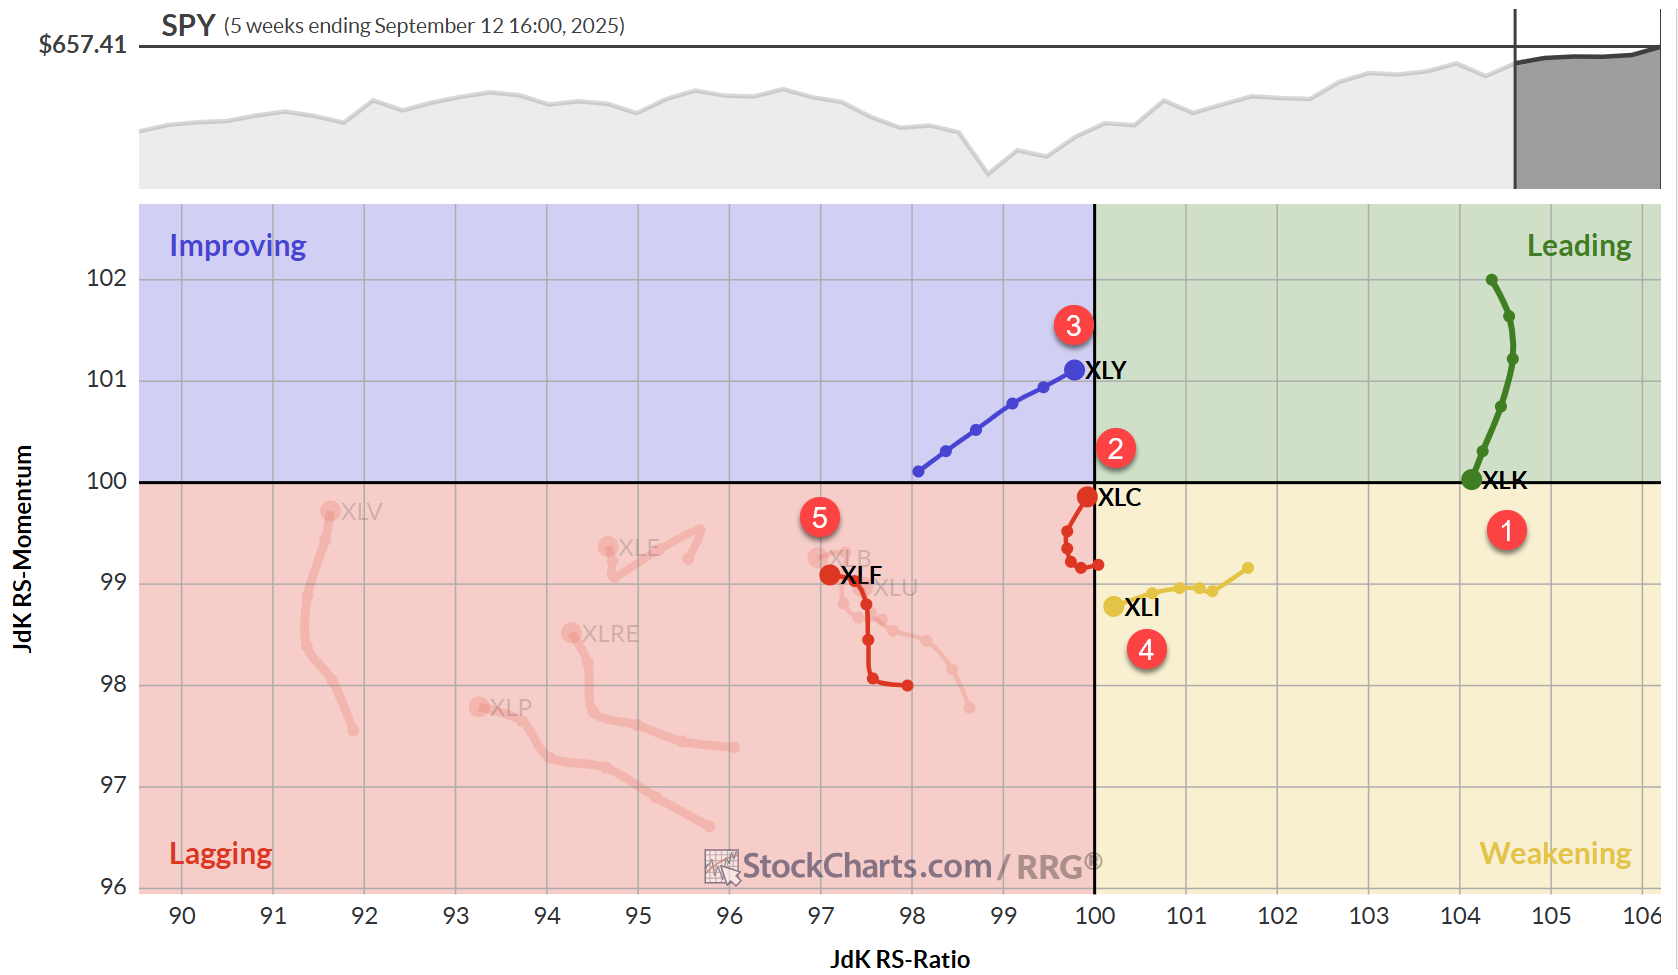
Taking a look at the weekly Relative Rotation Graph (RRG), we see that Technology is still far to the right, with the highest RS-ratio, but it's on a negative heading and flirting with the weakening quadrant. Given its high RS-ratio, there's a good chance we'll see a rotation back into leading, but it's definitely something to keep an eye on.
Communication Services is picking up steam after spending five weeks in the lagging quadrant. It's almost at the center of the chart, which means it's moving in line with the index. But that RRG heading? That's suggesting more outperformance on the horizon.
Consumer Discretionary is inching towards the leading quadrant, while Industrials is dangerously close to slipping into lagging. And speaking of lagging, that's where we find Financials, despite its return to the top five. It's in a bit of a dance with Materials, swapping back and forth. Neither looks fantastic, but they're still in better shape relative to the bottom half of the sectors.
Daily RRG
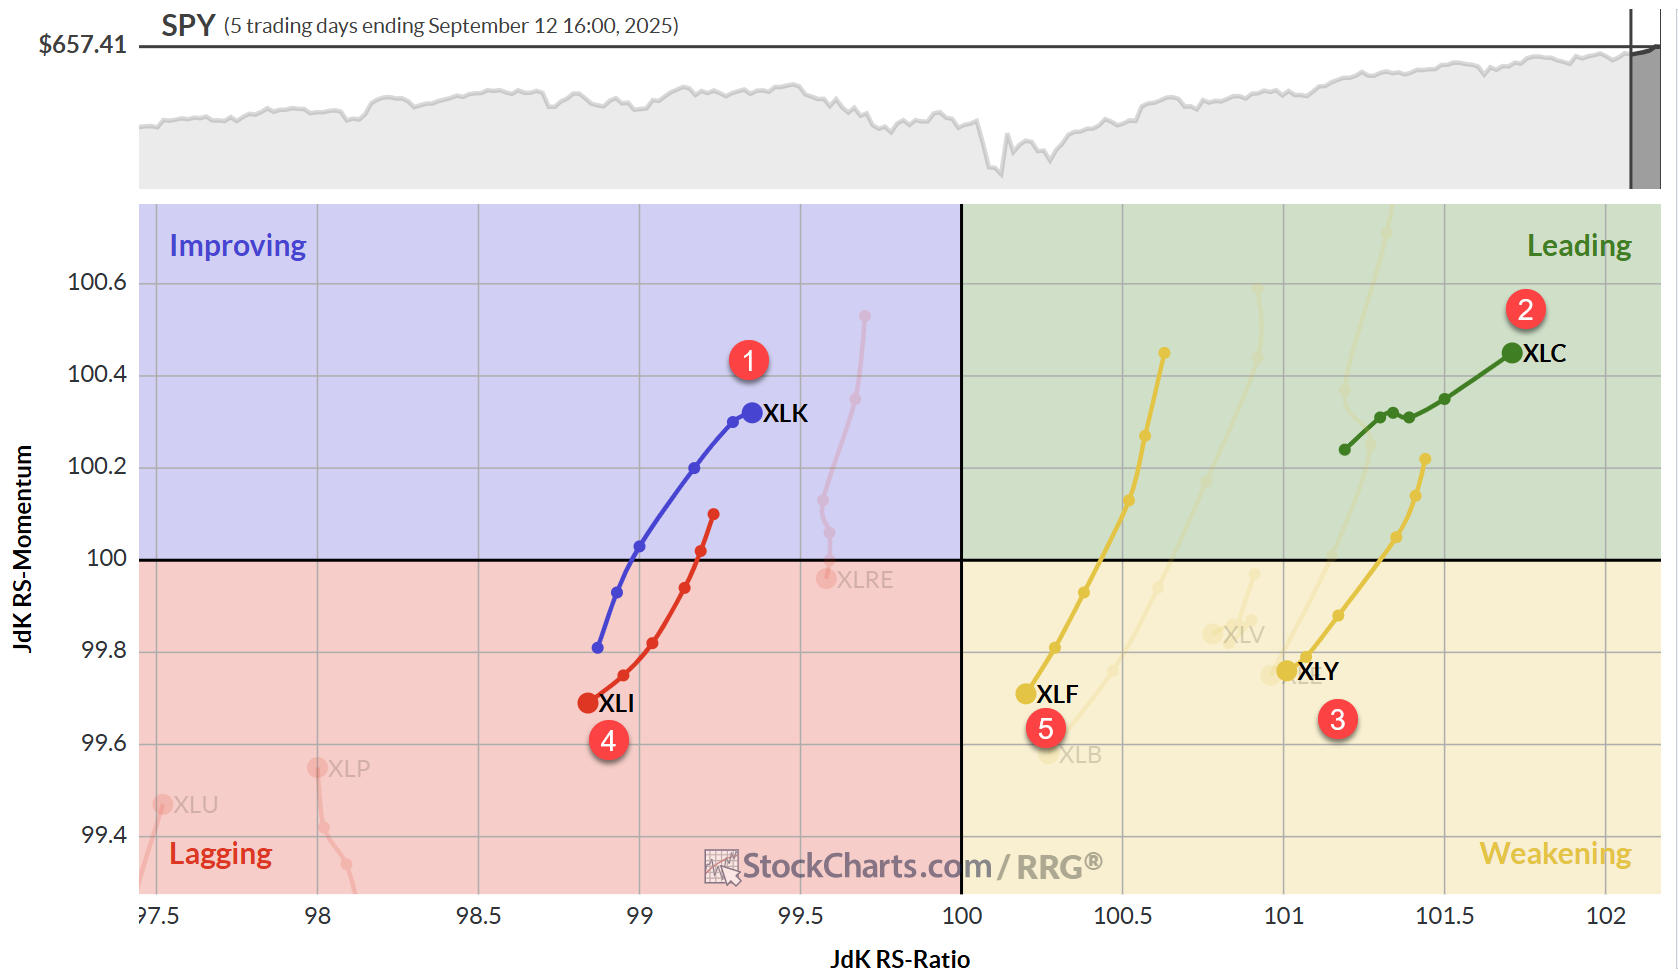
Zooming in on the daily RRG, we get a more nuanced picture:
- Technology has started to move back up, improving with a positive heading.
- Communication Services is well into leading with a strong heading and increased velocity.
- Consumer Discretionary moved from leading to weakening, but its high reading leaves room for a potential comeback.
- Industrials rotated from improving back to lagging, not a great sign.
- Financials is showing a long tail with a negative heading, which, combined with its weak weekly performance, puts it at risk.
Technology
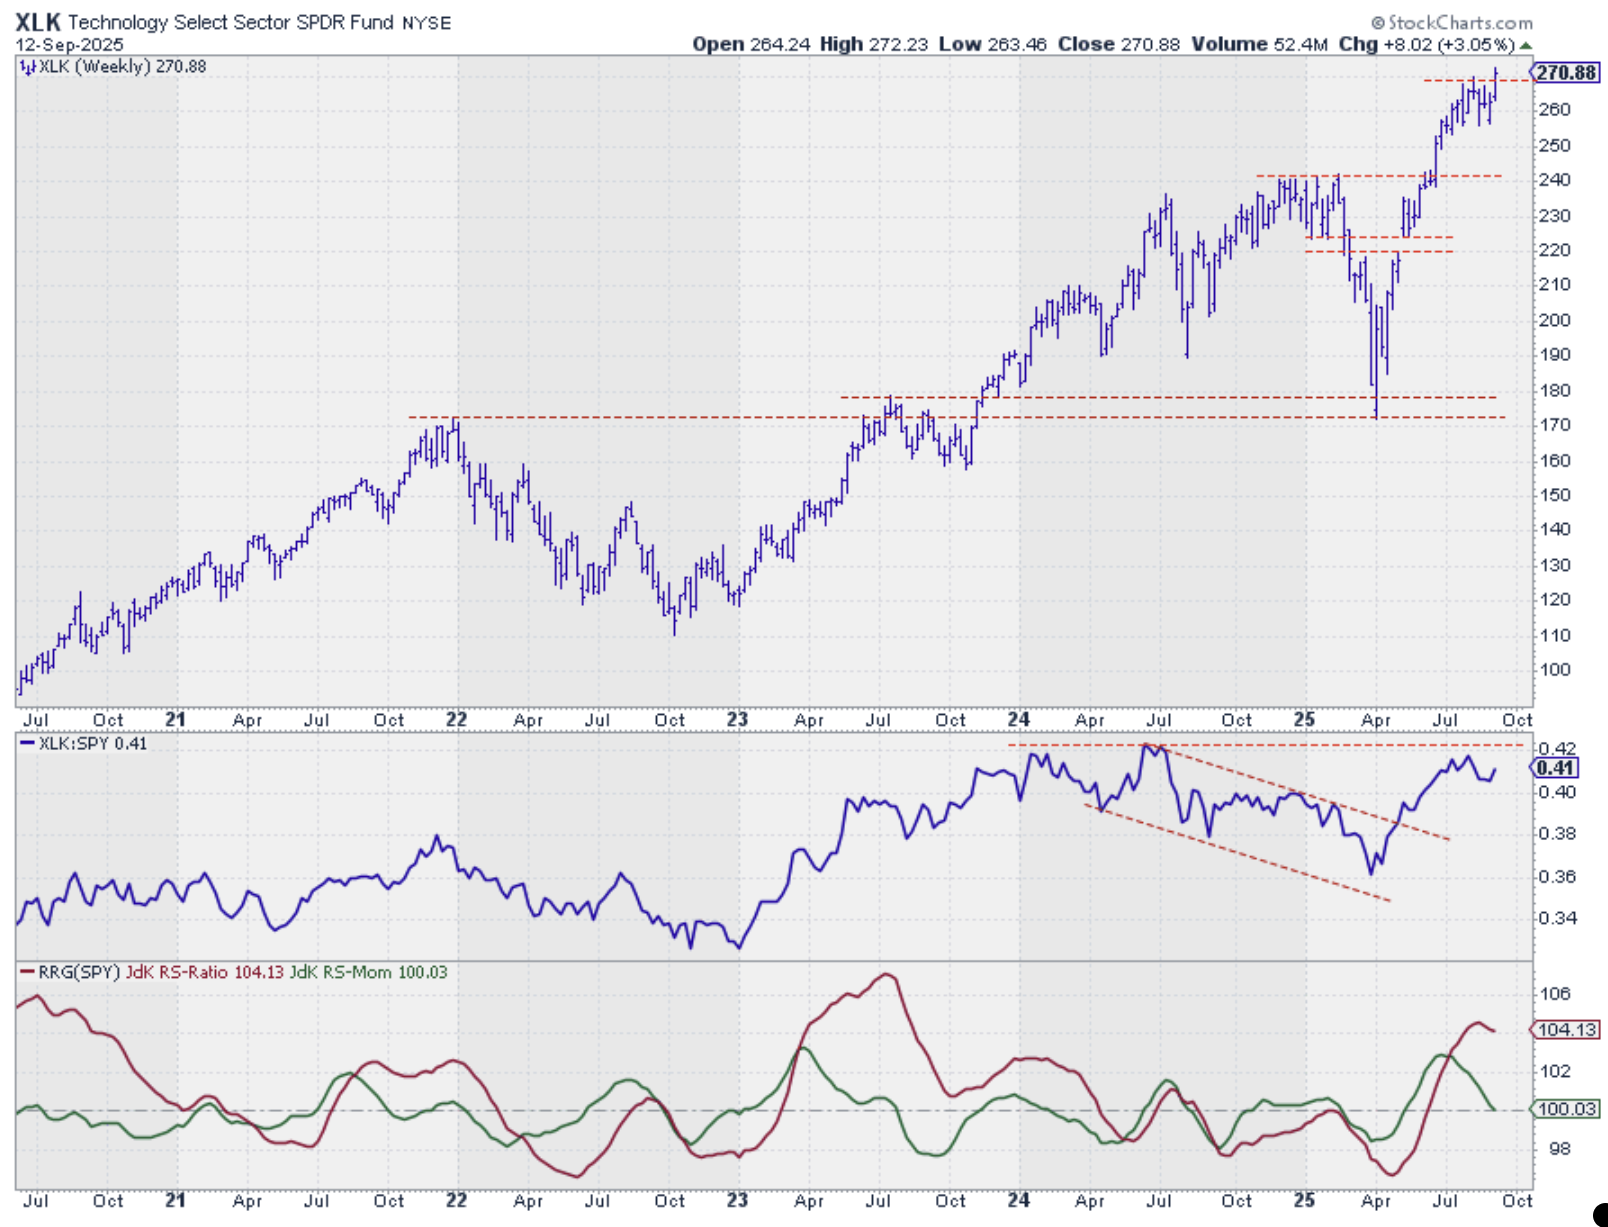
Tech is breaking out above its previous high, confirming its current strength. This opens the door for further price rises. The relative strength line bounced off horizontal resistance but is already moving back up. A break above the previous high in relative strength would undoubtedly boost the odds for continued outperformance.
Communication Services
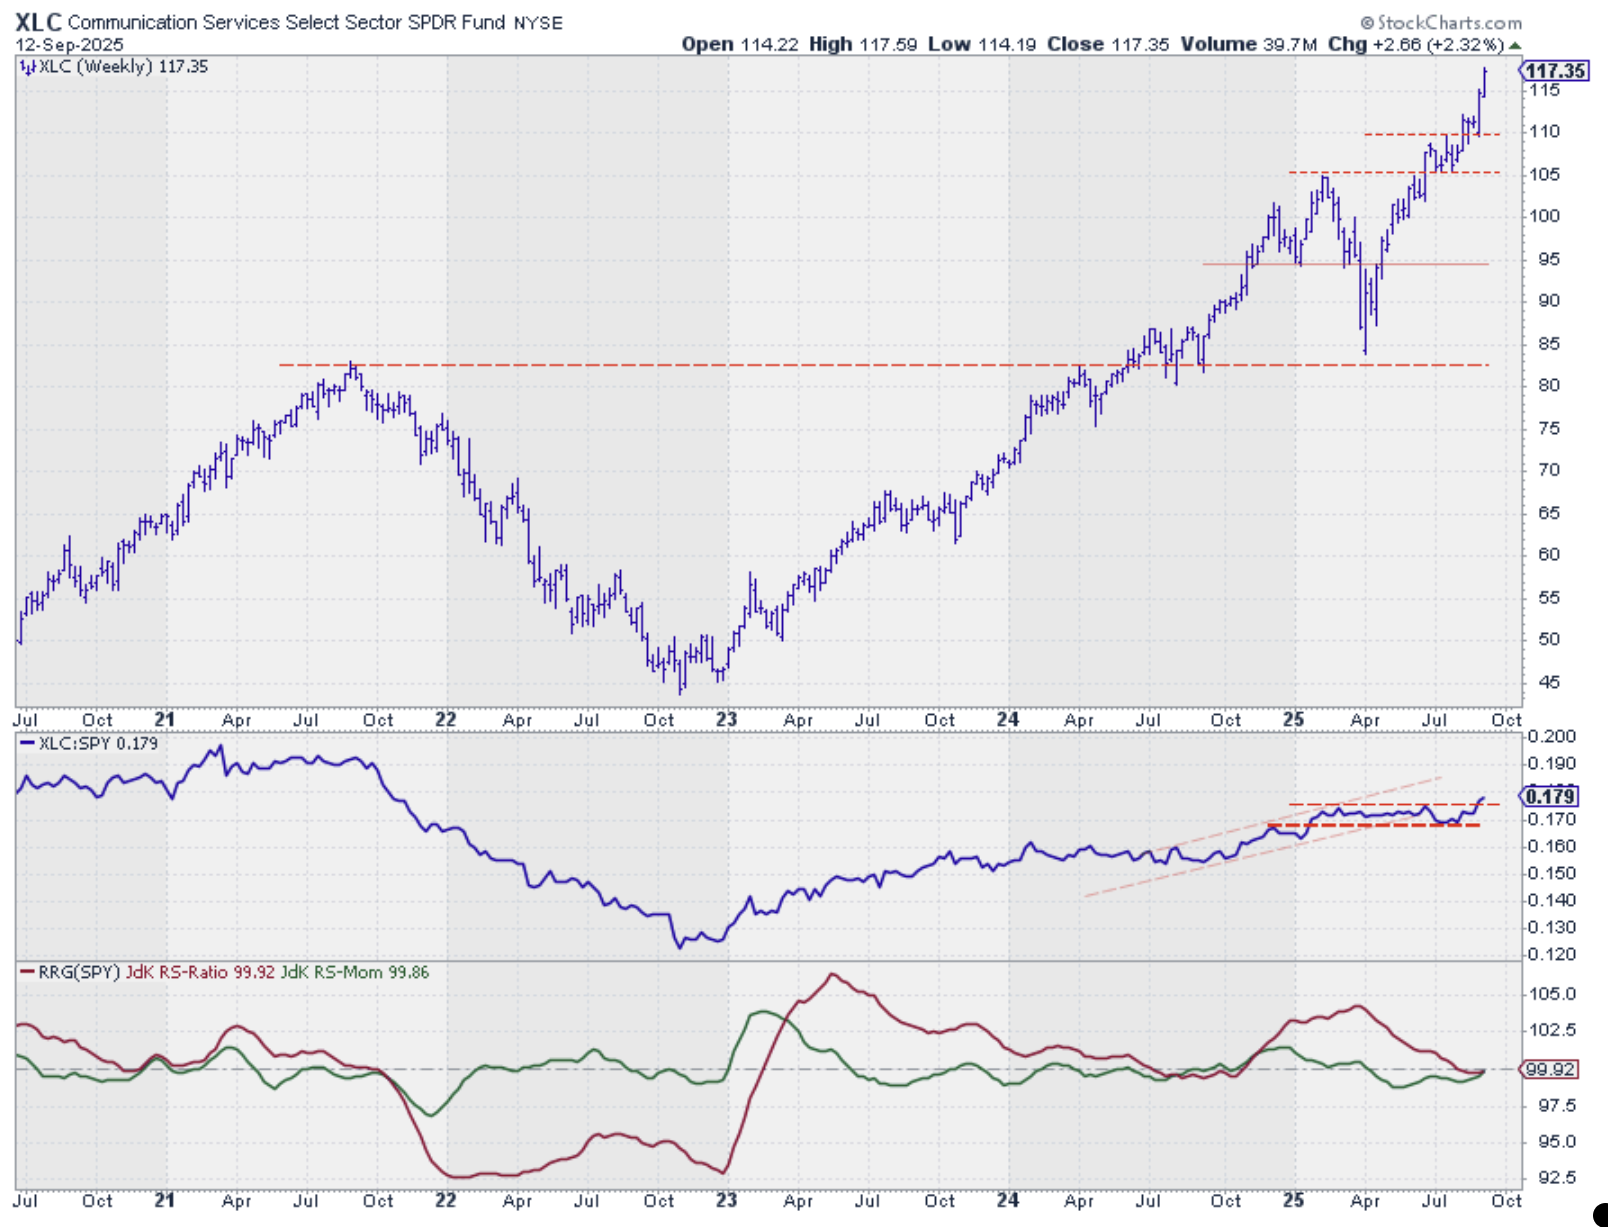
This sector is on fire. We're seeing the second week of very long bars after breaking to new highs. The raw relative strength line is clearly breaking from its narrow trading range, setting the stage for even more relative strength in the near future. Both RRG lines are bottoming out around the 100 level and starting to point up, a bullish sign.
Consumer Discretionary
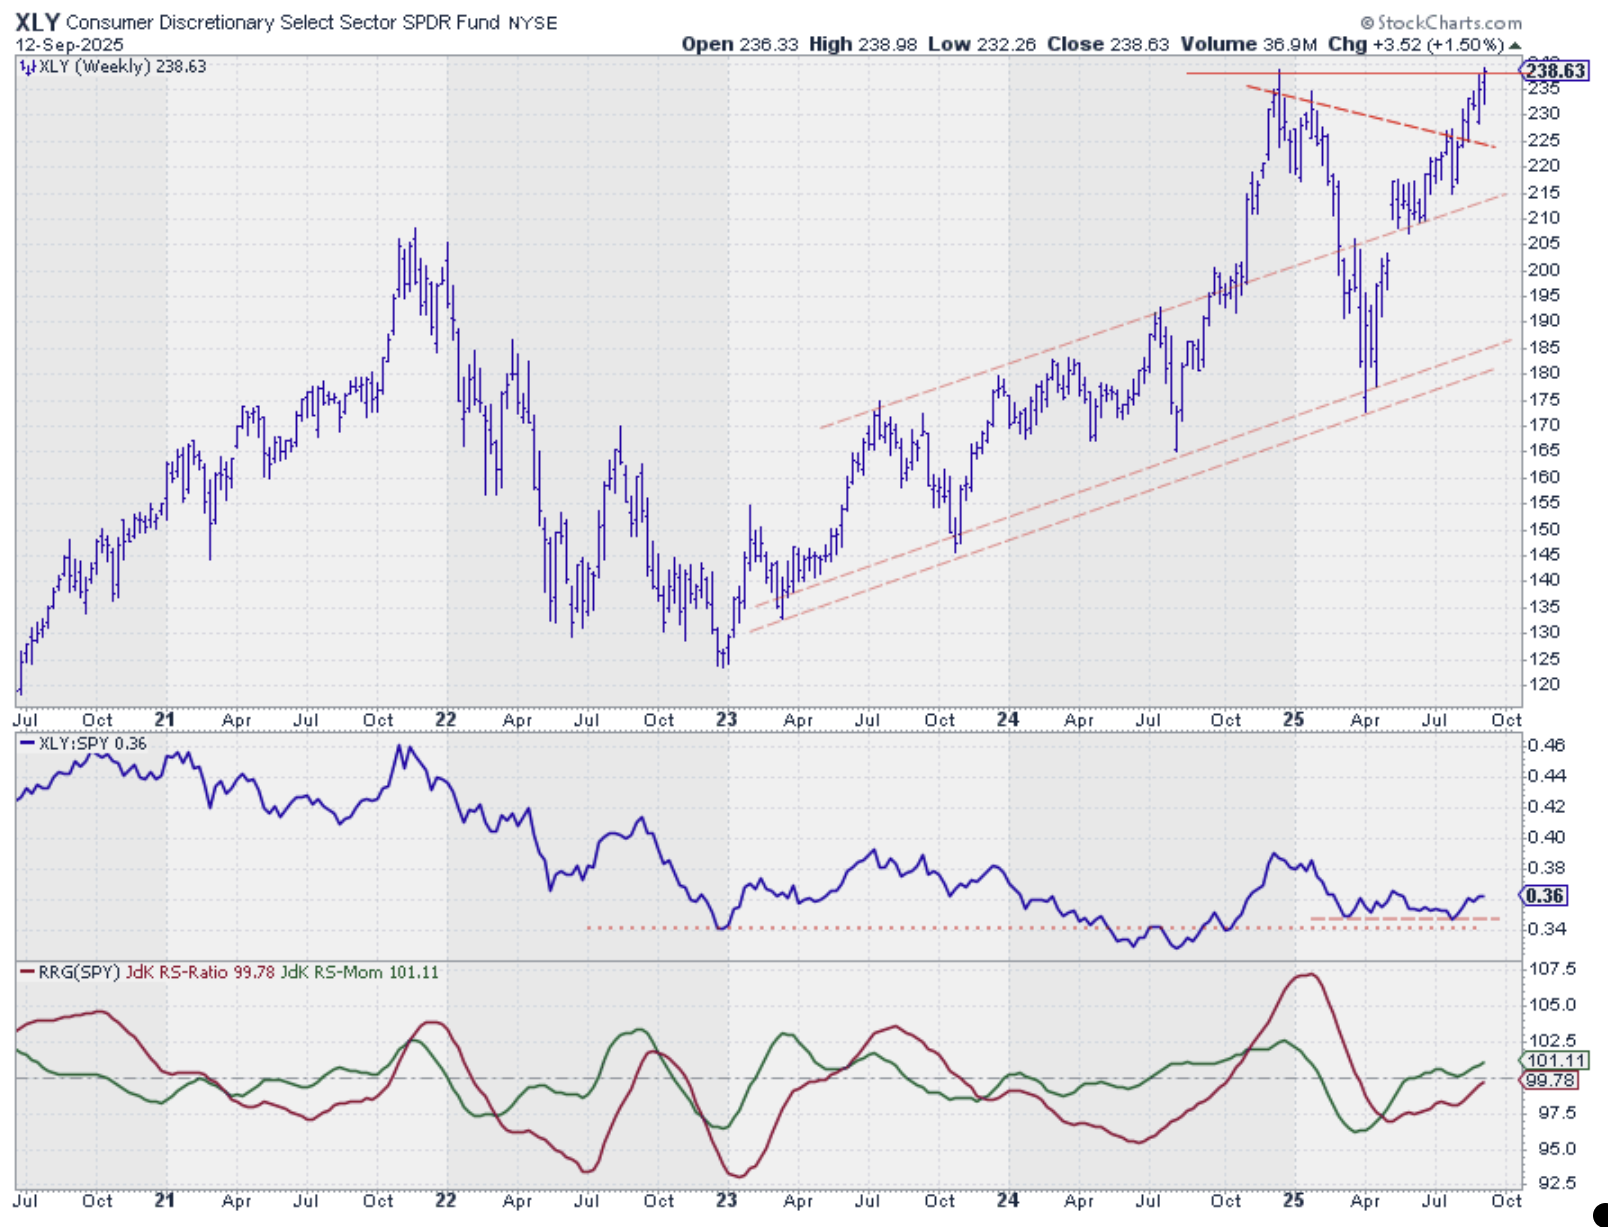
Here's where things get really interesting. After a significant dip from the start of the year to April/May, the Consumer Discretionary sector has returned to its previous high and is poised to break higher. When (and if) this happens, it's a huge buy signal for the sector. As a solid growth sector with high beta and the third largest market cap, this could give the S&P 500 a nice boost.
Industrials
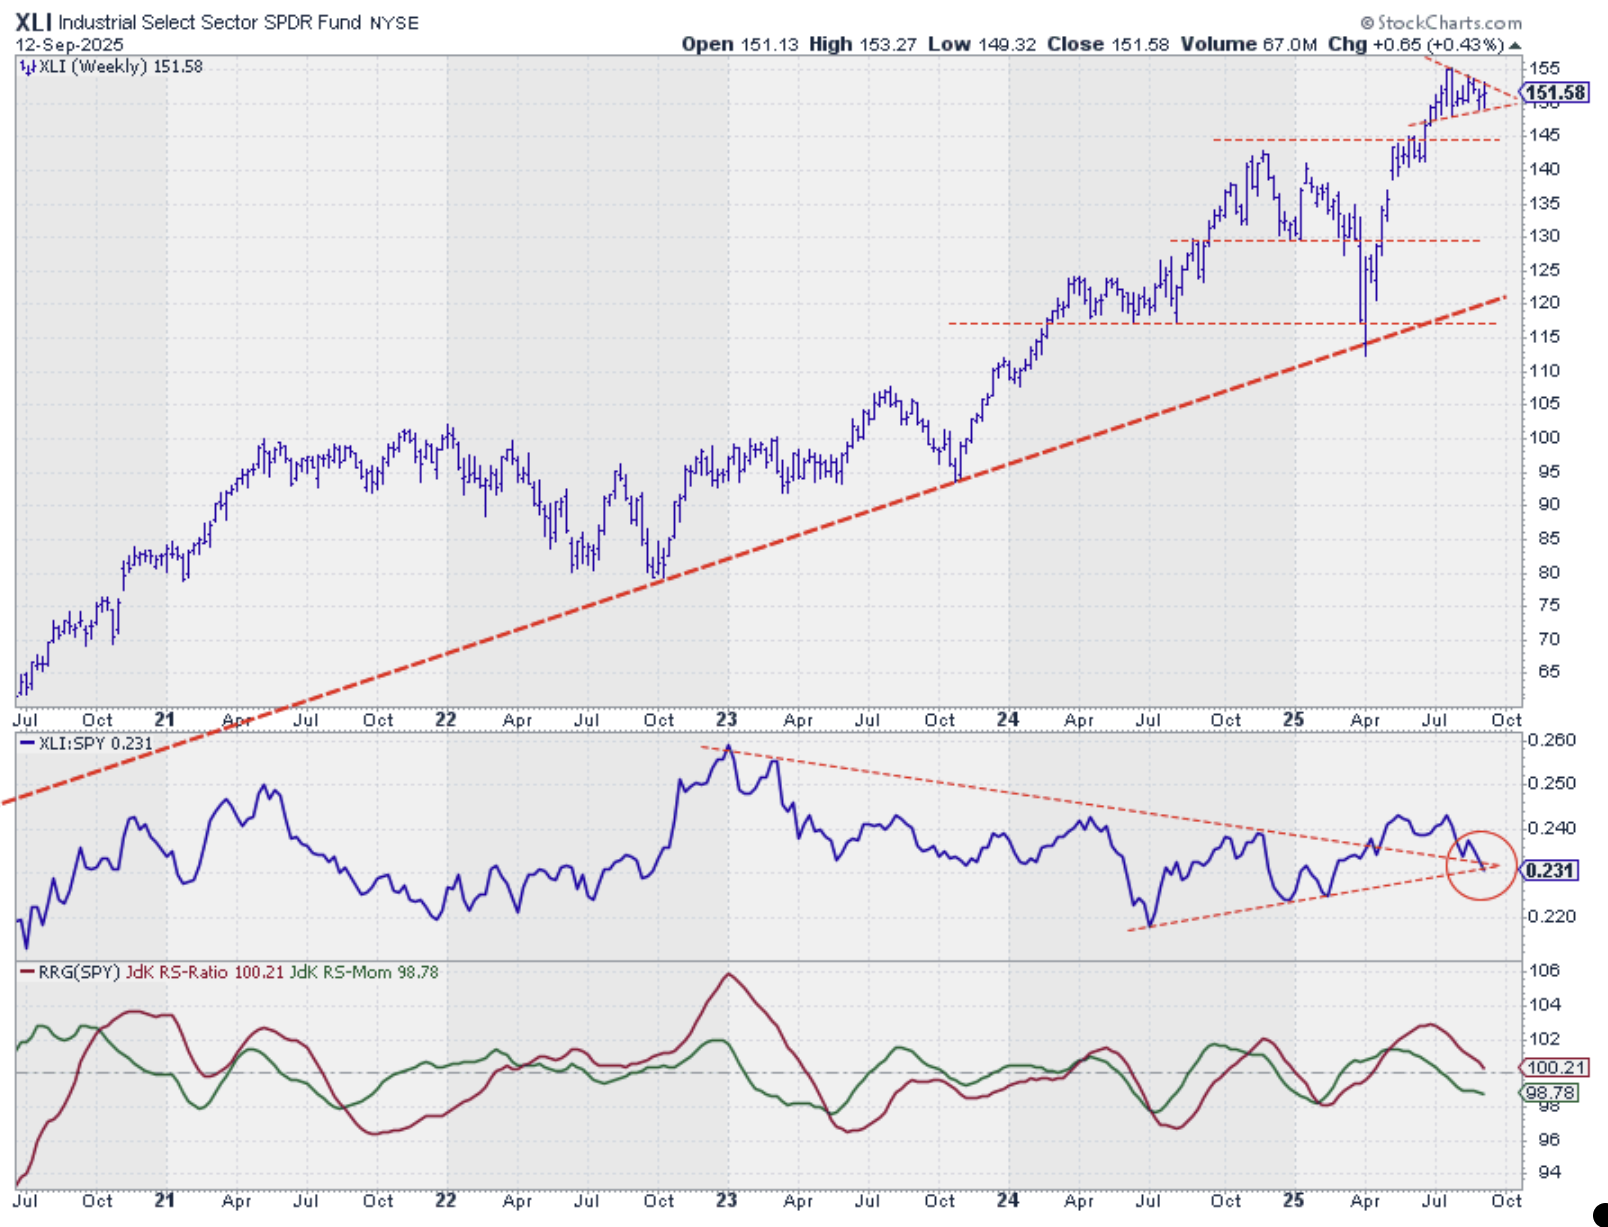
The industrial sector is trapped in what could be described as a small triangle formation, maybe even a flag. A breakout in either direction will give us a clue about the next move.
What's worrying is that the raw relative strength line seems unable to hold at the apex of the falling resistance and rising support lines. The RRG lines are already moving lower, and it's just a matter of time before the RS-ratio line crosses below 100, pushing Industrials into the lagging quadrant.
Financials
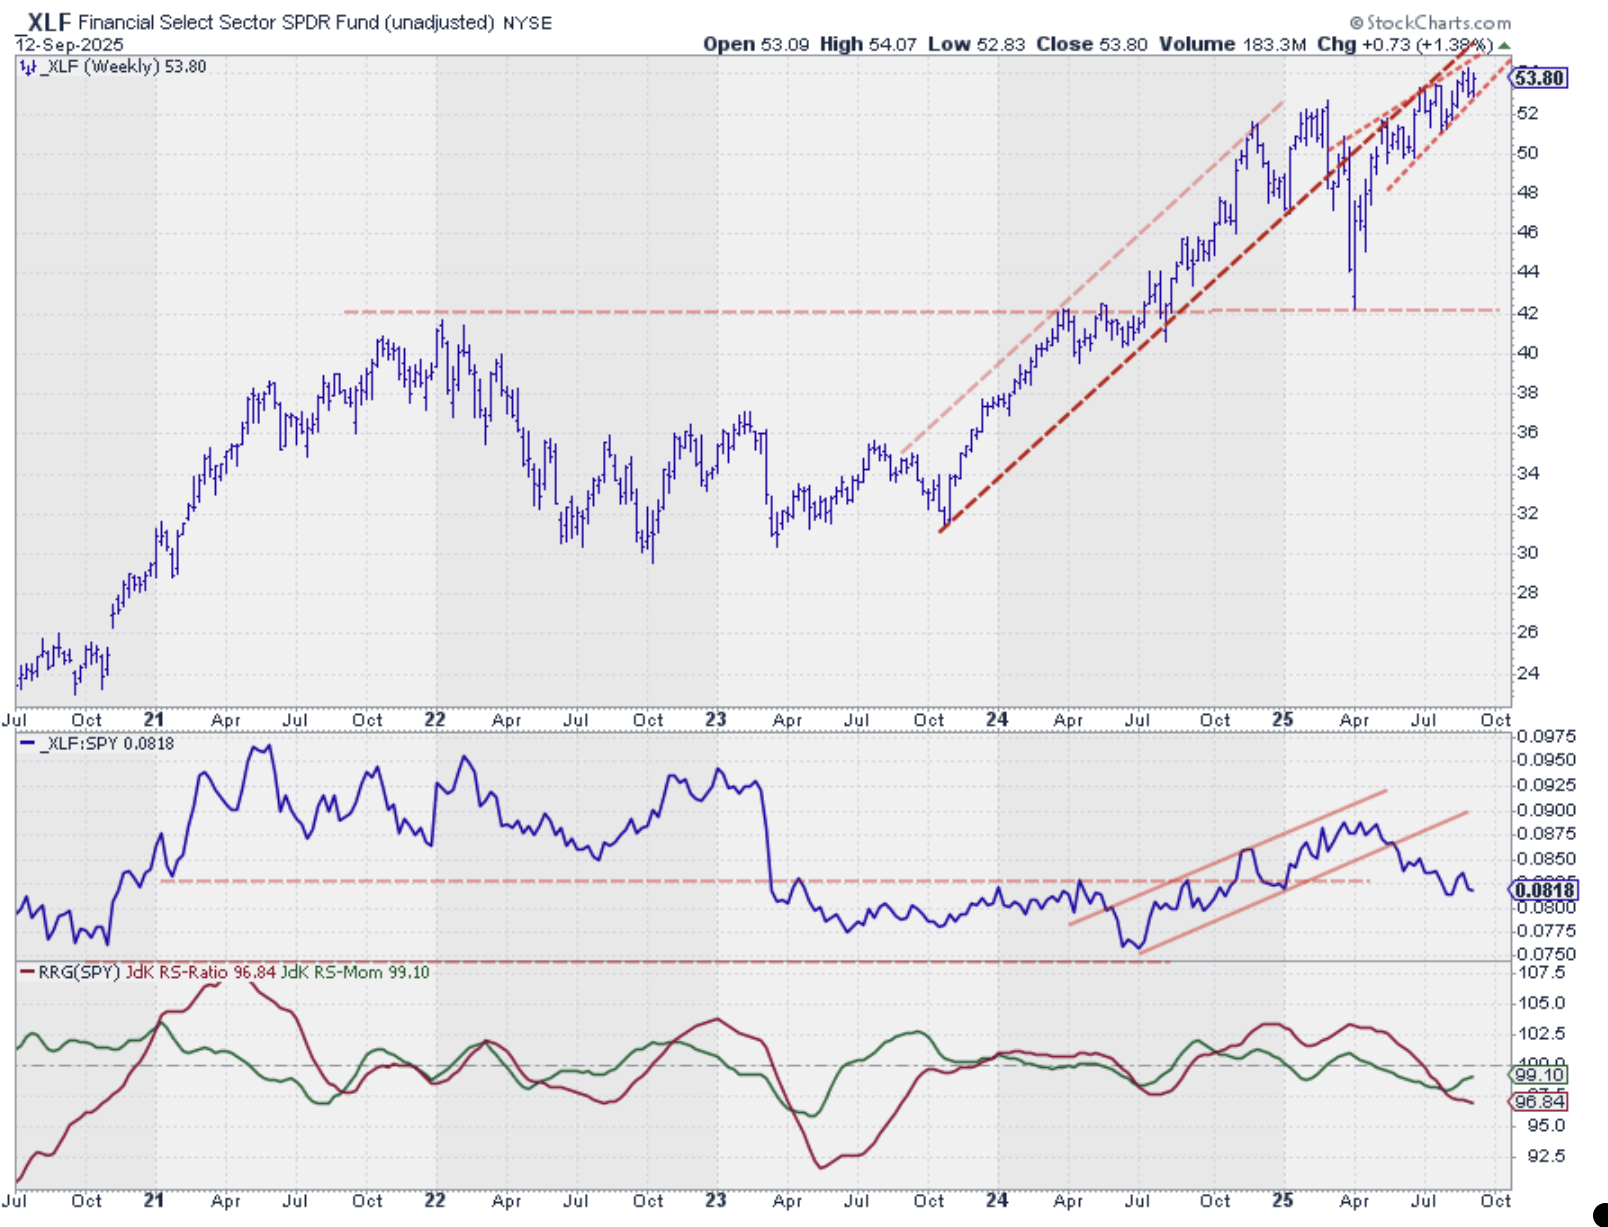
Financials is showing a nice series of higher highs and lows, but it's still working below the former rising support line, which is now acting as resistance.
The raw relative strength line is clearly moving lower, although it has slowed down a bit recently. This puts Financials in a weak spot at the bottom of the top five.
Portfolio Performance
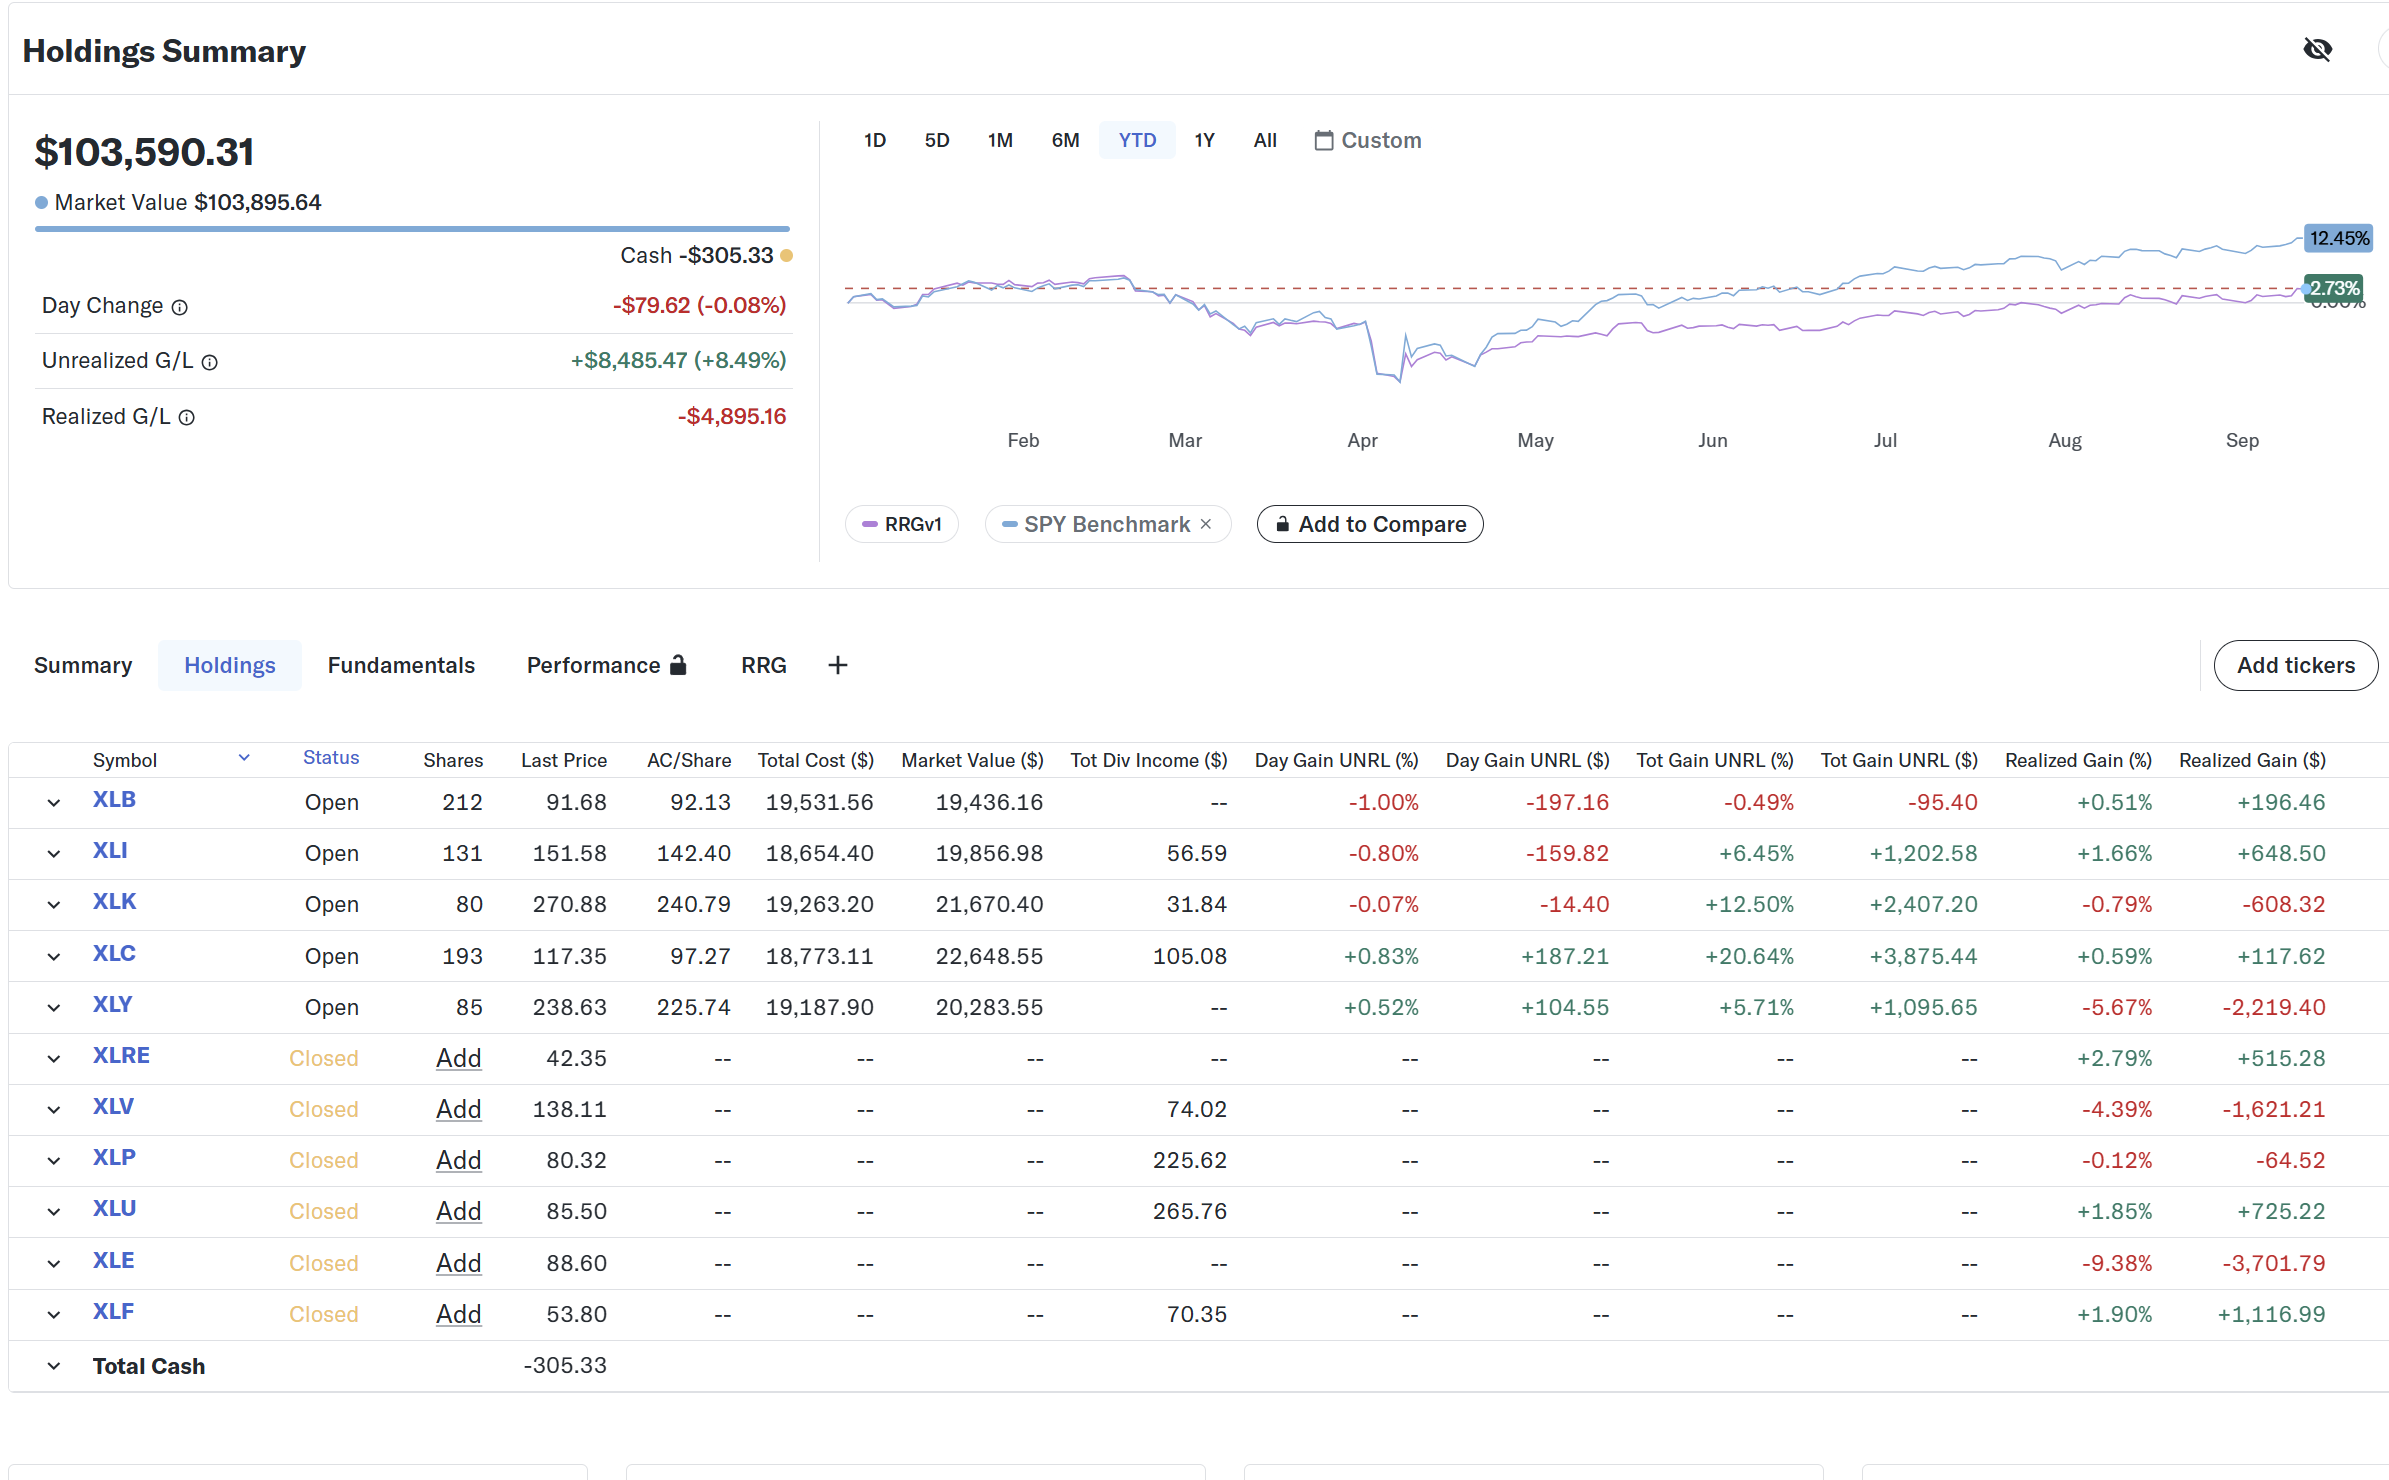
Our portfolio performance remains far from fantastic, but static at about 9% behind the S&P 500. We're still on the lookout for more meaningful relative trends and counting on this strategy to start catching up when that happens.
#StayAlert and have a great week, --Julius


