The Best Five Sectors This Week, #43

Key Takeaways
- Technology sector accelerating back to leading quadrant with increasing velocity
- Utilities experiencing rapid weakening after recent strength, daily RRG shows long tail through weakening into lagging
- Communication Services forming potential lower high with critical support at $113
- Portfolio performance lagging 11% behind S&P 500 due to equal weighting methodology versus proper sector weights
Sector Ranking Shifts
Last week's market action tells a familiar story. The S&P 500 picked up 0.7%, but the Nasdaq Composite surged almost 2%. This tech-heavy outperformance has been the dominant theme for weeks now, and it's showing up clearly in the sector rotation patterns.
The top five sectors remain unchanged in composition, but the internal shuffling reveals some momentum shifts, with XLC and XLY pushing down XLU. In the bottom half, the most notable move comes from Energy, jumping from #10 to #7.
- (1) Technology - (XLK)
- (3) Communication Services - (XLC)*
- (4) Consumer Discretionary - (XLY)*
- (2) Utilities - (XLU)*
- (5) Industrials - (XLI)
- (6) Healthcare - (XLV)
- (10) Energy - (XLE)*
- (7) Financials - (XLF)*
- (9) Real-Estate - (XLRE)
- (8) Materials - (XLB)*
- (11) Consumer Staples - (XLP)
Weekly RRG
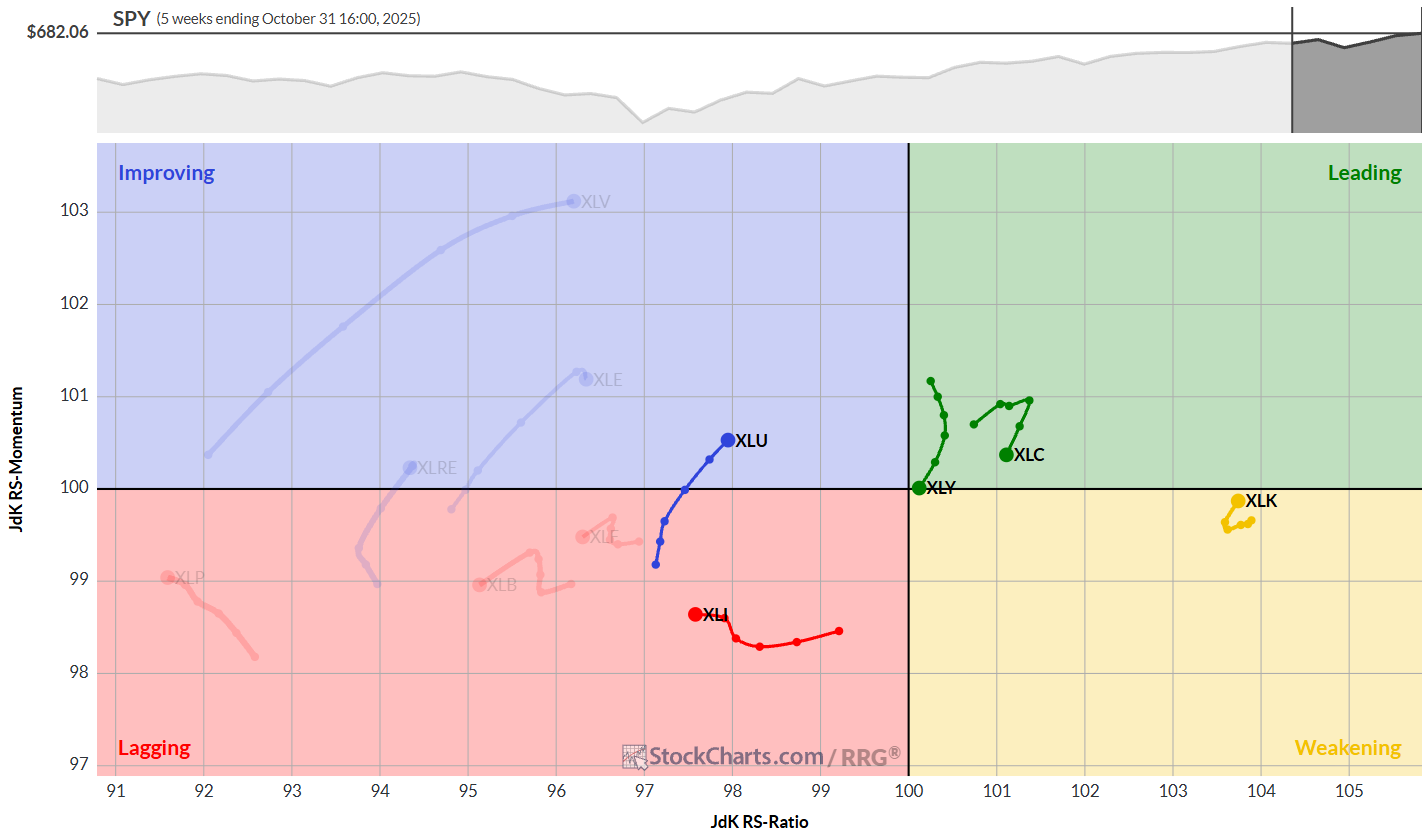
The weekly relative rotation graph shows Technology's rotation back up to the leading quadrant really taking shape. The tail has turned around, and the velocity is increasing; this is textbook leading sector behavior.
However, Communication Services and Consumer Discretionary are now both inside the leading quadrant but moving at a negative heading. That's a warning sign worth watching. Utilities is continuing to pick up strength inside the improving quadrant, although the daily timeframe tells a different story.
Industrials remain dangling at the bottom of the list inside the lagging quadrant and moving lower on the RS ratio scale. Despite that positioning, it's still stronger than the other sectors in the universe based on the algorithmic comparison.
Daily RRG
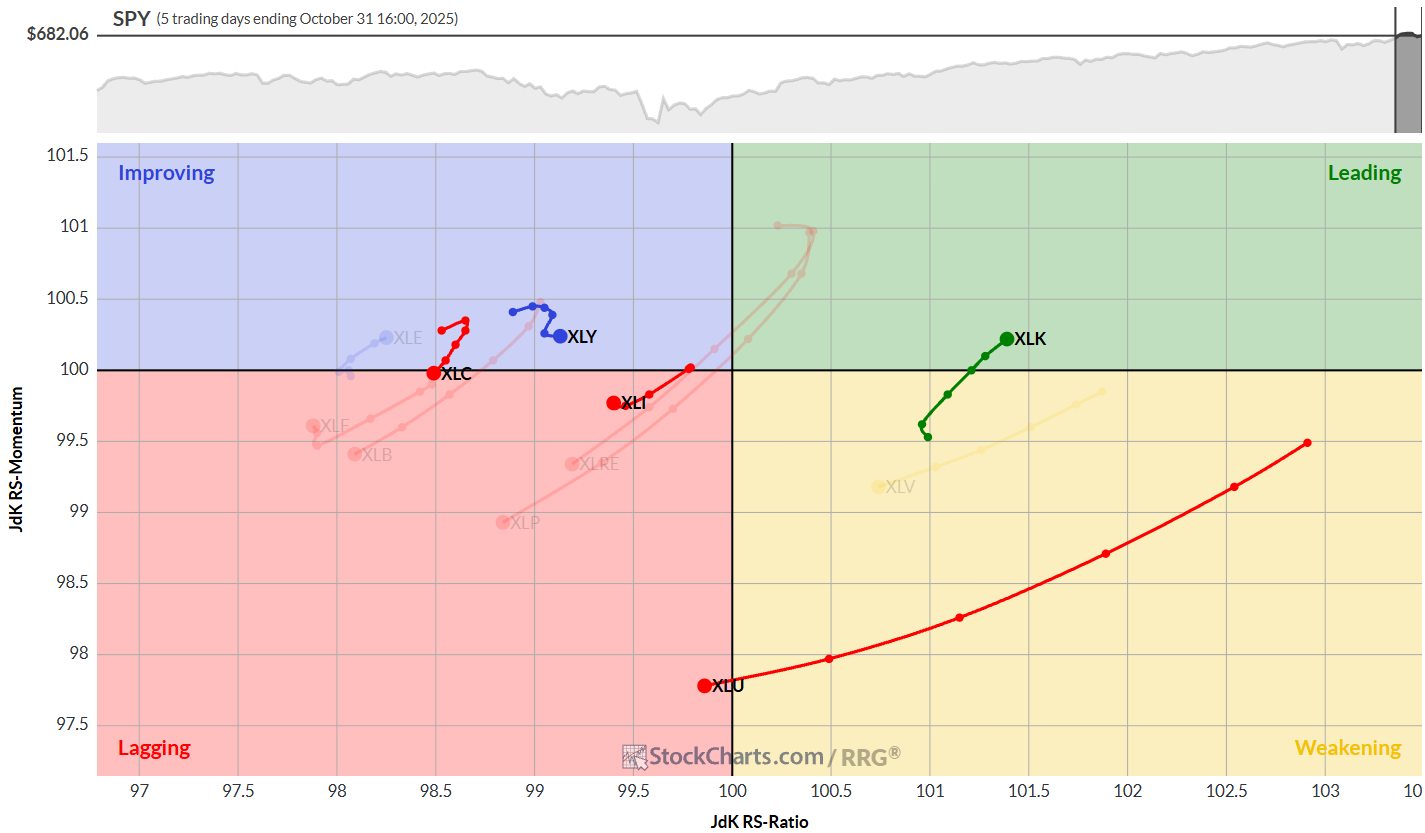
The daily timeframe reveals some significant divergences from the weekly view. Technology has already pushed back into the leading quadrant on the daily chart. It's now the only sector inside the leading quadrant in this universe, a remarkable show of strength.
On the other hand, we can see a really long tail on the Utility sector traveling through the weakening quadrant and now crossing over into lagging. This indicates rapid weakening for a sector that was so strong not too long ago. We'll have to see how long this holds and whether it keeps Utilities inside the top five.
Communication Services is rolling back down to the lagging quadrant on the daily chart. That's definitely a sign of weakness. Consumer Discretionary remains relatively static inside the improving quadrant, moving right and picking up a little bit of RS ratio, but still not showing the momentum needed to push back towards leading.
Technology
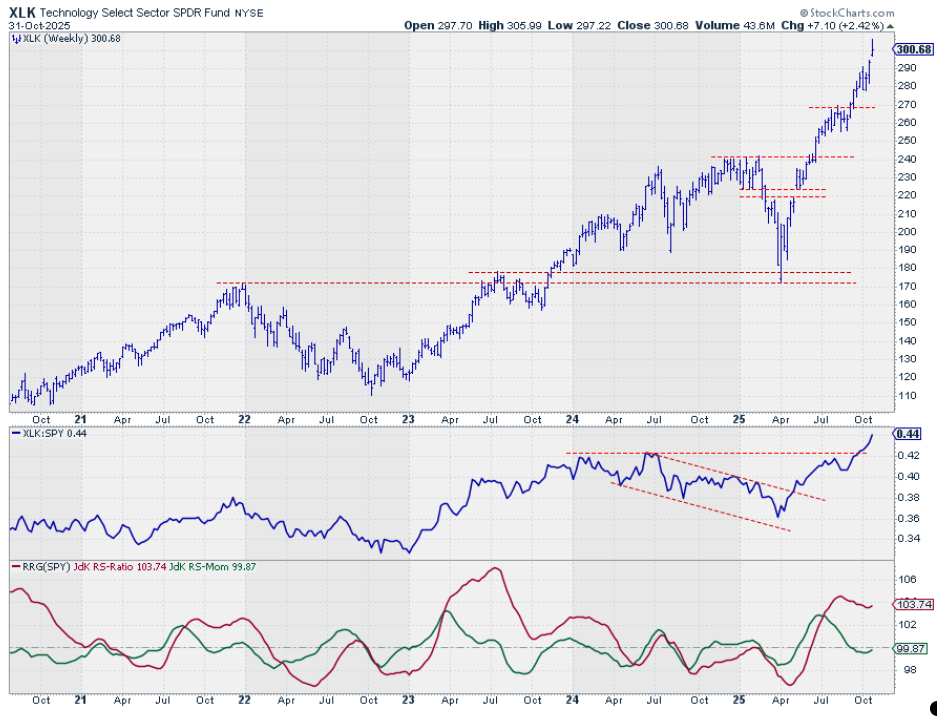
The strength in both price and relative charts remains staggering. This is the strongest sector in the universe, and it is driving the market higher. Period. The sector's momentum in both absolute and relative terms continues to accelerate, making it the clear leader in the current market environment.
Communication Services
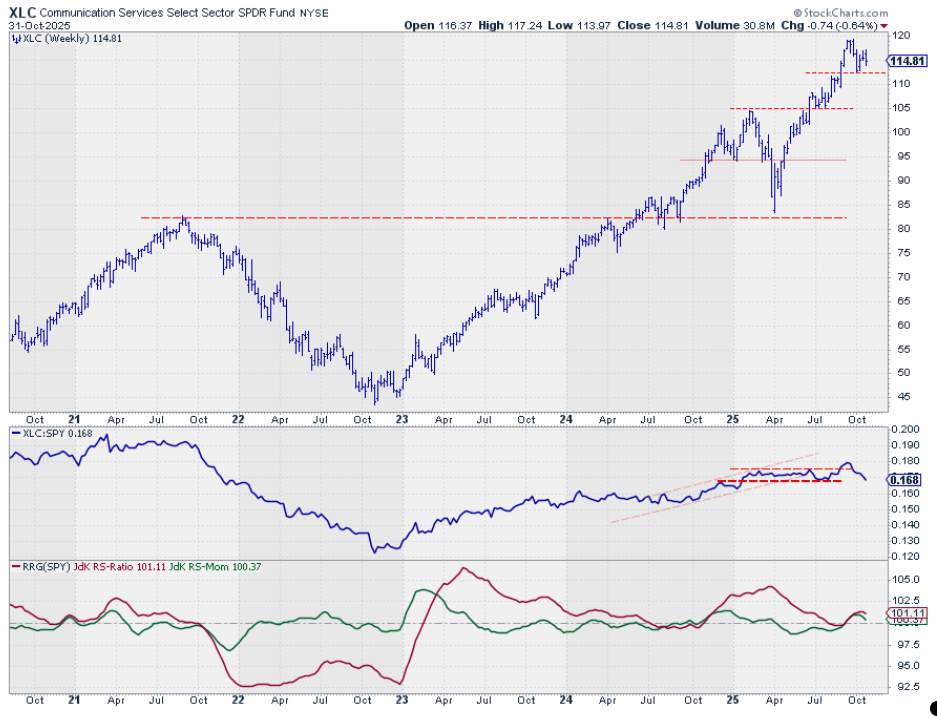
XLC appears to have formed a new lower high, a warning signal that demands attention. There's a fairly important support level just below $113. When that breaks, it'll very likely trigger more downside.
The raw relative strength line looks as if it's already discounting such a move, as it continues to decline, dragging both RRG lines down with it. They're still above 100, but they've turned around and are now both moving towards the 100 level. That means first weakening and then lagging if this continues.
Consumer Discretionary
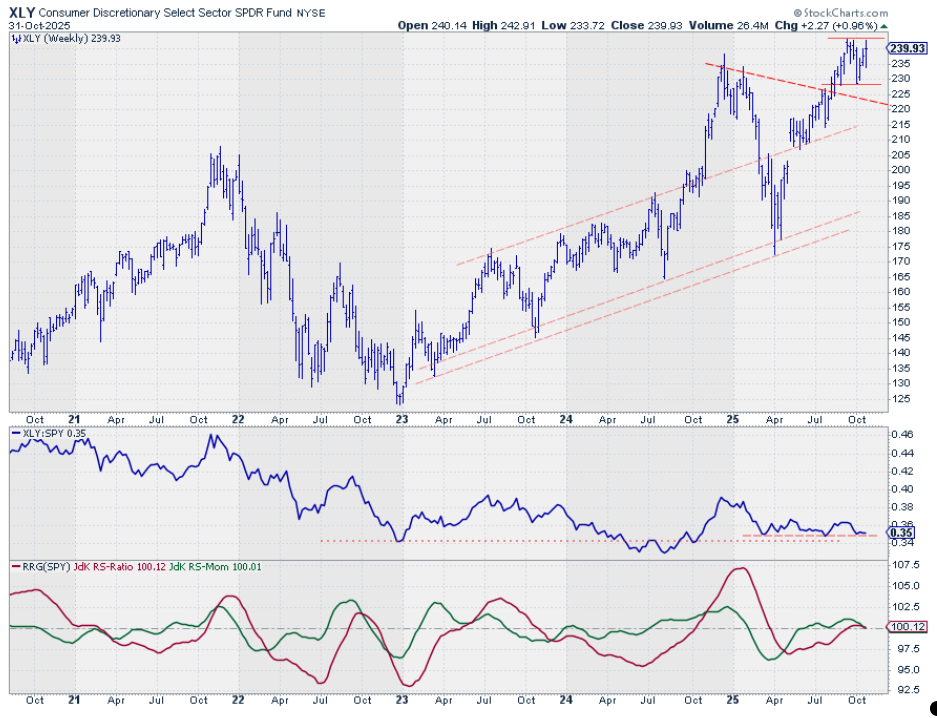
XLY actually recovered last week. The high last week was pushing up against overhead resistance from the weekly high set a couple of weeks ago in September, around 243.
The relative strength line for Consumer Discretionary is holding up at its support level. But because of the lack of upward movement, the RRG lines are now closing in on 100; they're both actually almost at 100. That means XLY is now almost at the center of the RRG, meaning its performance is more or less in line with the S&P 500 at the moment.
Utilities
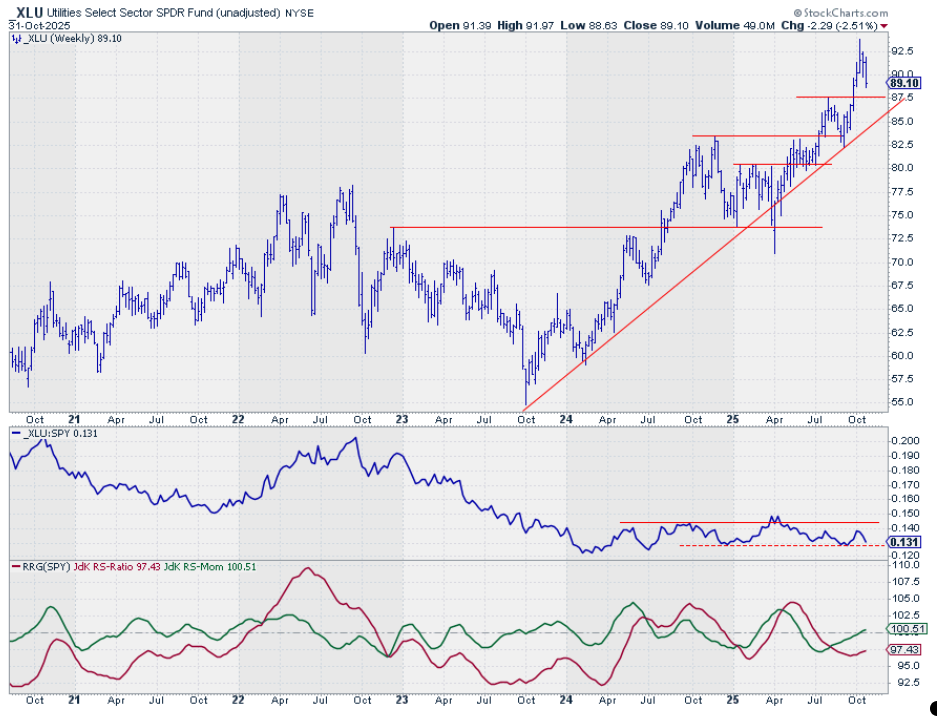
The sector closed at the lower end of the weekly bar and is moving back towards the $87.50 breakout level from a couple of weeks ago. The lack of follow-through has caused the raw relative strength line to move back to its lower boundary.
The weekly RRG lines are still digesting the improvement. The RS momentum line has peaked above the 100 level, and the RS ratio line has bottomed out, but it still needs a lot of work before it creeps back to 100. The Utility sector remains in the danger zone.
Industrials
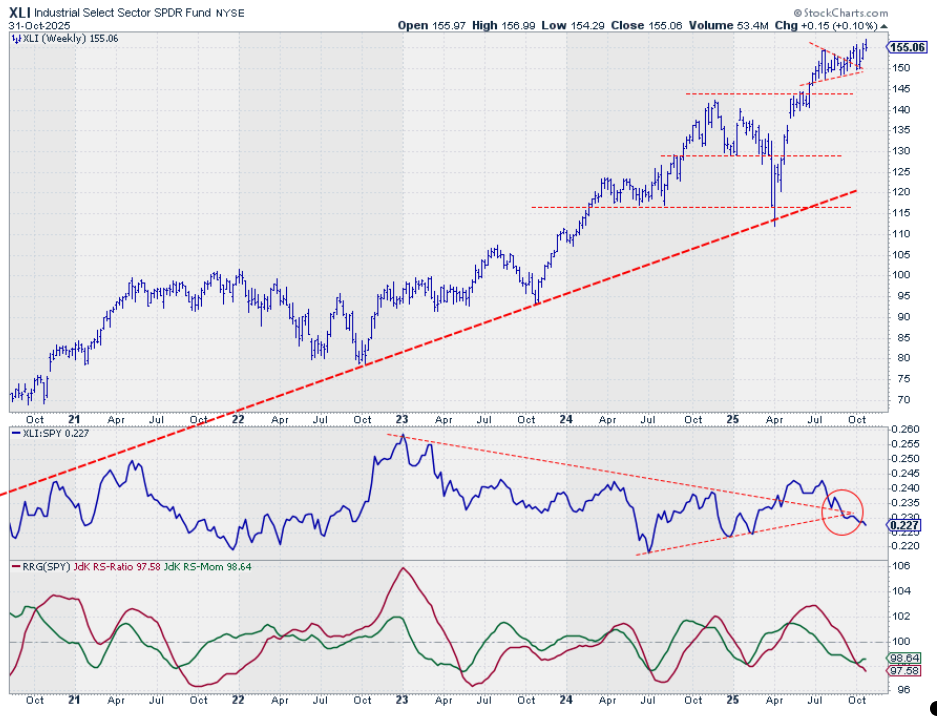
XLI is holding up relatively well from a price perspective; it crept to a new all-time high. But it's not doing it with much momentum or relative strength.
The RS line continues to move gradually lower at a stable pace, which is dragging both RRG lines lower. The red RS ratio line is now at the lowest level of this year. The RS momentum line has curled up slightly due to a loss of downside momentum, but it's still below 100, putting the Industrial sector well inside the lagging quadrant.
Portfolio Performance
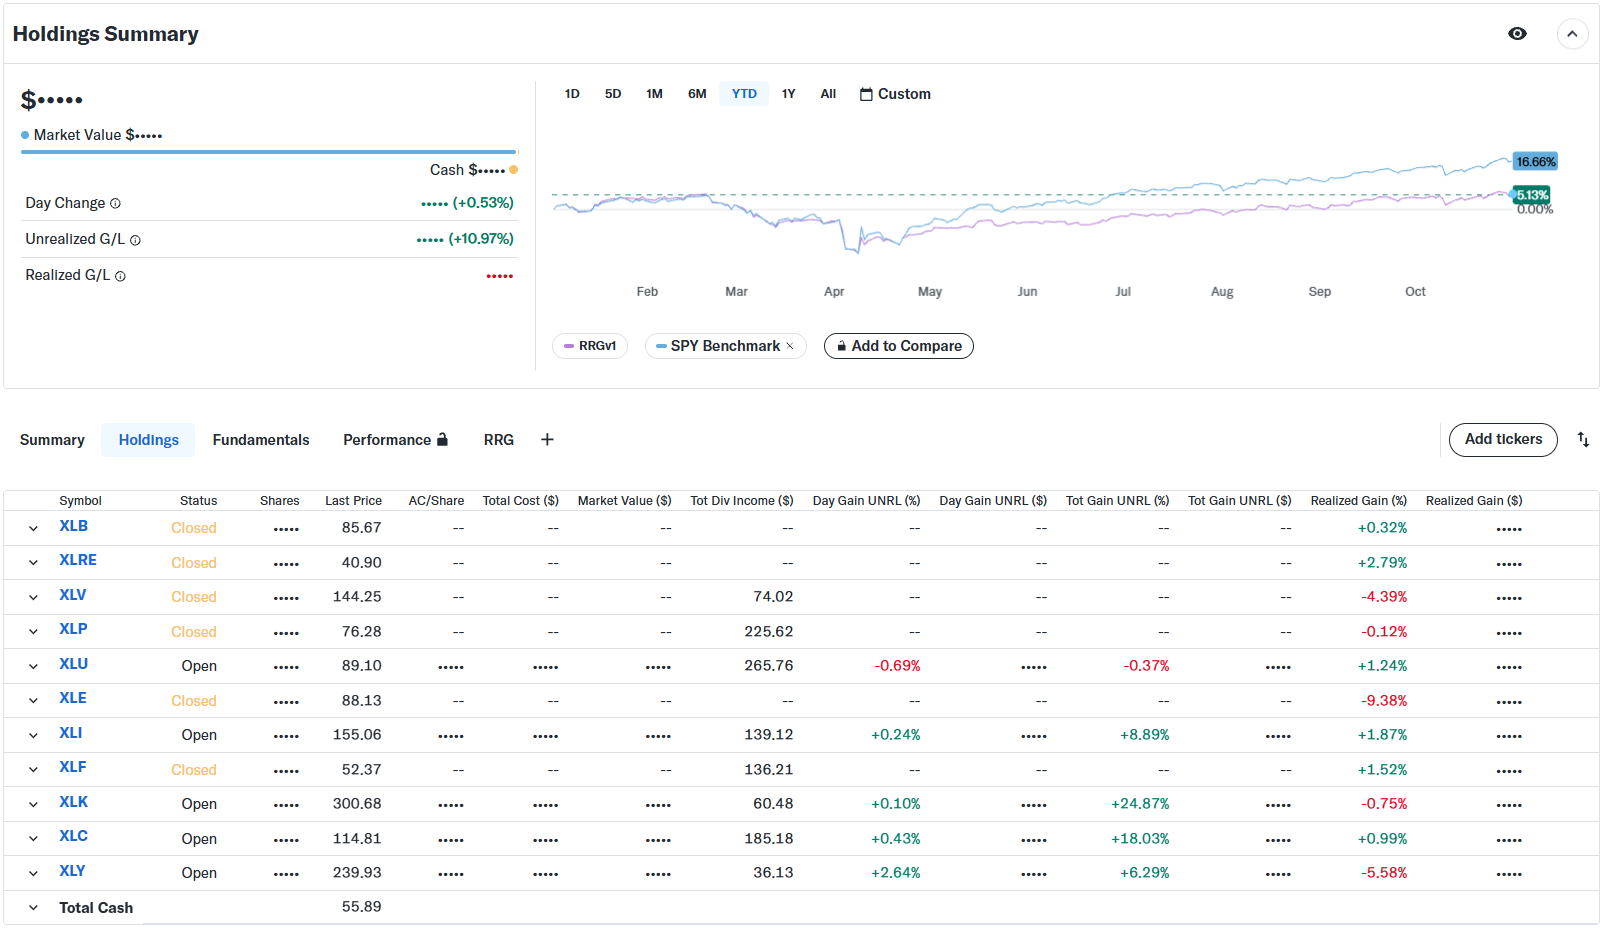
The portfolio performance remains lagging; it's around 11% behind the S&P 500. I'm reconciling all rankings since the start of this series and recalculating performance with a proper weighting scheme rather than equal weight.
One thing I've already discovered is significant. The Technology sector returned to the top five sometime in May and has probably been there ever since. With the Technology sector currently at 36% and a maximum portfolio weight of 20%, every week when the Technology sector is in the top five and rises, the portfolio's performance lags XLK by 16%.
It's quite a big dent in the potential performance when a proper weighting scheme is applied. It's a work in progress. I'll let you know as soon as I find out more.
#StayAlert and have a great week, --Julius


