The Best Five Sectors This Week, #45
Key Takeaways
- Technology maintains leadership but shows early warning signs on daily timeframe
- Healthcare surges to #2 position with strong momentum on both weekly and daily RRGs
- Consumer Discretionary and Communication Services deteriorate into lagging quadrant
- Energy replaces Utilities in top five with improving relative strength
- Volatility in SPY creates notable ranking changes across sectors
After a week in which SPY initially rose to almost 685 points, the market closed with a couple of very weak days and finished nearly unchanged. This volatility caused several notable changes in the sector rankings that are worth examining closely.
Sector Ranking Changes
Technology continues to hold the number one position. Healthcare has risen to number two from four last week, a significant move that's pushing Consumer Discretionary to number three from two and Communication Services to number four from three.
The change in the top five comes from Utilities, which has left the top five again and been replaced by Energy, jumping to #5 from the number seven position. That leaves Utilities at six, and Industrials at seven, while the remaining sectors are unchanged. Financials remains at eight, Real Estate is at nine, Materials is at 10, and Consumer Staples rounds out the ranking at 11.
- (1) Technology - (XLK)
- (4) Healthcare - (XLV)*
- (2) Consumer Discretionary - (XLY)*
- (3) Communication Services - (XLC)*
- (7) Energy - (XLE)*
- (5) Utilities - (XLU)*
- (6) Industrials - (XLI)*
- (8) Financials - (XLF)
- (9) Real-Estate - (XLRE)
- (10) Materials - (XLB)
- (11) Consumer Staples - (XLP)
Weekly RRG
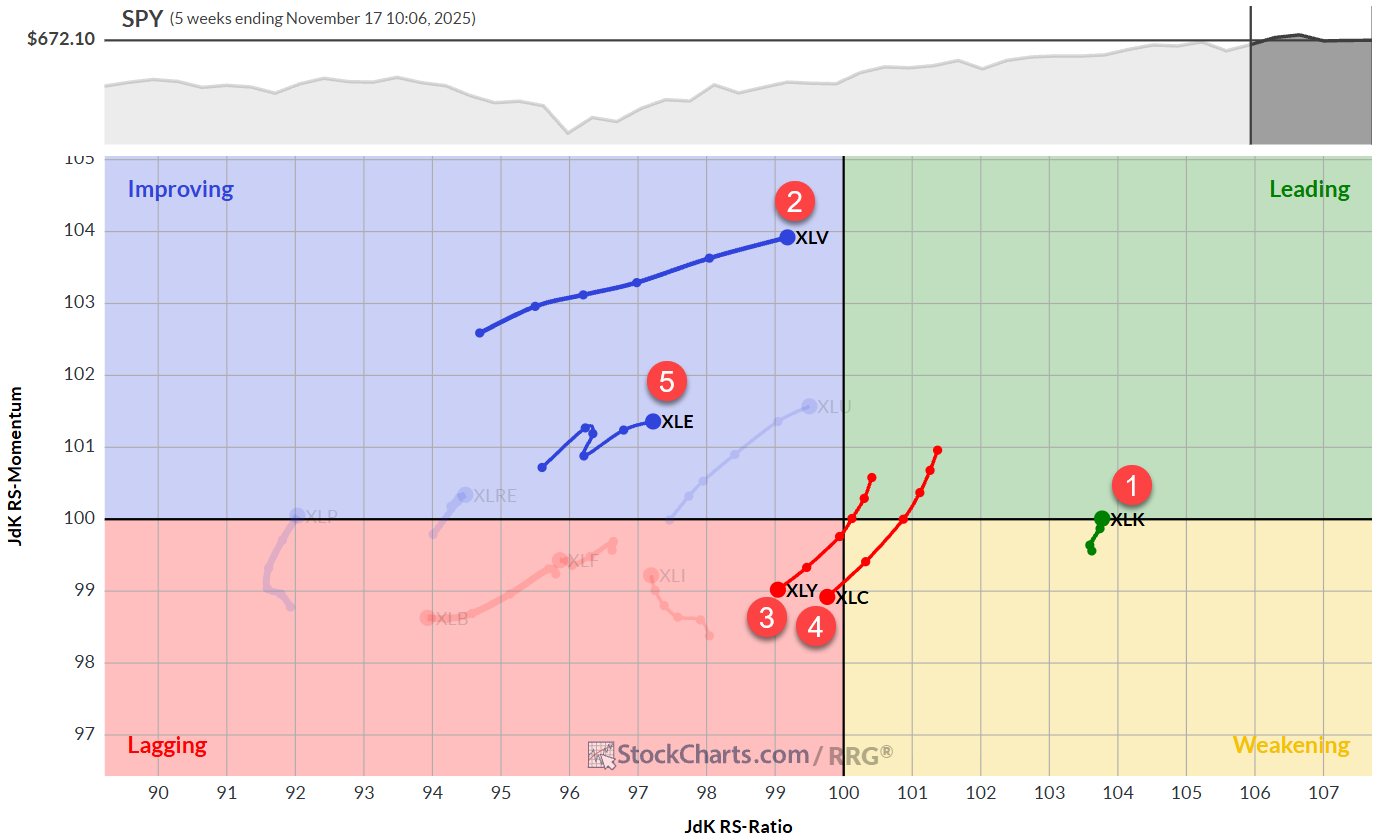
On the weekly RRG, we see Technology disconnected from the other sectors, crossing over into the leading quadrant and maintaining its number one position. The sector that is really picking up steam now is Healthcare. The strong RRG Heading and the long tail moving rapidly towards the leading quadrant indicate the pickup of strength for this sector. And that puts Healthcare in the number two position right now.
Consumer Discretionary, still at number three, has now rotated into the lagging quadrant on this weekly RRG. Communication Services, still at the number four position, is rapidly losing relative momentum and relative strength entering the lagging quadrant as well.
The fifth sector inside the top five is now Energy, which has a positive heading on the weekly RRG. We'll see an even stronger improvement on the daily timeframe.
Daily Relative RRG
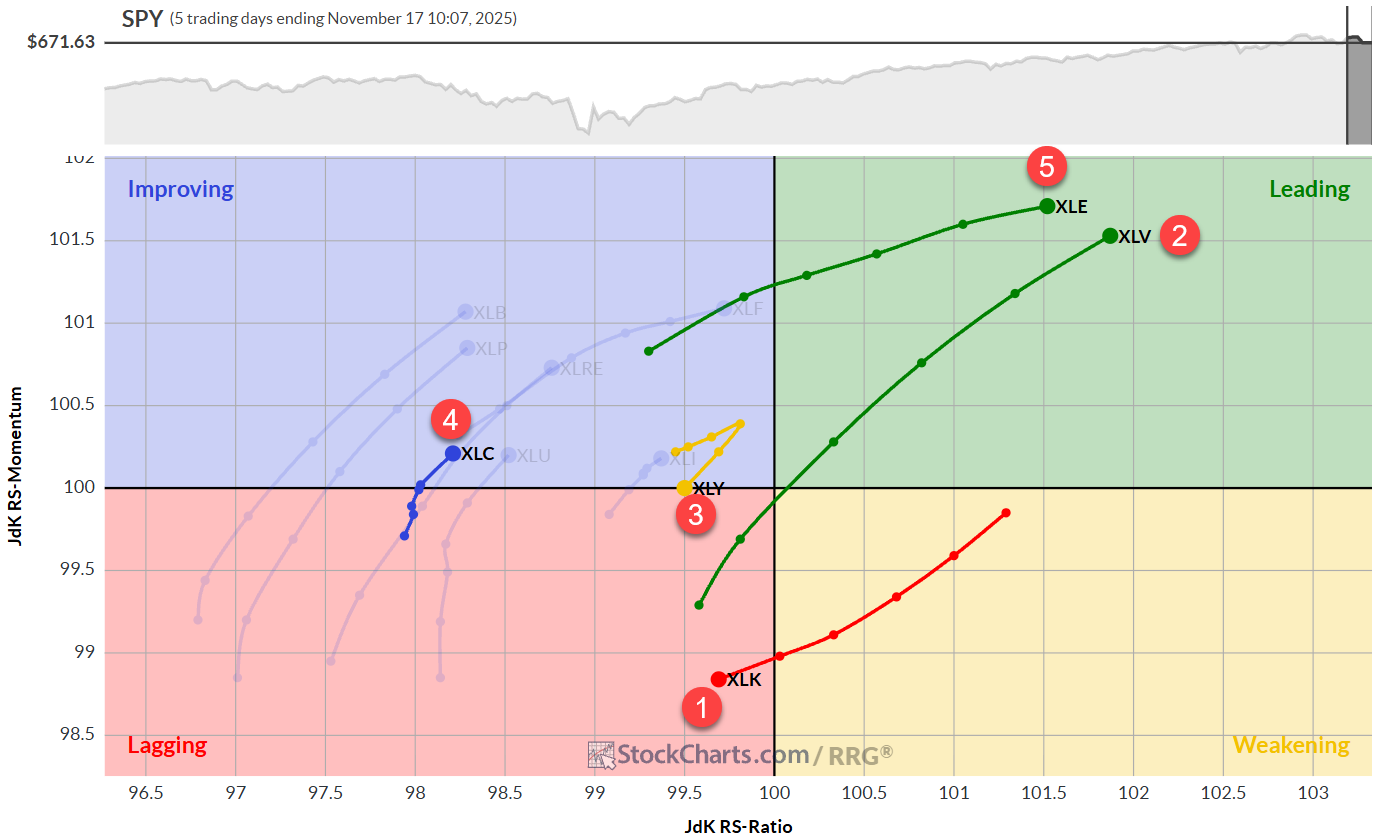
Going to the daily RRG, we see Technology now rotating into the lagging quadrant. With the current situation, it will be interesting to see whether this is a first sign of deterioration, which will eventually spill over to the weekly rotation, or if this is just a temporary rotation on the daily chart, which will eventually get back in sync with the weekly again.
Healthcare, the number two sector with a strong tail on the weekly RRG, is showing a tail that is probably even stronger on the daily. It's now the highest-ranking sector on the RS-Ratio scale, with very high relative momentum and a very long tail.
Consumer Discretionary is confirming the weakness that we saw on the weekly RRG. It's now rotating back into the lagging quadrant, coming out of improving. That is definitely a deterioration for the Consumer Discretionary sector.
Communication Services is picking up a little bit of relative momentum, so it's going counter to its weekly tail. But it's still on a very low reading in terms of RS-Ratio. We definitely have to be careful with Communication Services.
Energy is joining the Healthcare sector with a strong tail into the leading quadrant on the daily RRG.
Technology
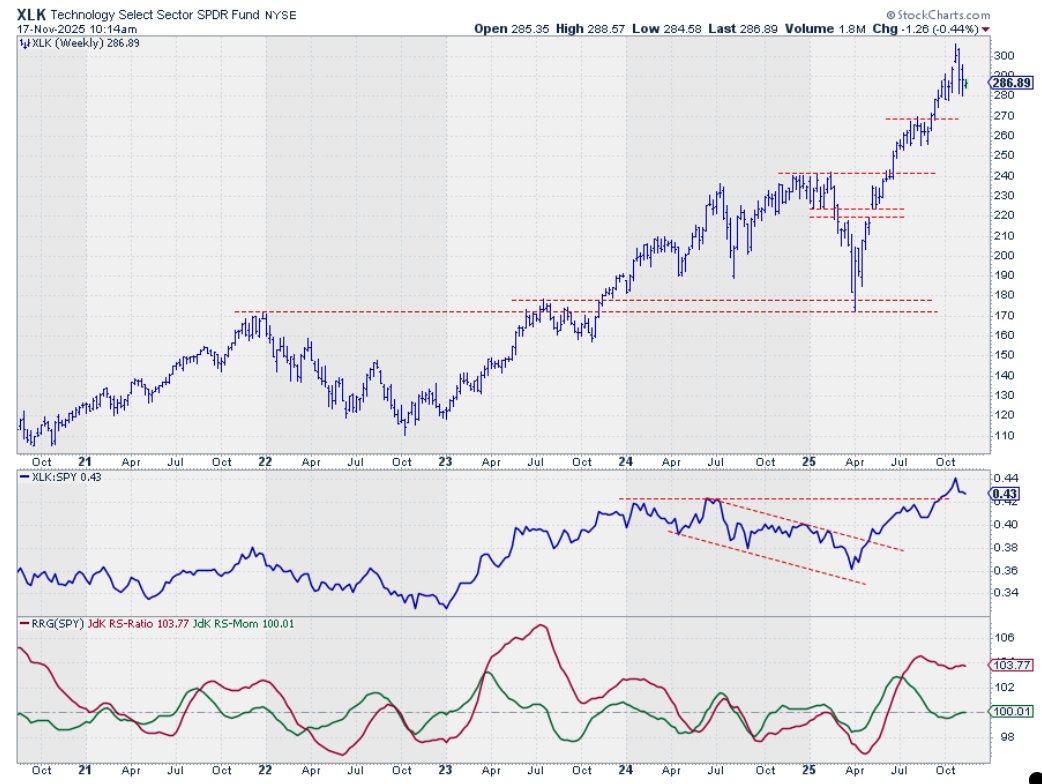
The price chart is still holding up very well, and actually, so is relative strength. Despite the weak rotation on the daily RRG, which reflects short-term weakness, this trend remains intact both in price and relative terms.
Healthcare
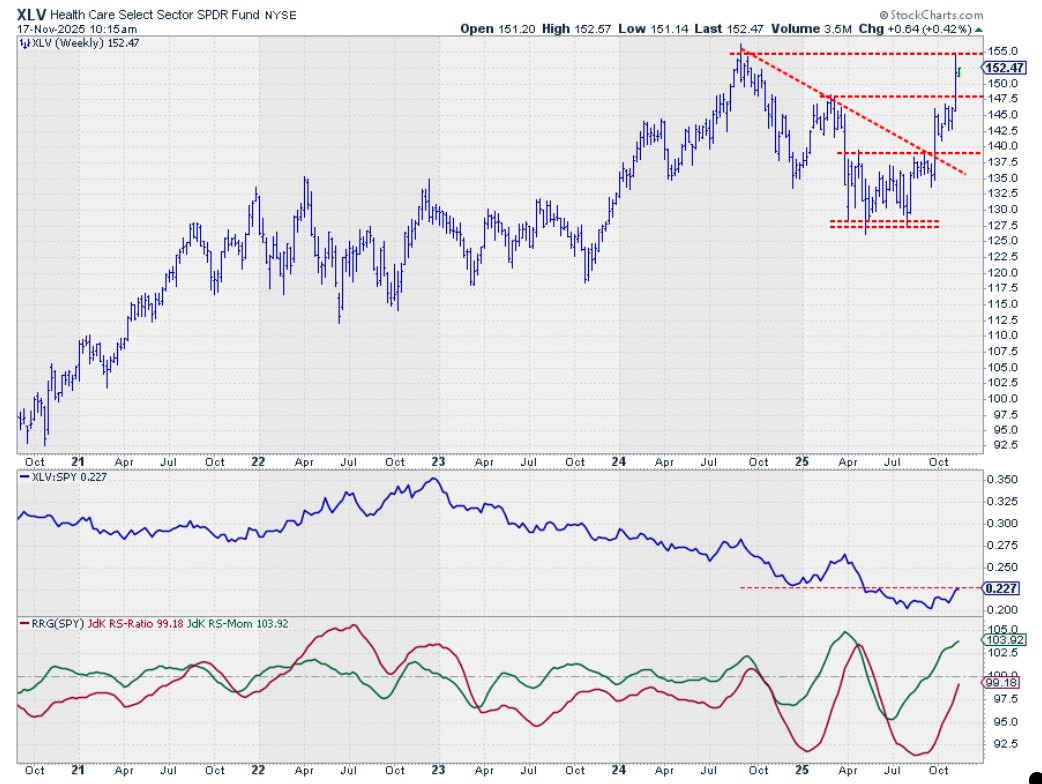
This sector is one of the big winners this week. The price chart has tested overhead resistance around 155 and is still holding up after last week's breakout.
We see the bottoming process on the raw relative strength line continuing and starting to put in the first signs of higher highs and higher lows on the RS line, and this is dragging both RRG lines higher.
Consumer Discretionary
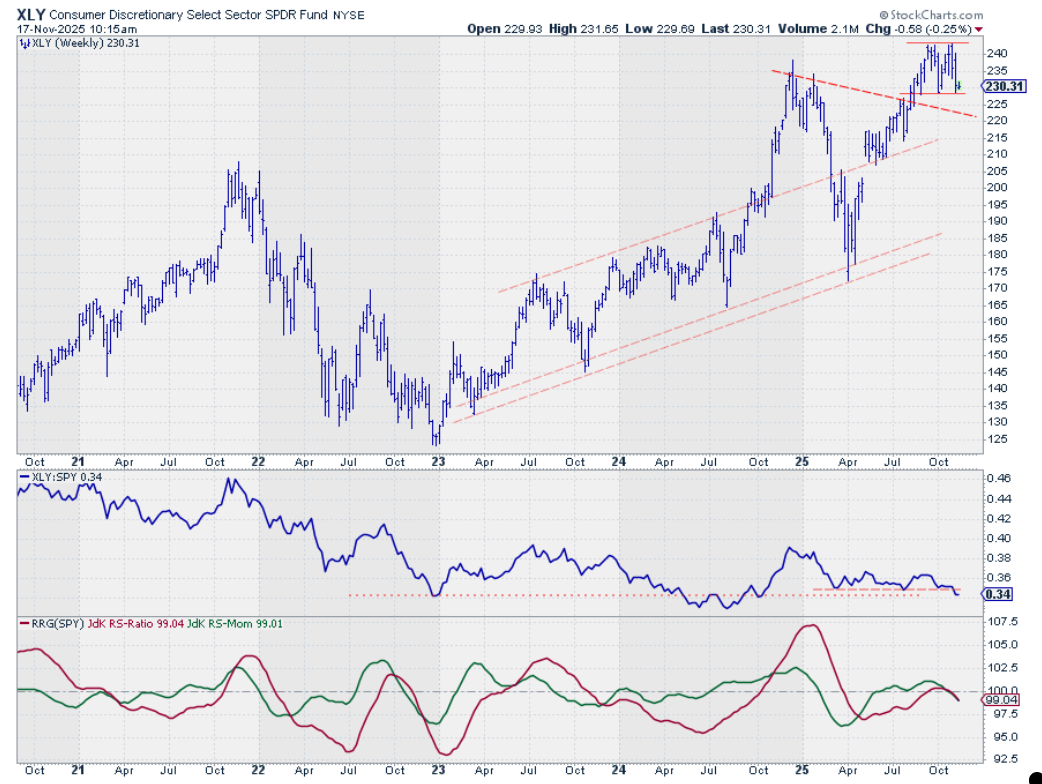
On the price chart, XLY is still holding above support, but this pattern is now starting to look like a potential double top.
When that support level breaks, it's definitely a completed double top, which would be a negative signal for the price.
However, the real danger here is coming from relative strength, where you can see that the raw RS line is now breaking its horizontal support levels. That is turning the RRG lines down rapidly; they're on top of each other right now, which means an almost 45-degree angle negative heading into the lagging quadrant.
Communication Services
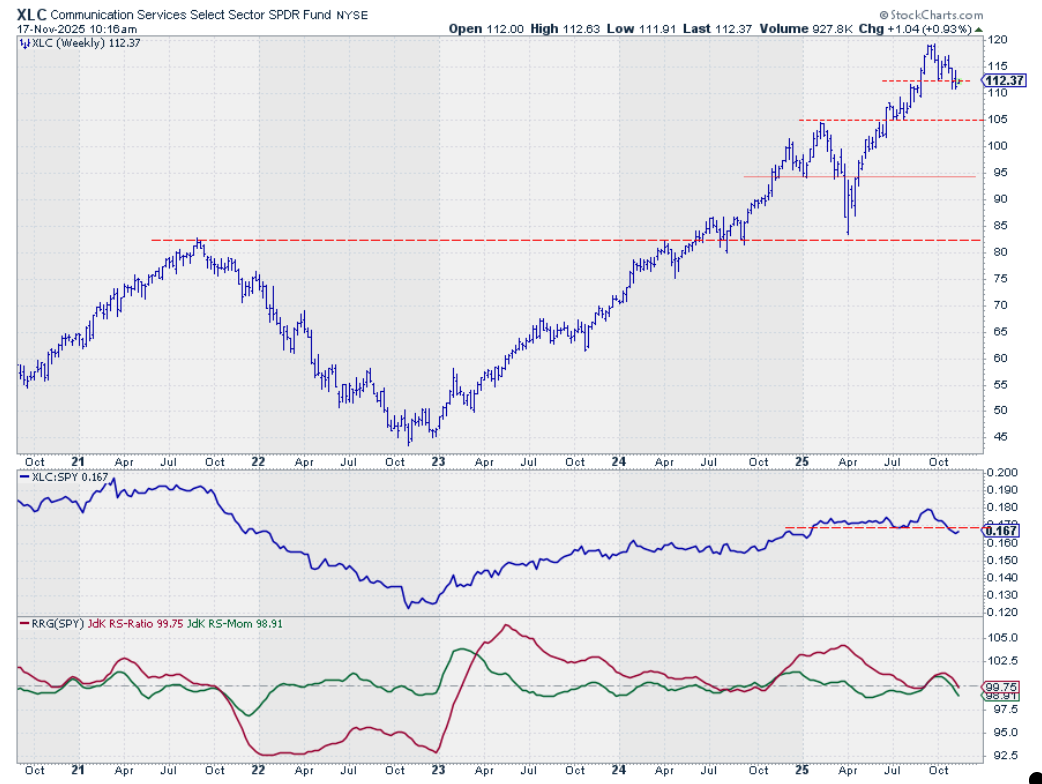
XLC is following a weaker path, just as Consumer Discretionary is. When you look at the price chart, you will see that a rhythm of lower highs and lower lows has set in.
But more importantly, you see that the raw RS line is breaking below its previous low, which we should view as negative. That situation is dragging both RRG lines below 100, putting the sector in the lagging quadrant on the weekly RRG.
Energy
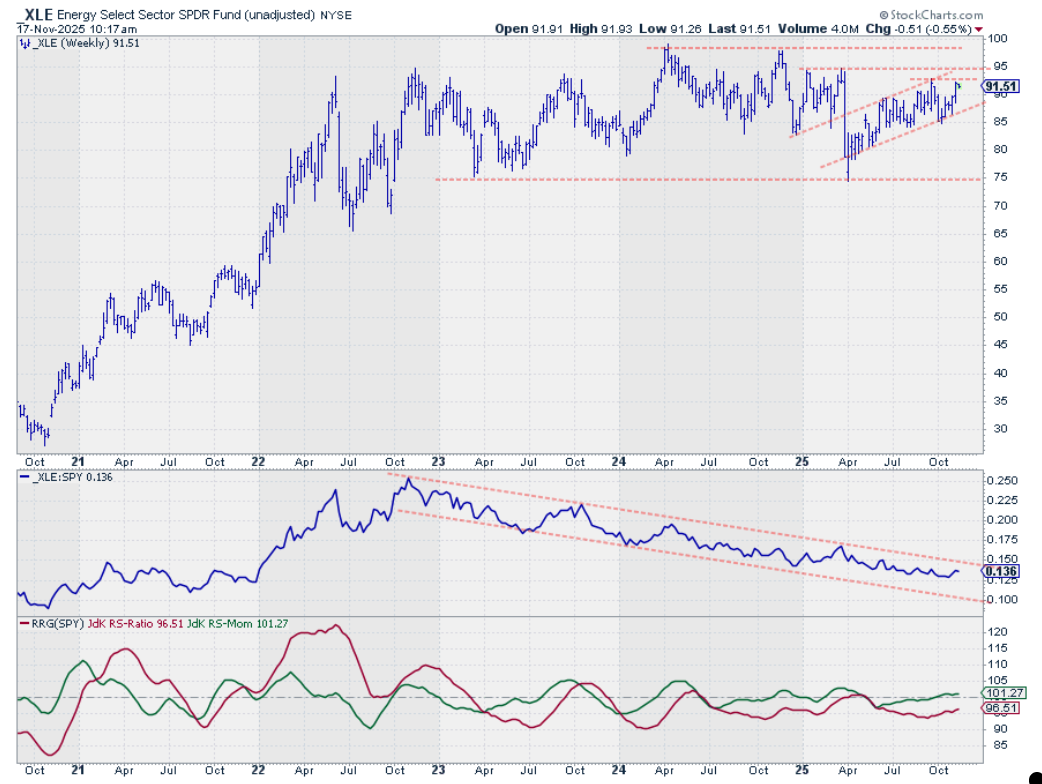
The newcomer in the top five this week is XLE, still in its shallow rising trend on the price chart, testing overhead resistance around 92 to 92.50, and running for 95 and possibly 97.50.
The raw RS line is still in a downtrend, but it's losing its negative momentum. That's what you see being picked up by the RRG lines, where the green RS-Momentum line has already crossed above 100, and it's now starting to drag the RS-Ratio line higher.
Portfolio Performance
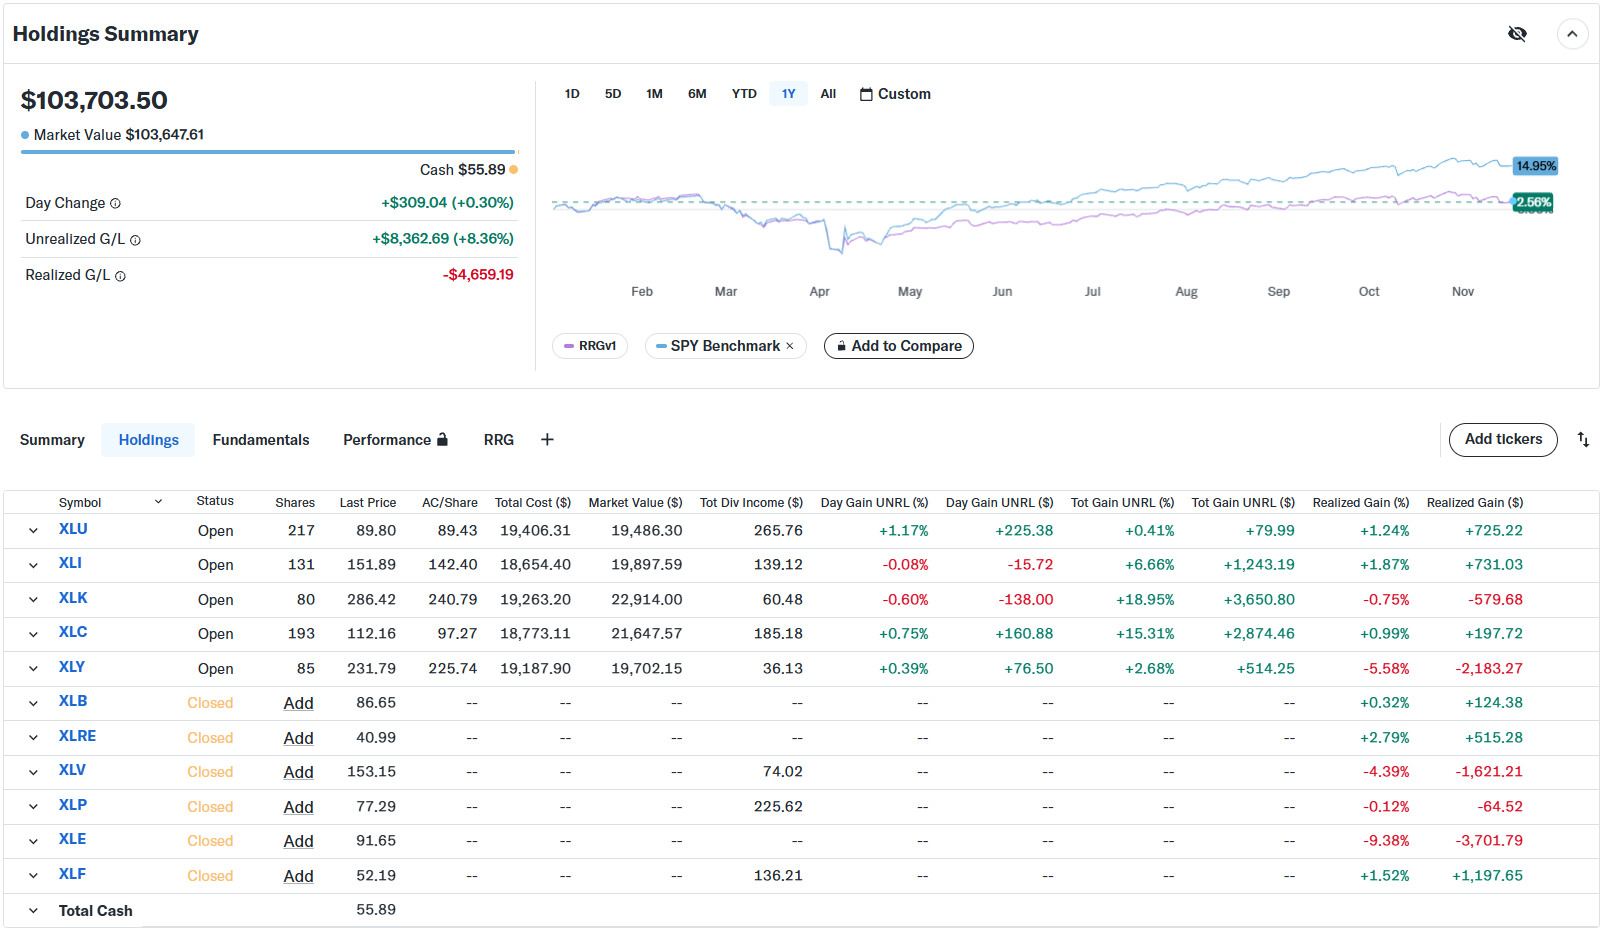
We continue to lag the S&P 500 with this equal-weight portfolio. I owe you a video explaining the new results and the new weighted results, where we are still ahead of the S&P 500 based on the proper weighting scheme. That content will follow soon.
#StayAlert, -Julius


