The Best Five Sectors This Week, #49
Key Takeaways
- Technology sector returns to number one ranking after a week of losses
- Nasdaq dropped 1.8% while S&P 500 declined just 0.25%
- Utilities tumbled from fifth to eighth position
- Daily RRG shows tech entering leading quadrant but immediately losing momentum
- Communication services now holds highest RS ratio ranking on daily timeframe
Tech Reclaims Top Spot Despite Weekly Weakness
Reviewing last week's market action and the sector ranking that emerged from it made me frown. The markets had taken a slight tumble, with the S&P barely dipping 0.25% yet the Nasdaq told a different story, plunging nearly 1.8% on the back of weakness in technology. What caught my attention, though, wasn't just the decline itself, but that despite this decline, XLK rose to the top of the ranking once again, pushing Healthcare down to #2.
The most notable move was for Utilities. This sector dropped out of the top 5 and fell all the way down to #8. Its position was taken by Energy's return to the portfolio.
- (2) Technology - (XLK)*
- (1) Health Care - (XLV)*
- (3) Communication Services - (XLC)
- (5) Consumer Discretionary - (XLY)*
- (6) Energy - (XLE)*
- (7) Industrials - (XLI)*
- (8) Financials - (XLF)*
- (4) Utilities - (XLU)*
- (9) Materials - (XLB)
- (11) Consumer Staples - (XLP)*
- (10) Real Estate - (XLRE)*
Weekly RRG
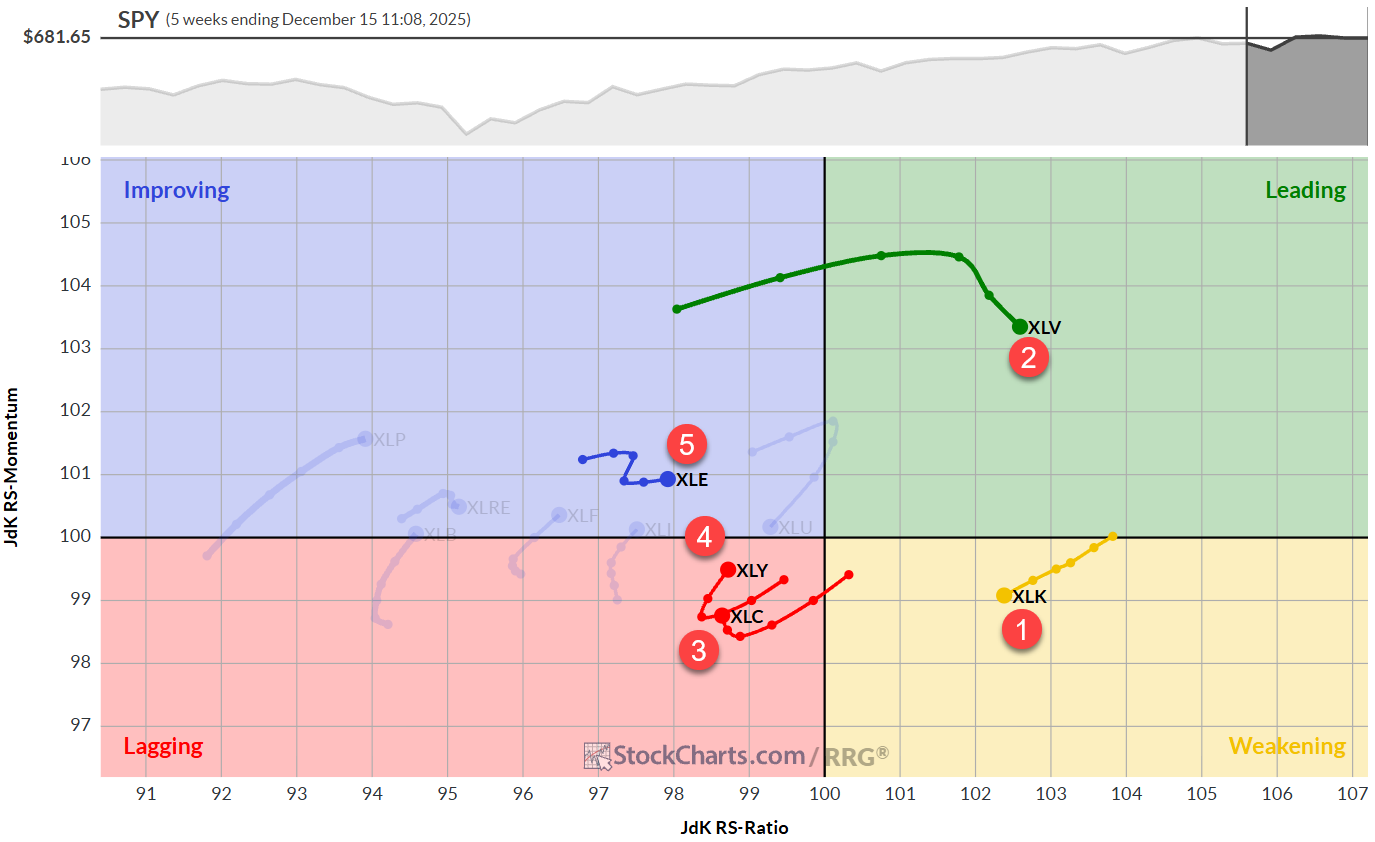
Looking at the weekly RRG for these five sectors, where XLK is still inside the weakening quadrant and traveling at a negative RRG heading, makes you wonder how the technology sector could rise to the number one position in the ranking. It's a curious situation when the top-ranked sector shows a weaker rotation on the longer timeframe.
Health care, on the other hand, sits comfortably inside the leading quadrant at position number two with only a little loss of relative momentum, displaying much more stability. The different trajectories of those two sectors make a good example of how daily and weekly rotations can conflict or complement each other.
Both communication services and consumer discretionary reside inside the lagging quadrant, yet both are hooking back up, curling upward in a way that suggests renewed strength may be building.
Energy continues its journey inside the improving quadrant, steadily moving to the right, which translates to higher readings on the RS ratio scale.
Daily RRG
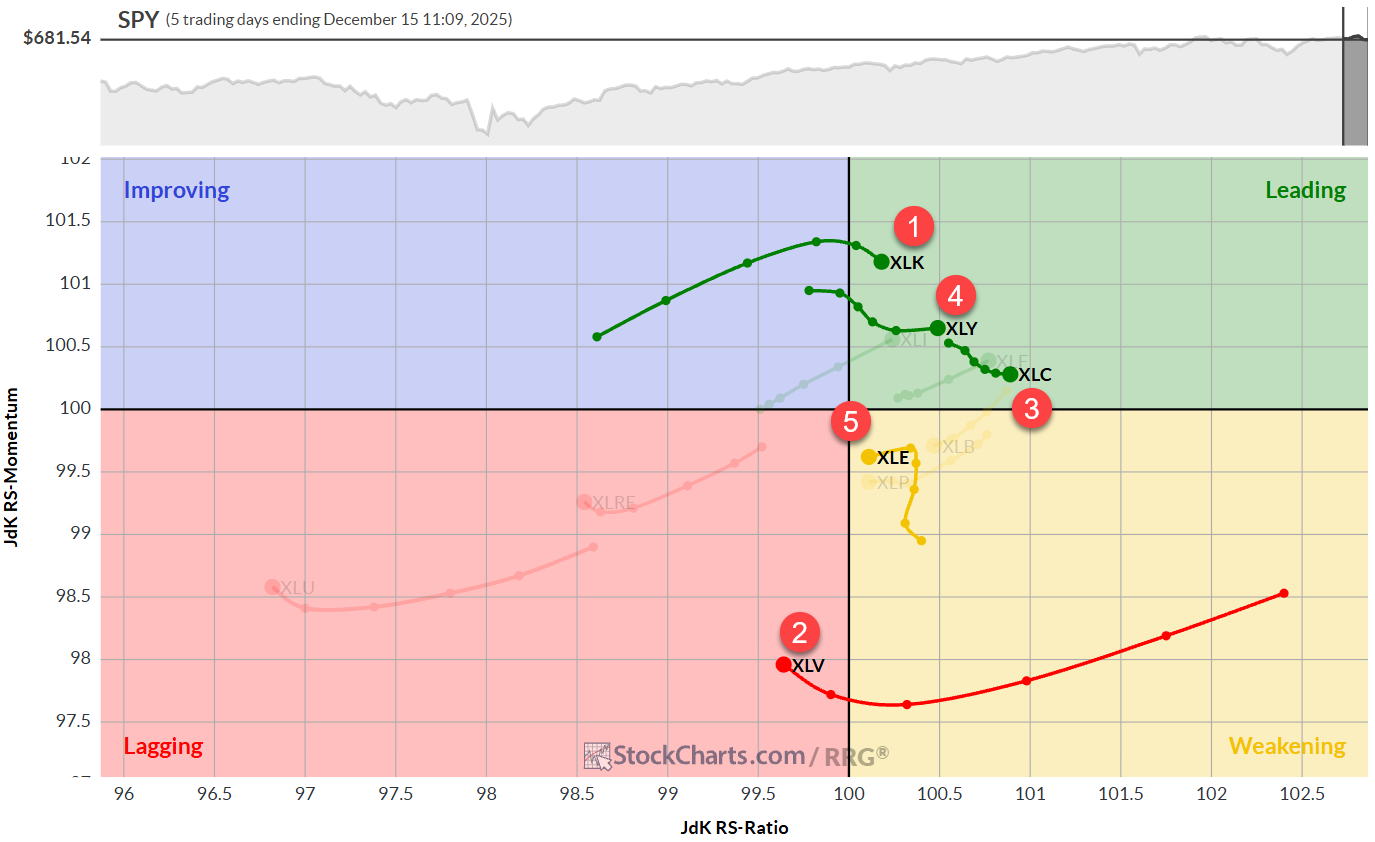
Switching to the daily RRG shows why technology managed to reclaim the top spot. It made a powerful surge through the improving quadrant and just crossed into the leading quadrant, while health care executed the exact opposite maneuver. This swap in positions is clearly visible on this daily Relative Rotation Graph.
What concerns me slightly, though, is that technology immediately began losing momentum the moment it entered the leading quadrant. I've seen this pattern before, and it's not the strongest signal. Health care is exhibiting similar behavior on the opposite side inside the lagging quadrant, reaching it and immediately starting to curl back up, which actually gives me more optimism about its near-term prospects.
Communication services continues to impress me as it holds steady inside the leading quadrant, persistently climbing higher on the RS ratio scale. In fact, XLC now has the highest RS-Ratio reading in the universe.
Consumer discretionary is stabilizing on the RS momentum scale and continues to move higher, indicating a stronger relative trend is taking shape. Energy, interestingly, is moving in the opposite direction from its weekly pattern, residing inside the weakening quadrant and nearly crossing back into lagging. This combination of timeframes is what places XLE at the number five position in our top five.
Technology
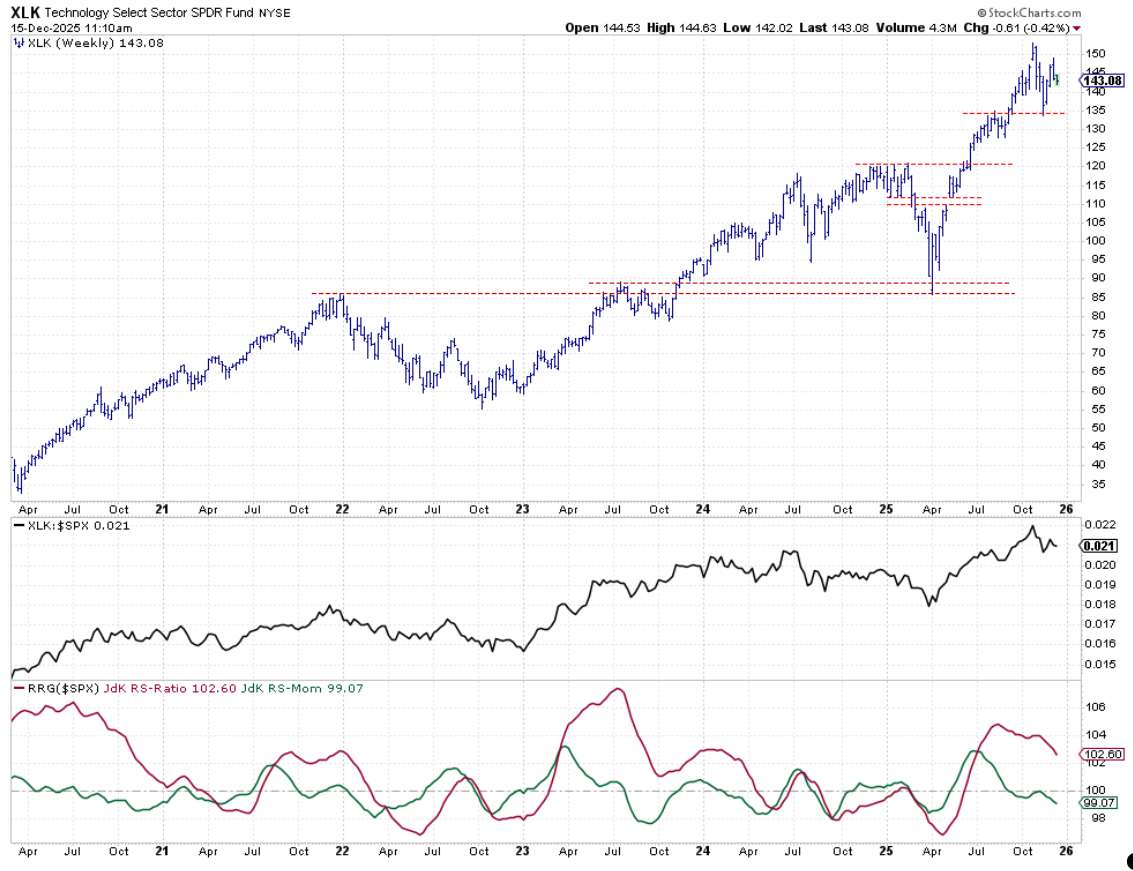
Technology bounced back off the support area around 132, and over the past couple of weeks, XLK stalled in the middle of the recent decline, like a ship steadying itself after rough seas.
The raw RS line is stabilizing and has found a bottom at what was previously a resistance level, now acting as support. These role reversals often mark important turning points. The absence of further upside in relative strength has caused the RRG lines to drift lower for now. However, the RS ratio line remains at elevated levels on the relative rotation graph.
Healthcare
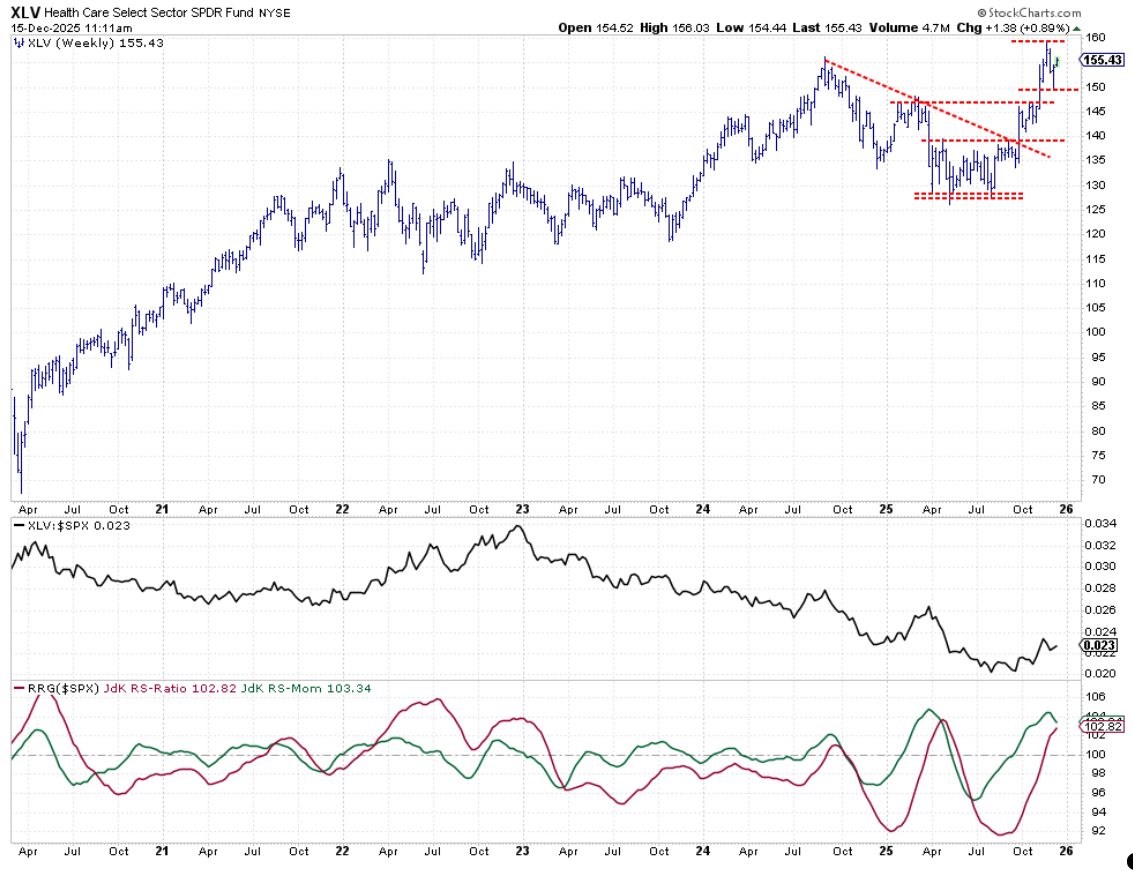
The healthcare sector's chart tells a story of resilience. It bounced off a new higher low, and now it's making its way back up toward overhead resistance near 157.50
The RS line is still attempting to turn around from the downtrend that started at the beginning of 2023.
On a positive note, both RRG lines are positioned above 100, with the RS ratio still rising. This is a sign of strength.
Communication Services
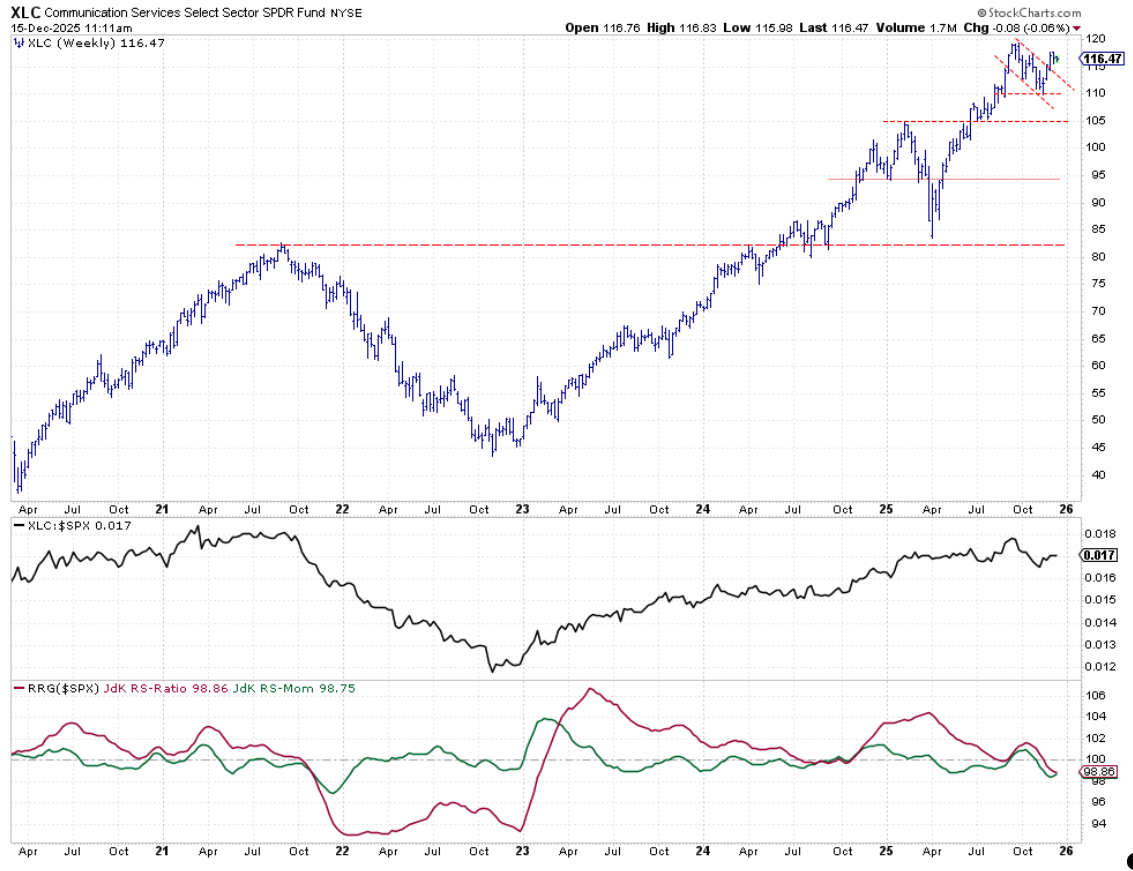
Communication services broke out of its flag-like pattern, and is holding steady around 116. The raw RS line is starting to grow back up, but we need more upside relative strength to really turn both RRG lines around.
Right now, they're positioned below 100, which explains why XLC sits inside the lagging quadrant. Renewed relative strength will help to turn both lines up and above the 100 level.
Consumer Discretionary
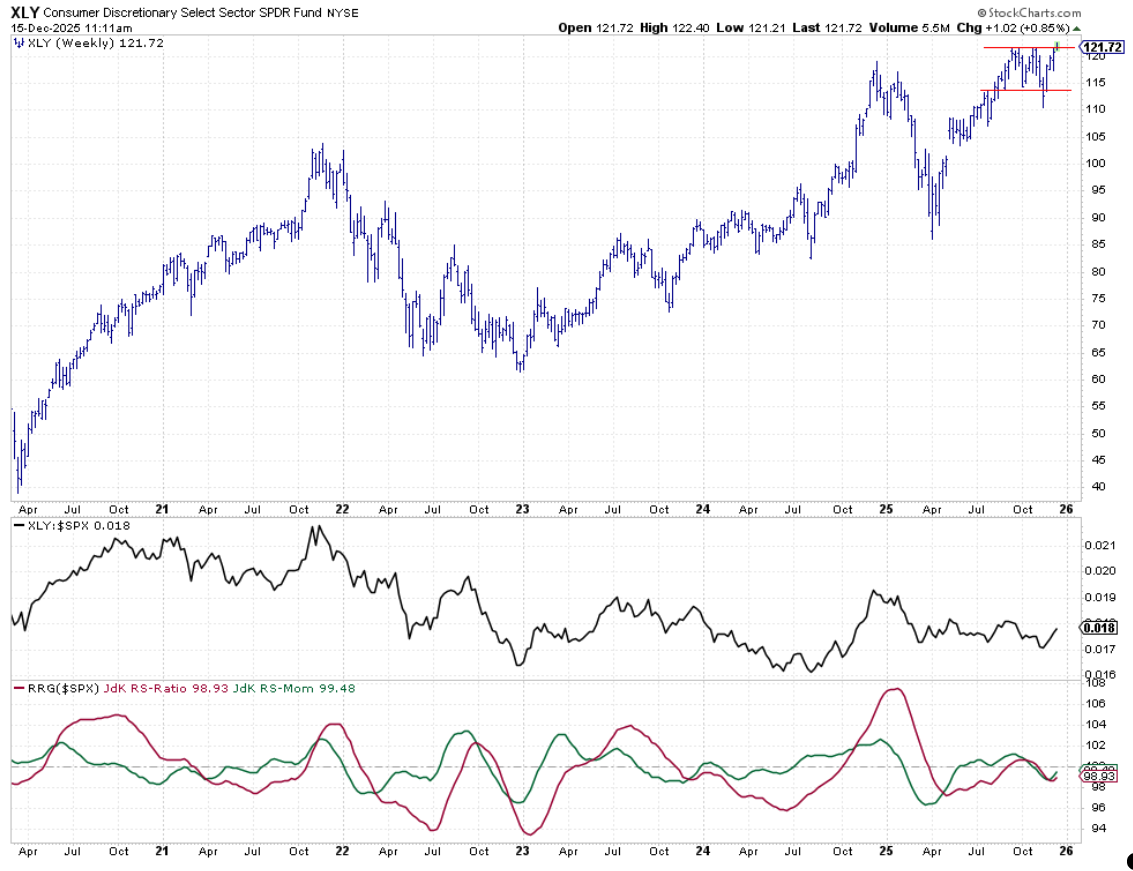
XLY is attempting to break to new all-time highs. That resistance area sits around 120–121 and is currently being tested. When we can convincingly break through that overhead barrier, it will send a very strong signal for the consumer discretionary sector.
The RS line is moving sideways at the moment, but once the price breaks upward, that will undoubtedly help RS move higher. The RRG lines have both turned up, albeit very early in the process, and they're now inside the lagging quadrant, moving towards improving.
Energy
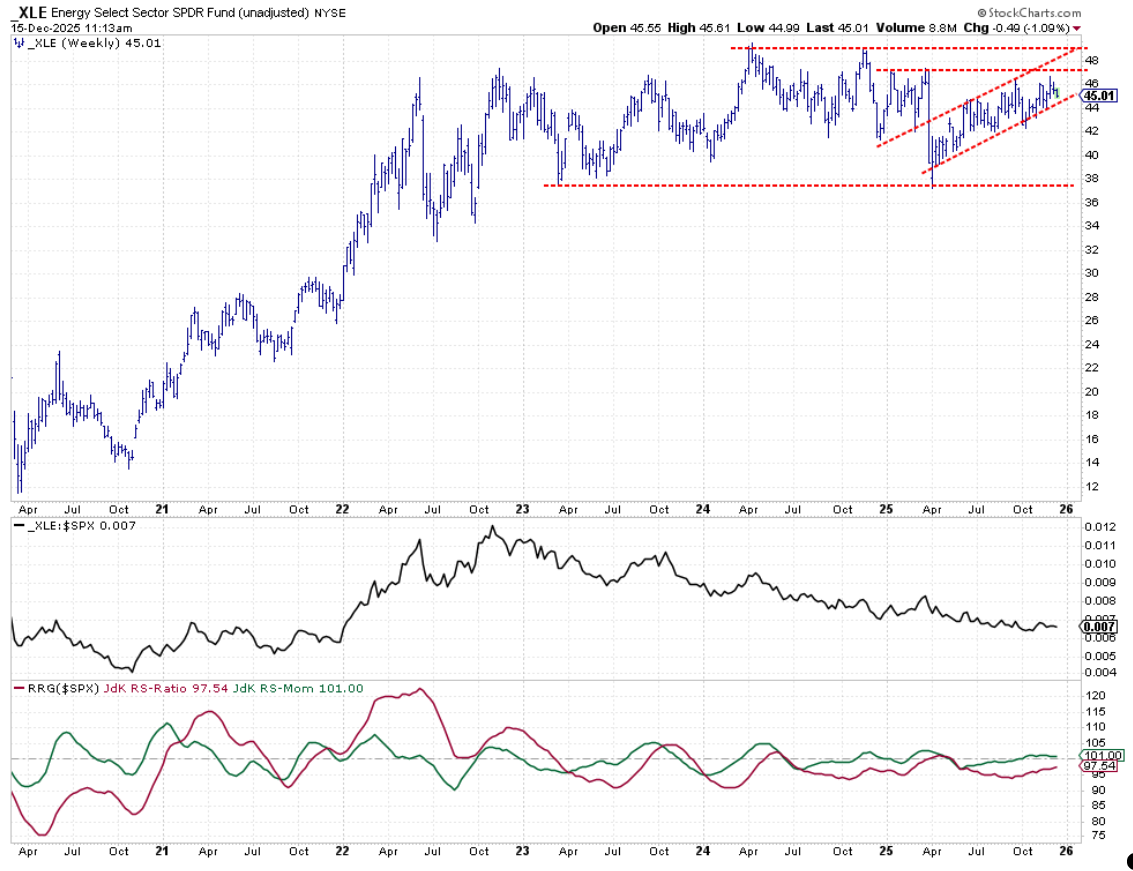
The energy sector, our newest member in the top five, presents an interesting technical picture. There are two distinct patterns visible. First there's a very broad trading range that stretches back to 2023, moving sideways between roughly 37 and 49.
Then, since the start of this year, basically at the beginning of Q2, there's a very shallow rising channel, within which XLE continues to trade gradually higher.
This price action has caused the raw RS line to move sideways and stabilize and both RRG lines to move almost sideways, with a slight upward bias, indicating a very slow but positive directional move.
Portfolio Performance
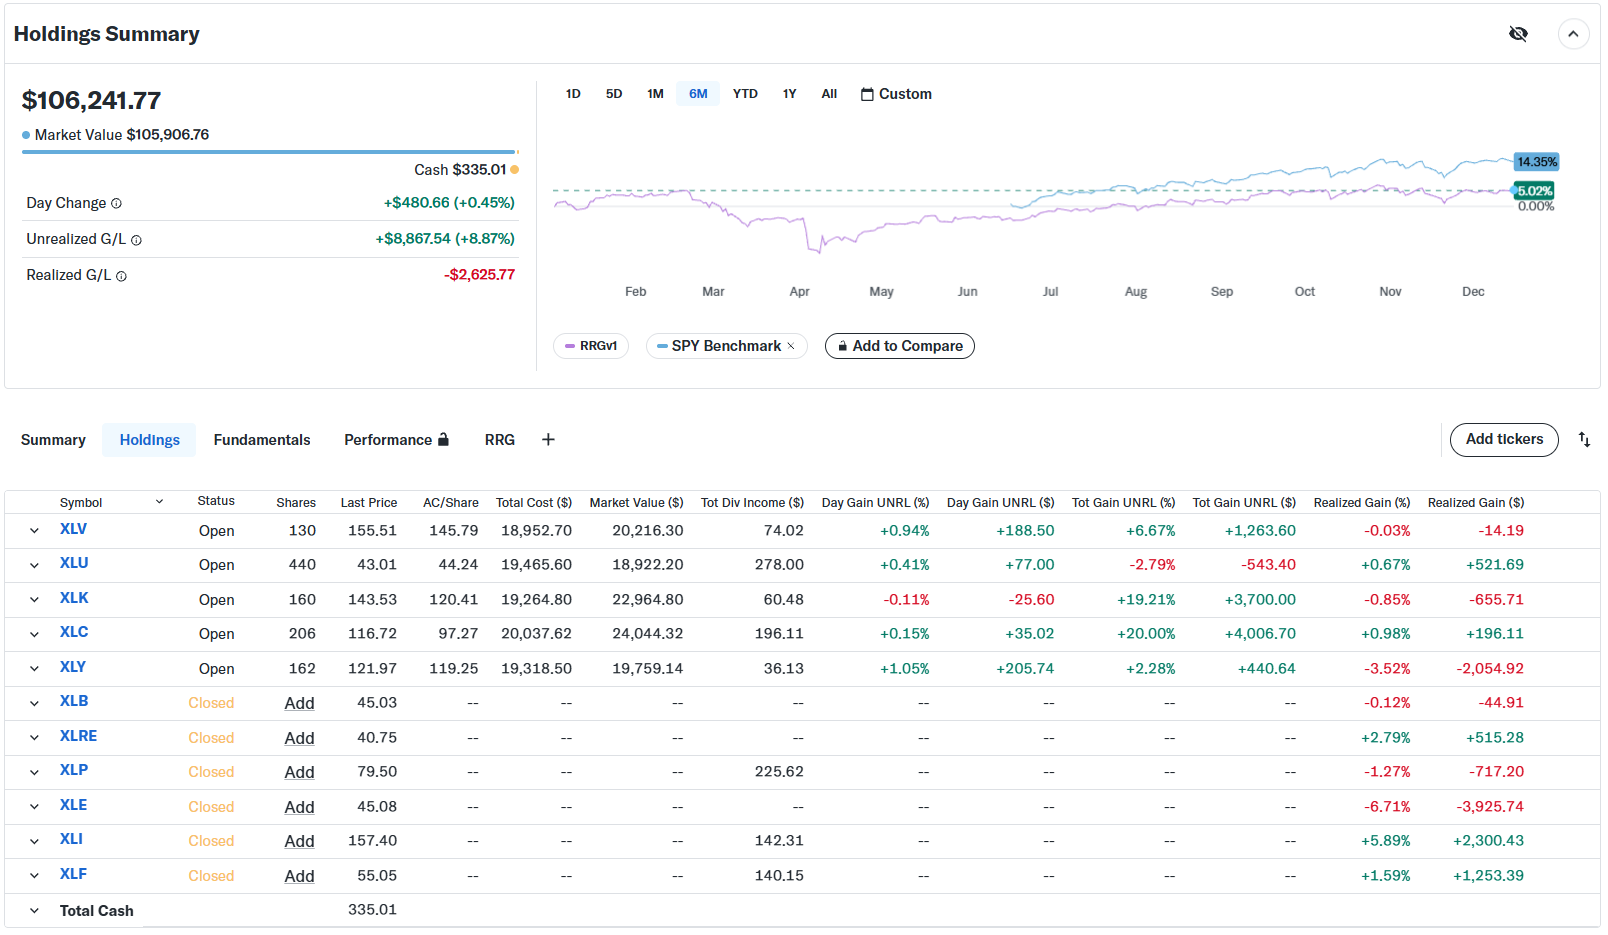
The equal-weight portfolio is still lagging the benchmark, but the gap is narrowing. We're now around 11% behind, down from around 13%, so we're making progress.
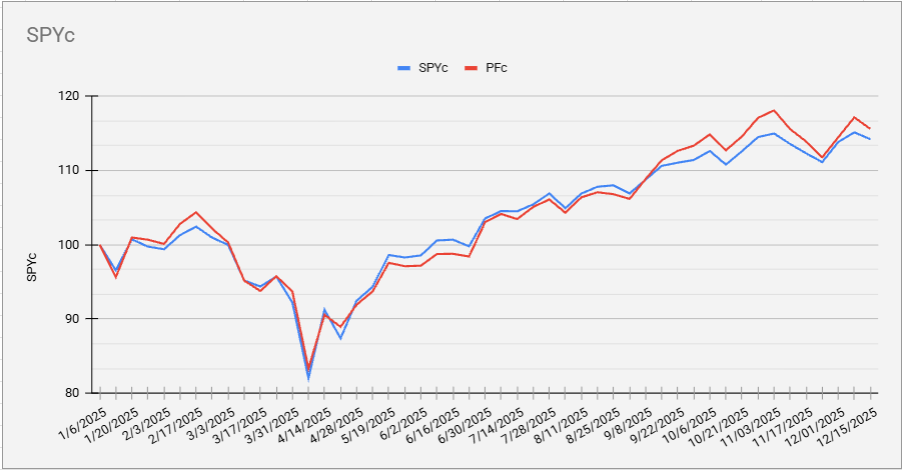
On the cap-weighted portfolio, we've managed to stay slightly ahead of the S&P 500.
#StayAlert and have a great week. --Julius


