The Best Five Sectors This Week, #51

Key Takeaways
- Health Care reclaims the top spot while technology slides to number two
- Financials enter the top five as true sector rotation picks up momentum
- Technology faces pressure on both weekly and daily RRG timeframes
- S&P 500 peaked well above its previous high after a 2%+ Santa rally
After a week in which Santa brought us a rally of a little over 2%, the S&P 500 peaked at a new all-time high before dropping slightly into last Friday's close at its highest level ever, above the previous high at 6930. It was a good week and a strong sign for the stock market as a whole.
But what did that do for our sector ranking? Taking a look, we can see some real changes happening under the hood.
Sector Ranking Changes
At the top of the list, health care once again pushed Technology back to number two. Financials has now entered the top five, pushing out industrials, which only came in last week. With all the changes at the bottom of the top 5 over the past weeks, it is clear that there is sector rotation going on.
At the start of this week, we ended up with Health Care at the number one position, followed by Technology. Consumer Discretionary and Communication Services remain at number three and four. And as I said, Financials moved up to the top five from six last week.
Industrials is now at position six, up from five last week, and we see a jump in the materials sector, going from nine to seven. Utilities remained at the number eight spot. Energy dropped from seven to nine, and consumer staples and real estate remained at 10 and 11, respectively.
- (2) Health Care - (XLV)*
- (1) Technology - (XLK)*
- (3) Consumer Discretionary - (XLY)
- (4) Communication Services - (XLC)
- (6) Financials - (XLF)*
- (5) Industrials - (XLI)*
- (9) Materials - (XLB)*
- (8) Utilities - (XLU)
- (7) Energy - (XLE)*
- (10) Consumer Staples - (XLP)
- (11) Real Estate - (XLRE)
The Weekly RRG
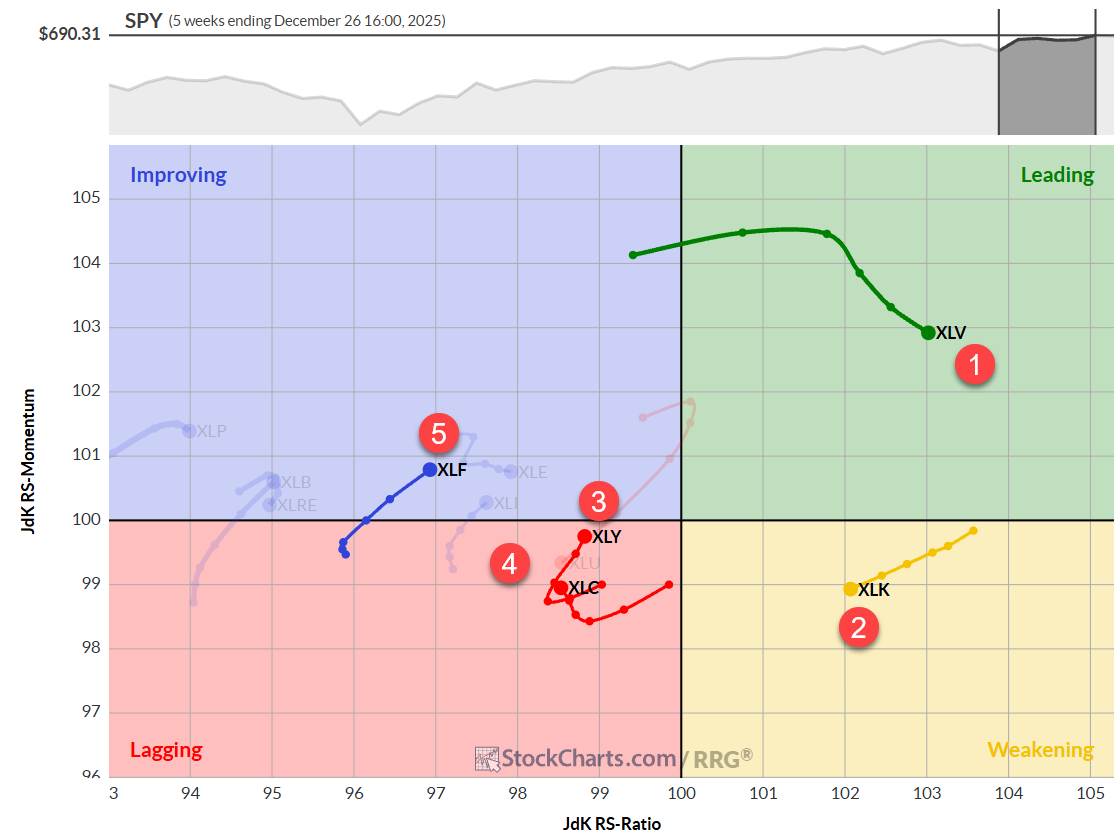
On the weekly RRG, we see Health Care still comfortably inside the leading quadrant, losing some relative momentum but still moving higher on the RS ratio scale. Technology remains inside the weakening quadrant, but it also continues traveling left, meaning lower on the RS ratio scale, at a negative heading.
The number three sector, Consumer Discretionary, is still inside the lagging quadrant but approaching the improving quadrant and traveling at a positive heading. Communication Services is also still inside the lagging quadrant, not at the positive heading yet, but it's started to pick up positive momentum.
And Financials are entering the top five while showing increased RRG velocity, meaning the distance between the nodes is increasing, traveling at a positive heading into the improving quadrant.
The Daily RRG
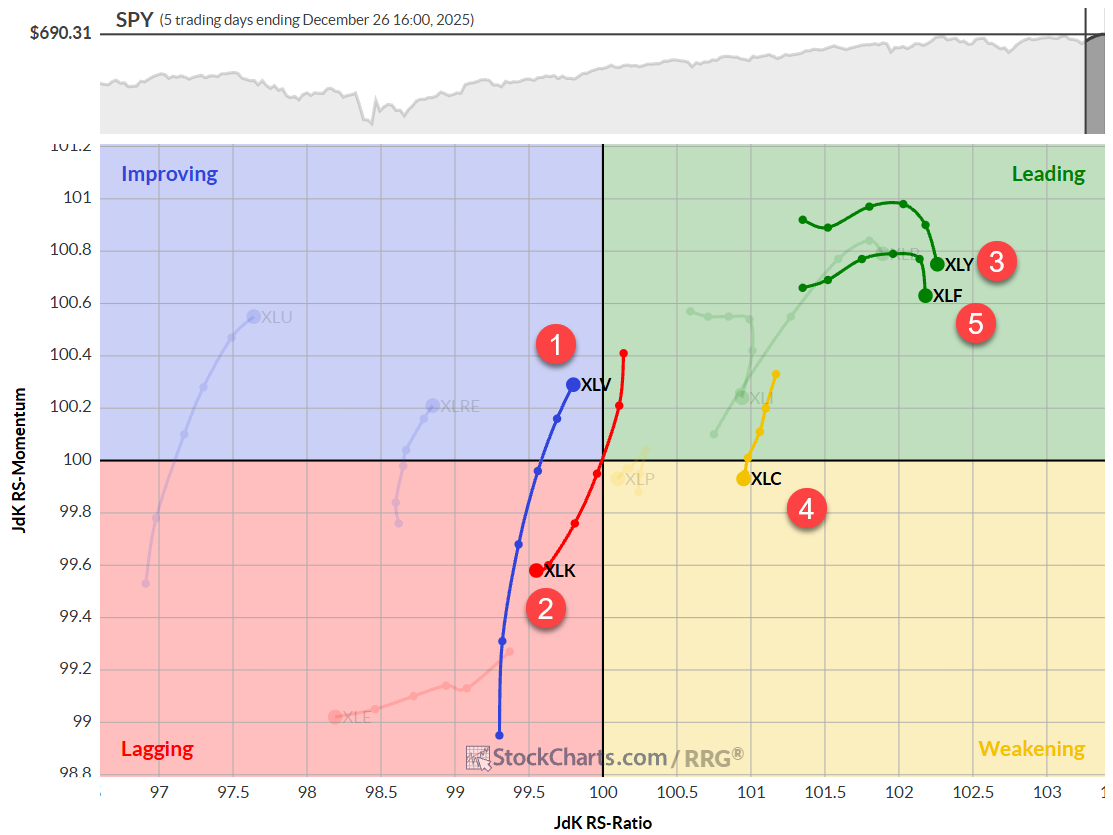
When we zoom in on the daily rotations, we see health care with a long tail pushing into the improving quadrant and almost back inside the leading quadrant. That will definitely help the positive view on the weekly RRG.
Technology, on the other hand, is rotating into the lagging quadrant with a long tail, which means that both the daily and weekly tails of the technology sector are now traveling at a negative heading. And that means this sector is still in the top five only because of its long stint on the right-hand side and its high RS-ratio reading on the weekly chart. If this continues, Technology will continue to drop in the ranking. The only thing that can prevent technology from dropping out of the top five in the next couple of weeks is a rotation on the daily RRG back up into the improving quadrant and, from there, leading.
Consumer Discretionary is inside leading and is at a strong RS-ratio reading. Actually, it's at the highest RS ratio reading at the moment, with it now starting to roll over and lose some momentum. The same holds for the Financials sector, which ranks fifth on our list. Both sectors sit comfortably inside the leading quadrant on this daily RRG.
Communication Services is moving from leading down into the weakening quadrant, which is slightly concerning because the weekly tail is still inside lagging. When the daily tail starts to lose relative momentum, that is not gonna be helpful for further improvement on the weekly RRG.
Health Care Sector
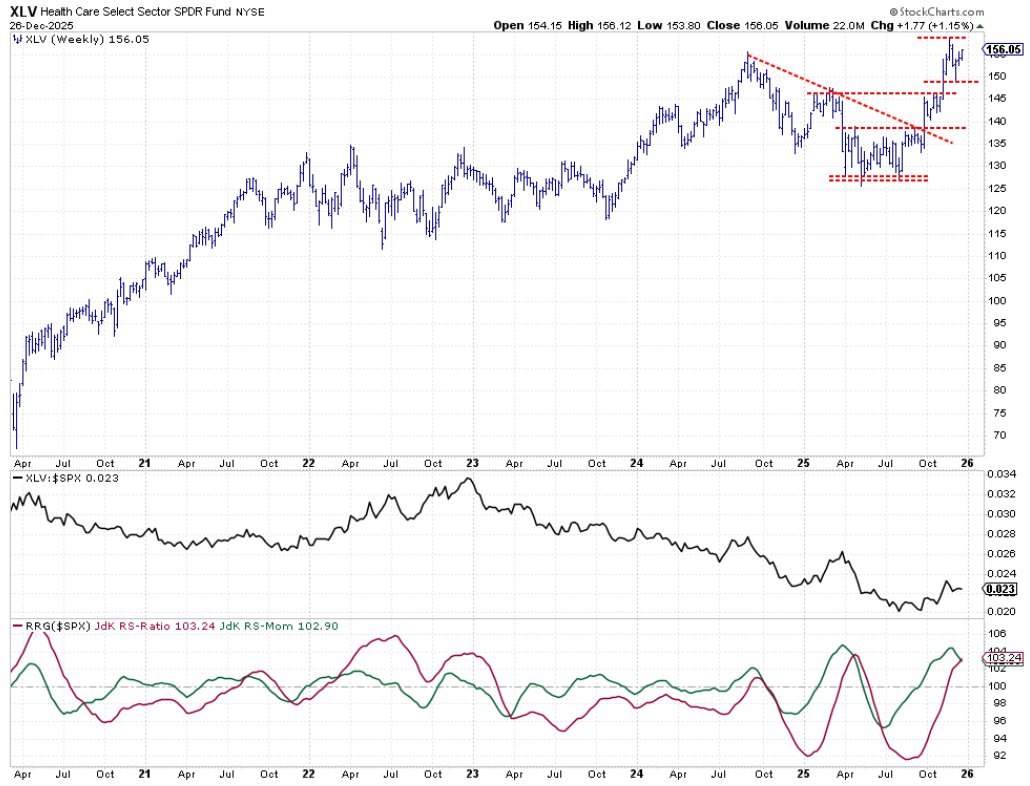
The Health Care sector is still bound in the middle between the previous high and previous low, but moving higher. Last week, it closed at the high end of the bar on its way to a test of its all-time high.
The raw relative strength line can still be seen in a falling trend channel. To get a more long-lasting turnaround, we would need to see a change in that trend. The RRG lines have picked up the beginning of a new uptrend, albeit with a little less momentum very recently, but the RS ratio level is still very promising for this sector.
Technology Sector
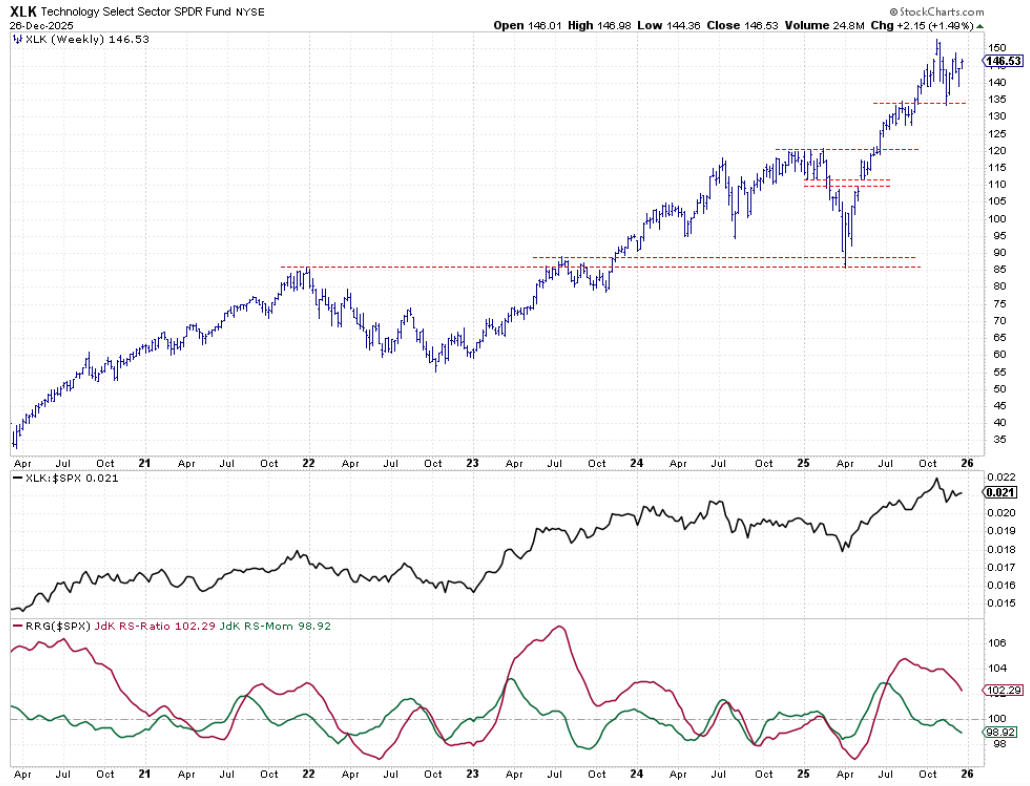
Technology continues to be kinda range-bound. We now see the last high is lower than the previous high, and the last low is higher than the previous low, which suggests it's entering a consolidation pattern.
Raw relative strength is still holding up well, but the lack of upward trendiness is causing both RRG lines to drop, which is pushing the technology sector deeper into the weakening quadrant with a negative heading.
Consumer Discretionary
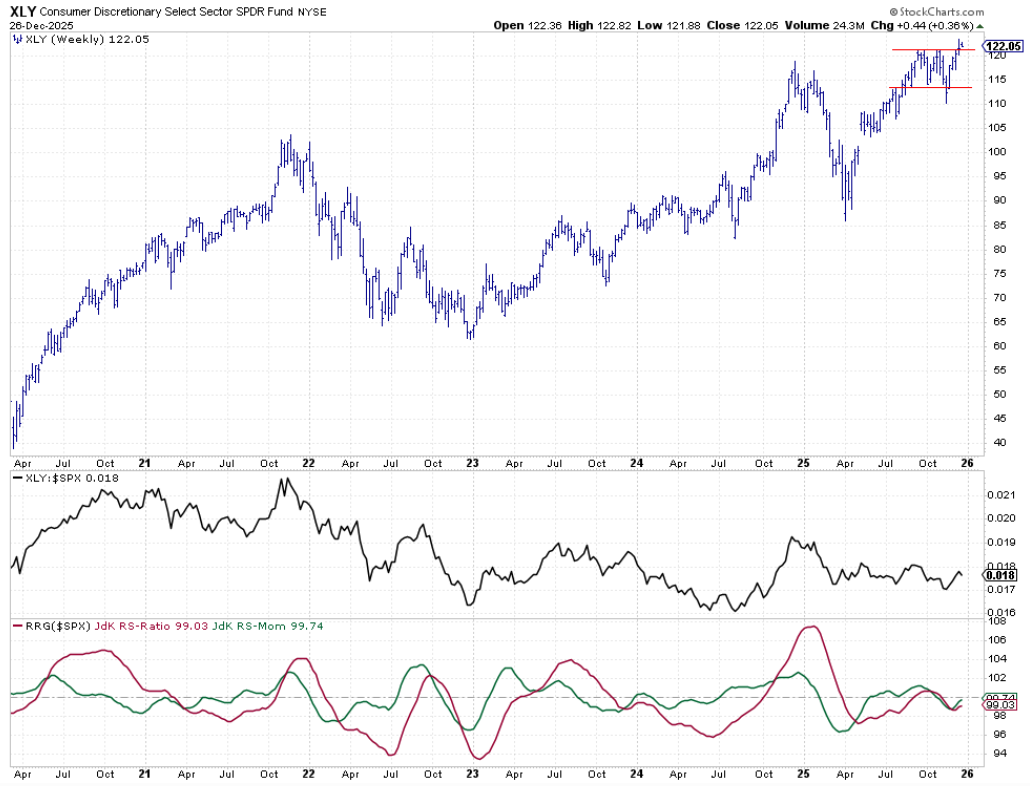
Consumer Discretionary has broken above its resistance, which was just above 120. And if that holds up, then there is very likely more upside potential ahead for the Consumer Discretionary sector.
From a relative perspective, we still need to see a break above its previous highs to get out of that range, which has dominated the better part of 2025. It is bringing the RRG lines back up close to the 100 level.
Communication Services
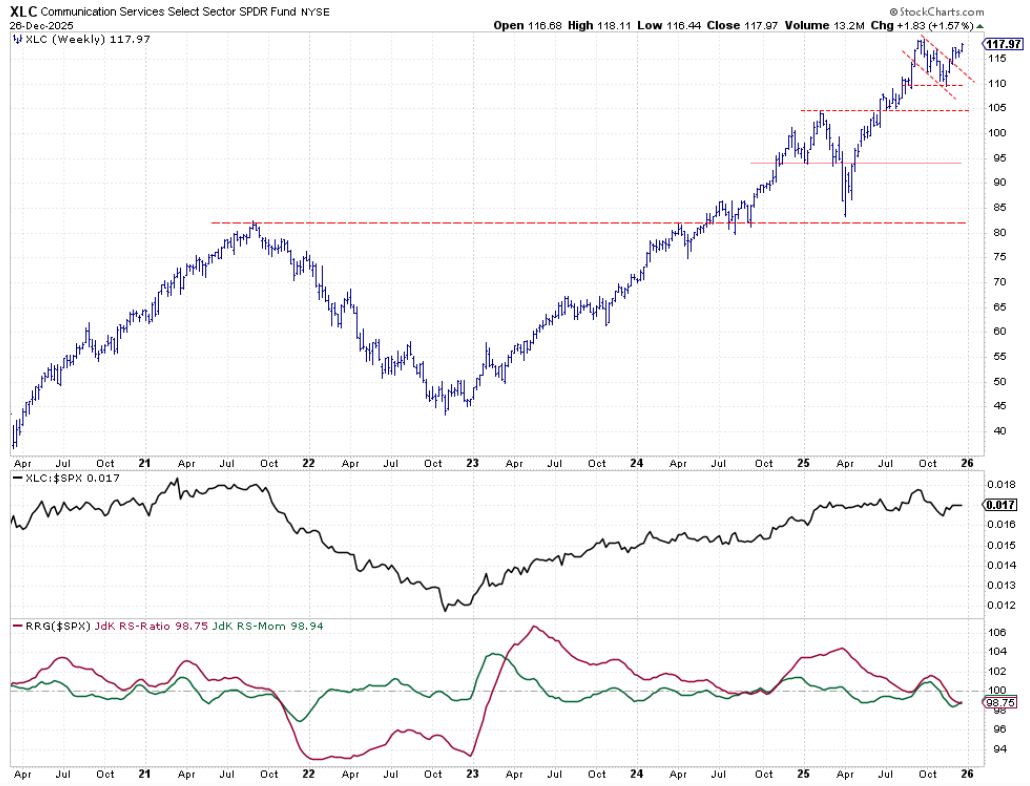
Communication Services, after a few weeks of consolidation, managed to break above its previous high and is now challenging its all-time high, just shy of 119.
The raw relative strength is moving sideways, which has caused both RRG lines to fall below 100. We see a little improvement there in the near term, but we need more improvement both on price and relative to continue this outperformance and keep communication services inside the top five of our ranking.
Financials Sector
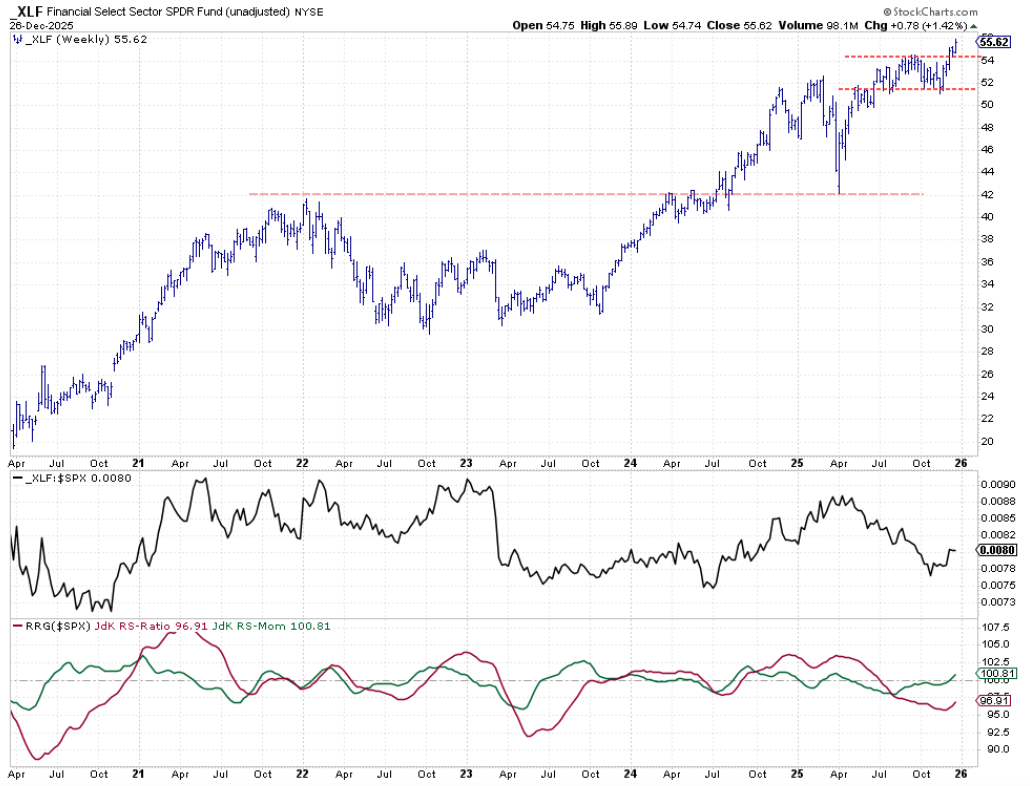
The new entrant in our top five is the Financials sector. This sector broke above its high around 54 two weeks ago and has been holding up very well, really confirming the rise last week, ending at 55.62.
The raw RS line is in the early stages of turning around, and the RRG lines have picked up this turnaround. The green RS momentum line is just moving above 100 and starting to pull the RS ratio line back up to the 100 level. This constellation positions the Financials sector within the improving quadrant, with a positive heading.
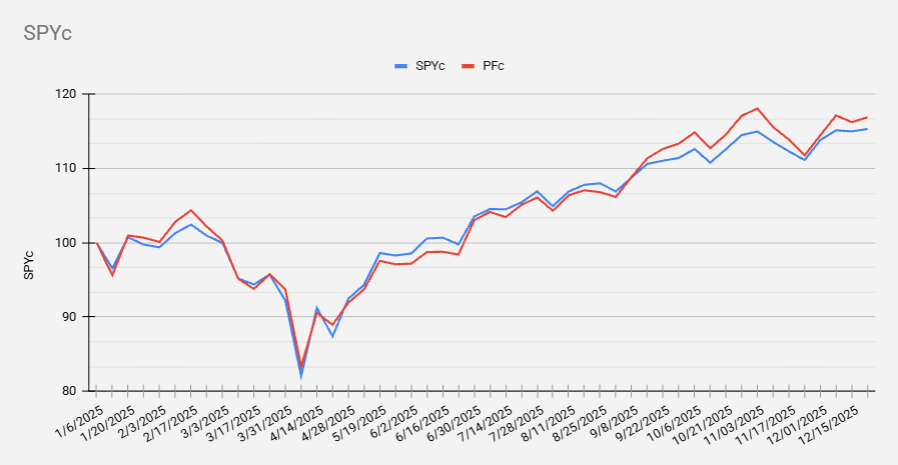
Portfolio Performance
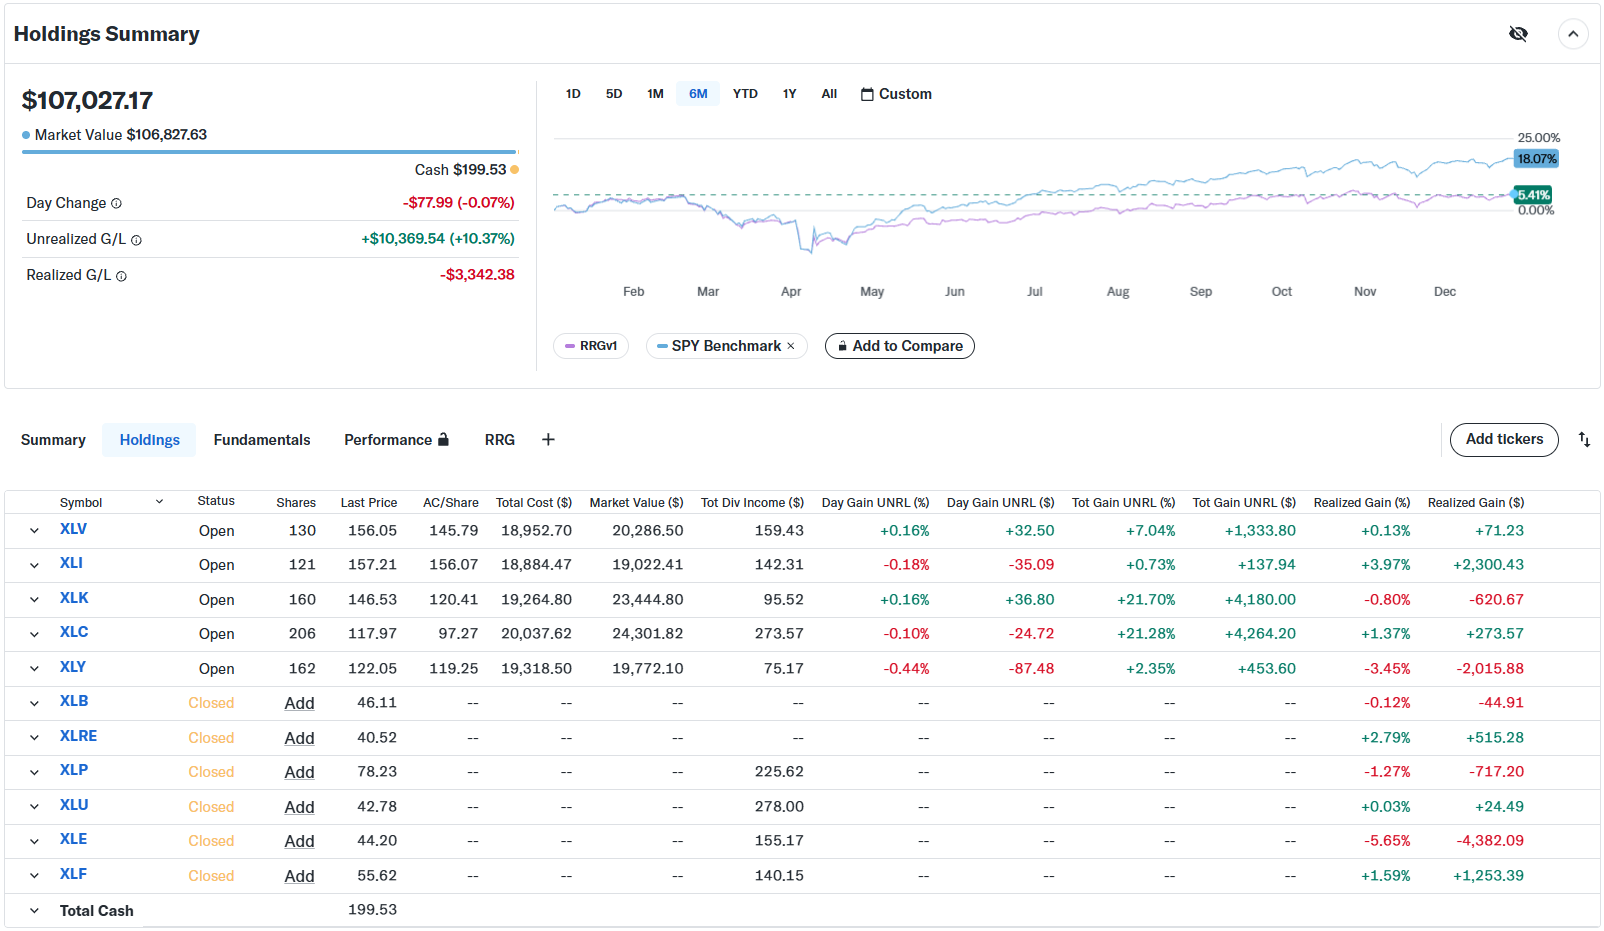
From a portfolio perspective, the gap widened again. It's around 12-12.5 percent right now. That is the equal-weight portfolio, which, as we know, is being hurt by the performance in the Technology sector.
The cap-weighted version of the portfolio remains slightly ahead of the S&P 500 for the year.
This is the last "Best Five" blog for 2025. I will continue this tracking exercise in 2026 and share my experiences and lessons learned based on this mock portfolio based on RRG metrics.
Feel free to share your comments via X (@RRGresearch), Facebook (@RRGresearch), or juliusdk@stockcharts.com.
Wishing you a very happy, healthy, and profitable New Year!
#StayAlert and have a great start of 2026 --Julius


