The CPI is Coming Out Wednesday: Here is Something to Be Aware of
CPI data for August will be published on Wednesday morning. Barring any unpleasant surprises, it should clear the decks for the FOMC to lower the Fed Funds rate. That may or may not turn out to be the right move. However, with the current rate of consumer price inflation at 2.7% compared to the Fed target of 2%, it is certainly a questionable one, hinting that the central bank does not have the fortitude to stay the course.
Chart 1 features the 12-month ROC of the CPI, which fluctuates in a very cyclical manner. Monetary policy aside, I look at inflation as a chronological process, starting in the commodity pits, gradually filtering through to the price of finished goods and other components of the Producer Price Index (PPI), and eventually reaching the consumer. In other words, there is a slight, but variable, lead between the PPI and CPI. It doesn’t happen in every cycle because the CPI is calculated from a much broader basket of items. Nevertheless, when the PPI picks up, it’s always a good idea to monitor the CPI more losely than normal.
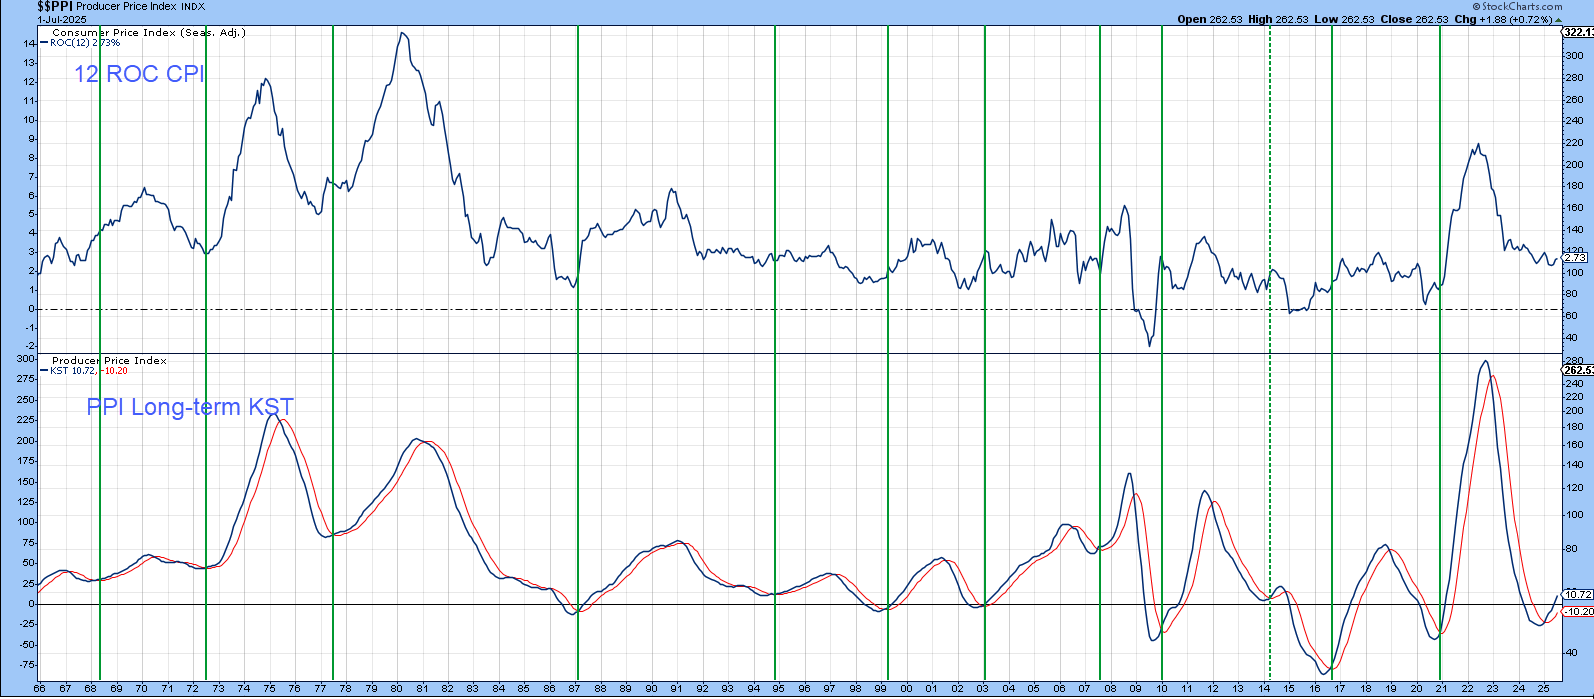
In that respect, the lower window in Chart 1 features the long-term KST for the PPI. The vertical lines approximate periods when the KST crosses above its 9-month MA. If you look to their right, you can see that the the ROC for the CPI has a strong tendency to rally. The magnitude of each swing varies from cycle to cycle. Aside from the 2014 signal, though, all the others since 1966 were followed by higher yearly rates of consumer price inflation. The KST bottomed around the turn of the year, signaling a higher rate of consumer price inflation. Given the previous short or non-existent leads, the CPI is overdue in responding to these PPI pressures and could be ready for an upside reversal.
Chart 2, below, also features a 12-month ROC of the CPI but, this time, it's accompanied with an 18-month MA. Moving average crossovers often warn of an impending up wave in CPI momentum. Right now, the trend is down, as the ROC is below its average. However, the margin between them is quite narrow, at 2.73% for the ROC and 2.81% for its MA, which renders an upside crossover as perfectly feasible.
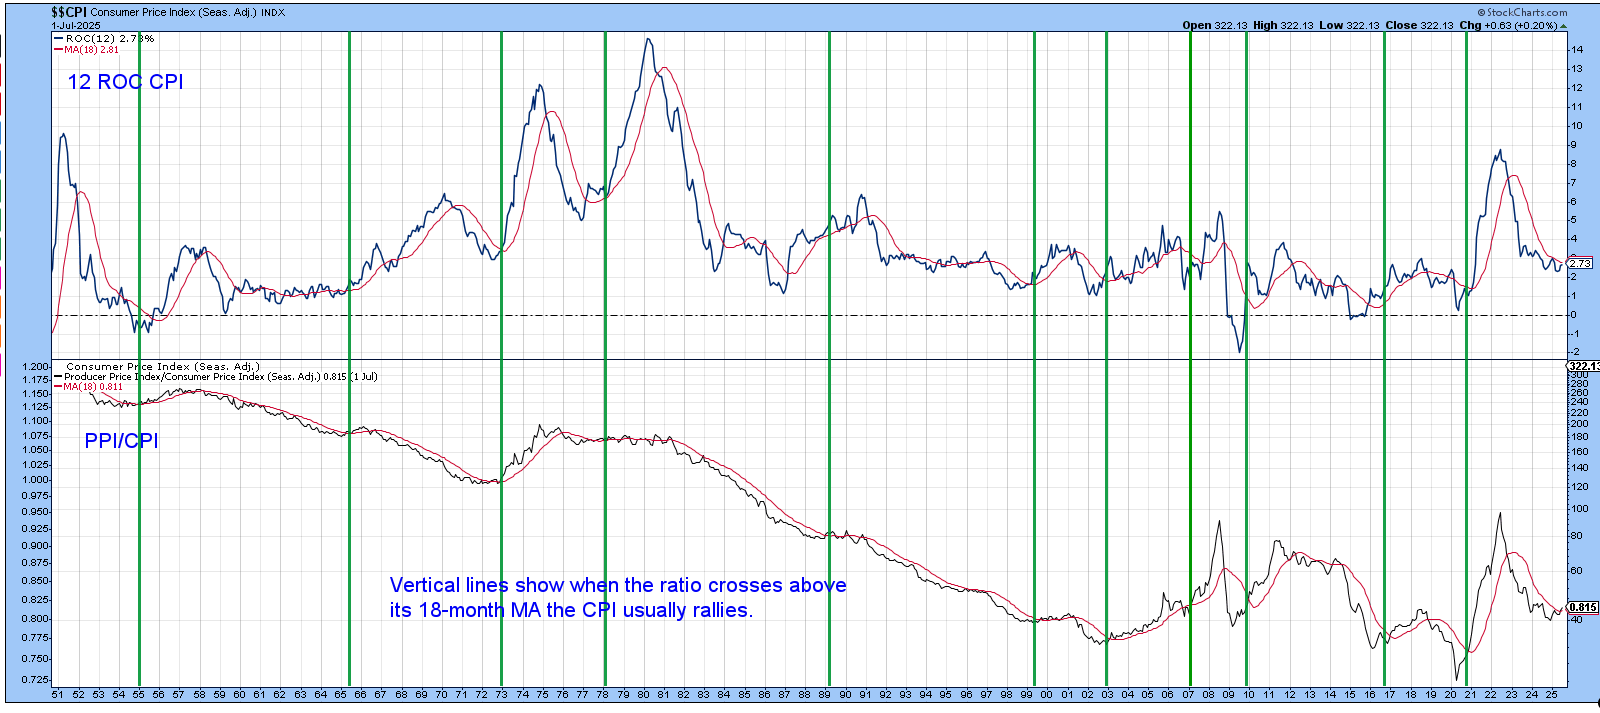
The lower window compares the CPI to the ratio of the PPI to the CPI. A rising relationship means the PPI is outperforming the CPI and is usually associated with a rising CPI ROC. That’s perfectly logical, since one would normally expect pricing pressures at the wholesale level to translate, in one way or another, to higher consumer prices. That said, it's not a perfect relationship, as the CPI was strong in the late 1960s, but the ratio drifted lower.
I use the ratio as an indication of when a CPI acceleration is likely. The first step is to observe when it crosses above its 18-month MA, as flagged by the green vertical lines. Such setups do not forecast the magnitude and duration of the forthcoming CPI up wave. Nonetheless, it's still helpful to know that the trend is likely to be an upward one. In July, the ratio crossed its MA, thereby triggering a CPI “buy “ signal. However, it’s not yet decisive, so it will be interesting to see whether it is able to build on that strength or not.
The CPI and the Stock Market
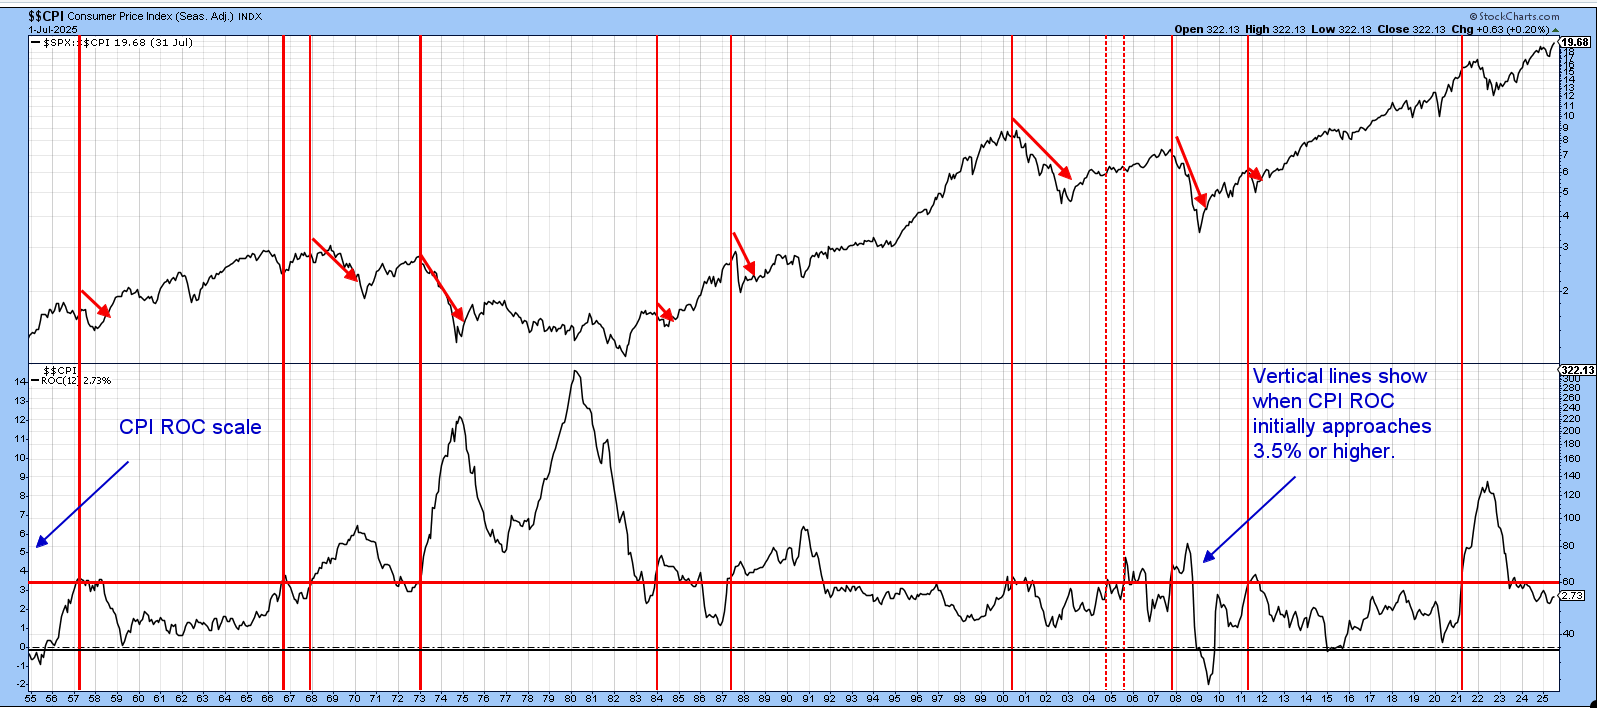
Chart 3 compares the inflation adjusted S&P Composite to the 12-month ROC of the CPI. The chart shows that, at 2.7%, it’s not that far from 3.5%, which is a benchmark that has historically represented a warning for equities.The vertical lines indicate when CPI momentum has previously crossed 3.5%. Apart from a couple of examples in 2004 and 2006, when the market shrugged its nose at rising inflation, the red arrows indicate that each of the others was followed by, or associated with, an important decline or bear market.
Conclusion
The trend of year over year consumer price inflation is down. However, the 12-month ROC of the CPI is close to its 18-month MA and the PPI/CPI ratio has already triggered a tentative CPI “buy” signal. Wednesday’s report may well be benign, but the indicators are nonetheless poised for an upside reversal in the event of an unexpectedly robust CPI number.
Good luck and good charting,
Martin J. Pring
The views expressed in this article are those of the author and do not necessarily reflect the position or opinion of Pring Turner Capital Group of Walnut Creek or its affiliates.


