The Squeeze Is On: Using the TTM to Catch Big Moves

Key Takeaways
- The TTM Squeeze helps find stocks that are ready to break out of a consolidation.
- Red and green dots indicate consolidation or breakouts, and the histogram indicates the direction of the breakout.
- Apply the TTM to your charts and spot those early breakout opportunities.
You’re probably heard the term short squeeze before. But if you need a quick refresher, let’s rewind for a moment. Remember back during COVID-19 when stocks like GameStop Corp. (GME), AMC Entertainment (AMC), and BlackBerry (BB) suddenly went through the roof? That’s when the term “meme stocks” took off.
Here’s what was happening: Retail traders identified stocks with a lot of short interest and started buying them like crazy. As the prices climbed, short sellers were forced to buy even more shares to cover their short position. This pushed prices even higher.
Meme stocks are like fashion fads. One minute they’re hot, the next they’re yesterday’s news. More recently, stocks like American Eagle Outfitters, Inc. (AEO), GoPro, Inc. (GPRO), Krispy Kreme, Inc. (DNUT), Opendoor Technologies, Inc. (OPEN), and Kohl’s Corp. (KSS) have taken their turn in the spotlight.
You’re probably thinking, “What does this mean for long-term investing?” Great question. This is where the TTM Squeeze indicator comes in.
Why the TTM Squeeze Matters
The TTM Squeeze isn’t just for chasing meme stocks. It’s designed to help you identify when any stock is building up energy for its next big move and when that move is coming to an end.
The indicator is displayed as dots and histogram bars. When you see a string of red dots, it means the stock’s volatility is low. In other words, it’s taking a rest. But it can’t rest forever; after a while, the rest period leads to an explosive move. When the dots turn green, that’s your heads-up that a breakout could be coming.
The dots don’t tell you which way the stock will move, but the histogram bars do. Bars above the zero line suggest upward movement, while bars below hint at a possible downside move.
How to Use TTM Squeeze in Practice
Look through stocks in the Market Movers, SCTR Reports, or New Highs panels, check your ChartLists, run some scans, and see if any stocks or ETFs display a series of red dots. When you find one, save it to a new ChartList. That way, you have a list of potential candidates that are consolidating and getting ready to move.
For example, when I looked recently, I spotted Ford Motor Co. (F). It had been consolidating for a while, but the last two histogram bars popped above zero, hinting that an upside move might be brewing. Although it’s not confirmed yet, it’s definitely worth keeping on the radar.
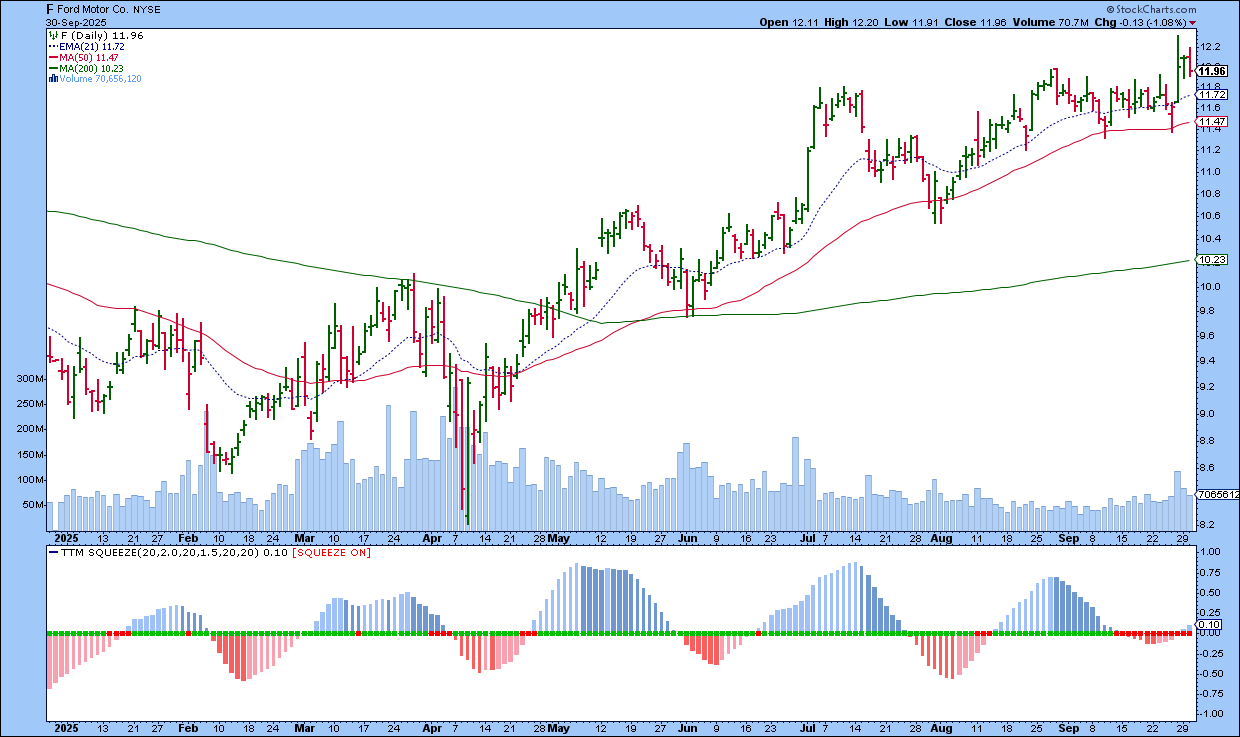
If Ford breaks higher, the next level of resistance is at around the $13.20 to $13.50 range. How far it can go will depend on the broader economy and the auto industry. And if things don’t look promising, your smart money management will kick in and you’ll exit the trade.
Meme Stocks vs. Non-Meme Stocks
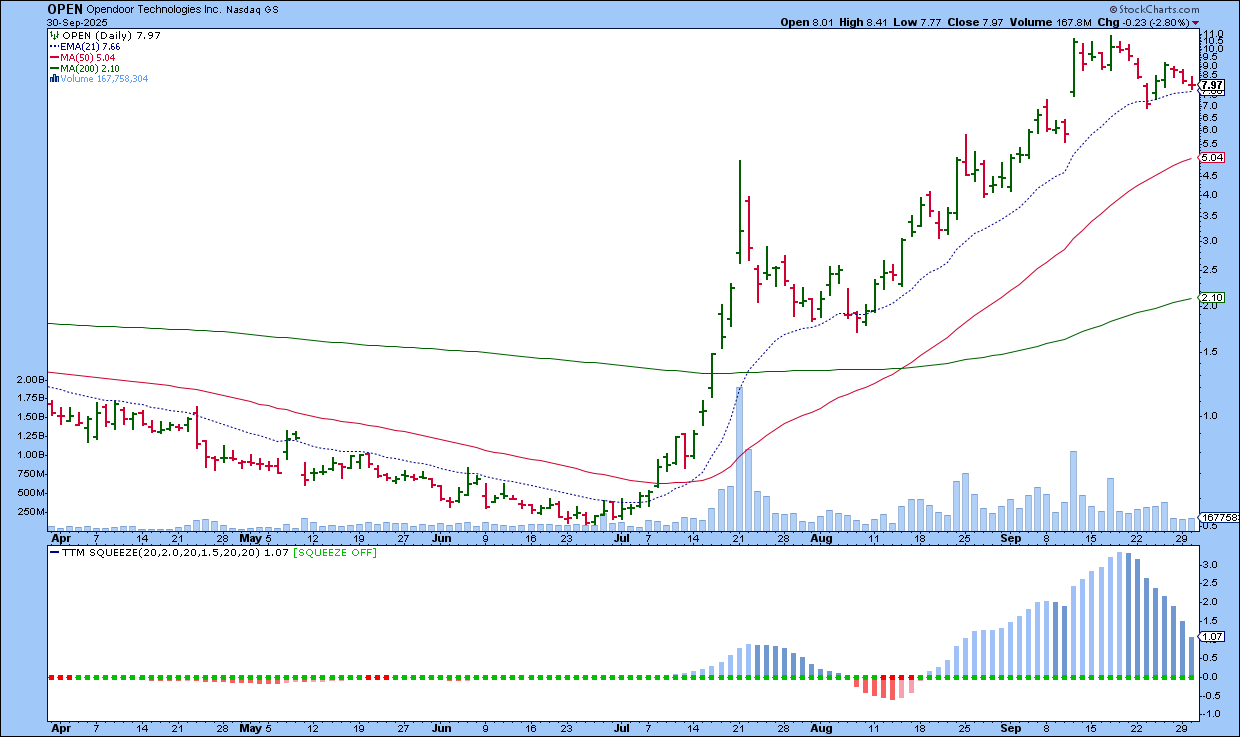
Now, meme stocks can also show TTM Squeeze setups, but those moves are often wild and unpredictable. Take OPEN, for example. Its chart shows how erratic things can get before that sudden pop in price. It may be exciting, but the price action won’t be the steady trend long-term investors prefer.
The Bottom Line
The TTM Squeeze is a powerful way to spot stocks that are consolidating and could be ready for some action. So give it a try. The more you observe this indicator, the better you’ll understand it.
Disclaimer: This blog is for educational purposes only and should not be construed as financial advice. The ideas and strategies should never be used without first assessing your own personal and financial situation, or without consulting a financial professional.


