The Week Ahead: Will Nifty Confirm a Trend Shift?
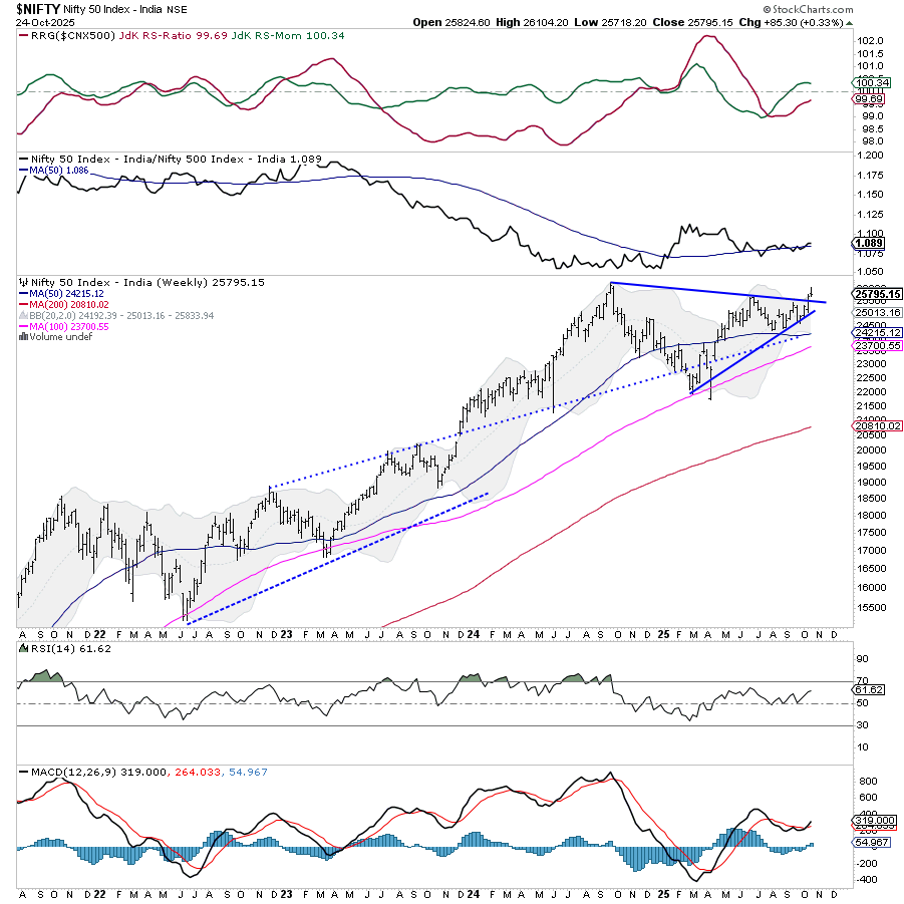
In the truncated three-day trading week, the markets showed a mild upward bias and managed to end with marginal gains. The Nifty remained within a narrow range, oscillating between 26,104.20 on the higher side and 25,718.20 on the lower, marking a tight 386-point intra-week range. Despite the limited activity, the India VIX dropped slightly by 0.30% to close at 11.59, continuing to reflect complacency and low volatility expectations. The Nifty ended the week with a modest gain of 85.30 points or 0.33%.
The most significant development during the week was an attempt to extend breakout attempt by Nifty above a multi-month consolidation zone. The Index pushed above the falling trendline resistance that originated from the 2024 high, and this move is technically important. While the close came just below the upper Bollinger Band (25,855), the structure shows improving momentum. Nifty is now challenging the upper end of a broad symmetrical triangle, and a confirmed close above this zone has opened up room for a sustained directional move. The market is attempting to transition from a consolidation to a trending phase, and confirmation of this breakout next week will be crucial for follow-through.
Given the breakout attempt, the coming week may start on a cautiously optimistic note. If the Index sustains above the 25,850–25,900 zone, the breakout can attract further momentum-driven buying. In such a case, immediate resistance lies at 26,100 and further at 26,220. On the downside, support comes in at 25,600, followed by 25,470.
The weekly RSI stands at 61.60 and is neutral; it does not show any bearish or bullish divergence against the price, maintaining its bullish range. The weekly MACD remains in a buy mode as it stays above the signal line, and the histogram continues to rise, supporting the bullish momentum. The weekly candle is a small bullish body placed at the edge of a breakout towards the lower end of the range; while not a classic Shooting Star candle, its position is strategically important given its proximity to resistance.
From a pattern perspective, Nifty has been moving within a broad symmetrical triangle formation for several months. The Index has now attempted a breakout from this consolidation, with the current candle showing an early sign of this breakout. The Index is trading comfortably above all key moving averages, including the 20-, 50-, and 100-week MAs, all of which are rising—an indication of a structurally strong setup. If the breakout sustains, the pattern implications suggest a potentially trending move on the upside.
In the coming week, participants would do well to remain tactically optimistic but cautious. While the technical structure is improving, the breakout is not fully confirmed until there is a strong follow-up week above 25,900. Traders should avoid overly aggressive positions until a clear confirmation emerges. A prudent approach would be to trail existing positions, protect gains, and adopt a selective, stock-specific strategy while closely monitoring broader index behaviour around breakout levels.
Sector Analysis for the Coming Week
In our look at Relative Rotation Graphs®, we compared various sectors against the CNX500 (NIFTY 500 Index), representing over 95% of the free-float market cap of all the listed stocks.
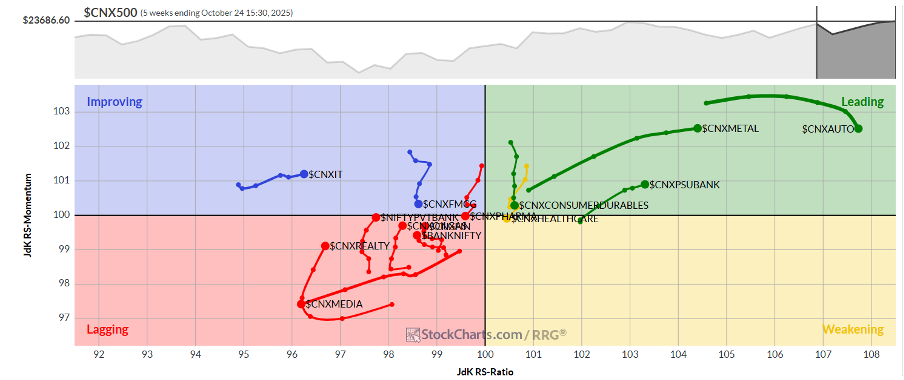
Relative Rotation Graphs (RRG) show that the Nifty Metal, PSU Banks, and the Auto Index are inside the leading quadrant. While maintaining leadership, these pockets are likely to relatively outperform the broader Nifty 500 Index.
The Nifty Midcap 100 Index is the only group that is inside the weakening quadrant. This means that while individual stock-specific performance may be seen, overall relative performance may still remain subdued.
The Nifty Pharma has rolled inside the lagging quadrant. The Media, Commodities, and the Consumption Index are also seen languishing inside this quadrant. The Financial Services, Energy, Realty, Banknifty, Services Sector, PSE, and Infrastructure Indices are also inside the lagging quadrant; however, they are meaningfully improving on their relative momentum.
The IT Index remains well-positioned inside the improving quadrant. It is expected to show improving relative performance against the broader markets. The FMCG Index is also in this quadrant, but it is seen giving up relative momentum against the broader markets.
Important Note: RRG™ charts show the relative strength and momentum of a group of stocks. In the above chart, they show relative performance against NIFTY500 Index (Broader Markets) and should not be used directly as buy or sell signals.
Milan Vaishnav, CMT, MSTA
Consulting Technical Analyst
www.EquityResearch.asia | www.ChartWizard.ae


