These Three Markets Could Get a Boost from Trade Talks
Later this week, Presidents Trump and Xi will sit down and finalize U.S.-China trade talks on some key items. In a lot of situations, we find good news has already been factored into the price which, by the time said news is announced, is very overextended and vulnerable to profit-taking. Consequently, it’s a case of buying the rumor and selling the news.
In the case of the grains, which, my Perplexity Assistant tells me, are all up for discussion this week, prices have been in a downtrend for nearly 4 years. As a result, their technical position is a very finely balanced one, nicely positioned to take advantage of some good news. I’ll examine them later but, before that, here's a few words on the GSCI Agricultural Index ($GKX), which is heavily weighted in favor of grains.
GSCI Agricultural Index ($GKX)
Chart 1 shows that the $GKX has been in a downtrend since early 2022 and that the price is now very close to its bear market down trendline and 12-month MA. The KST has started to flatten but, nevertheless, is still above its MA. It’s also possible that the Index itself is in the process of forming the second bottom in a double bottom pattern, in a similar way to the price action that preceded a sharp run up in 2010. Confirmation of that scenario requires a break above the dashed green line at 400.
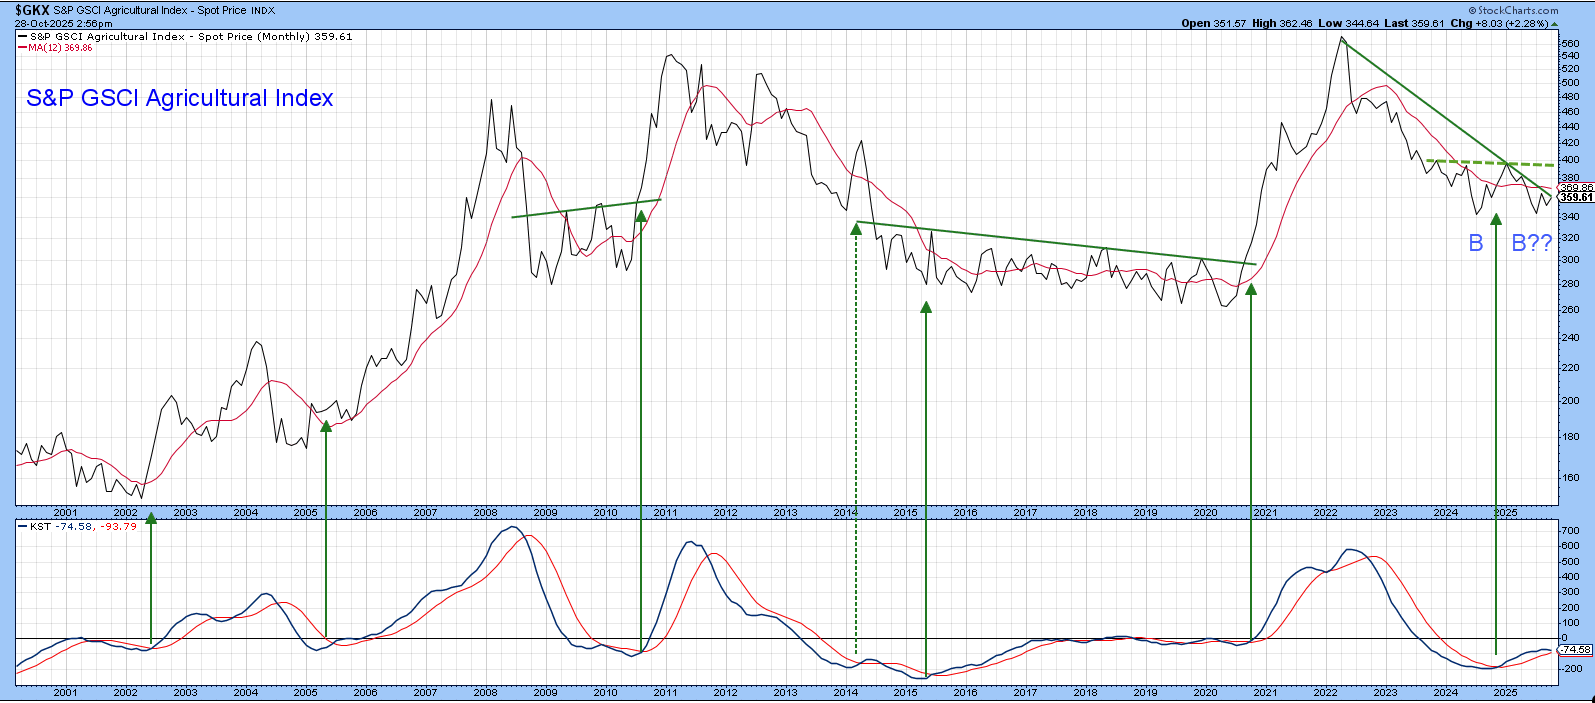
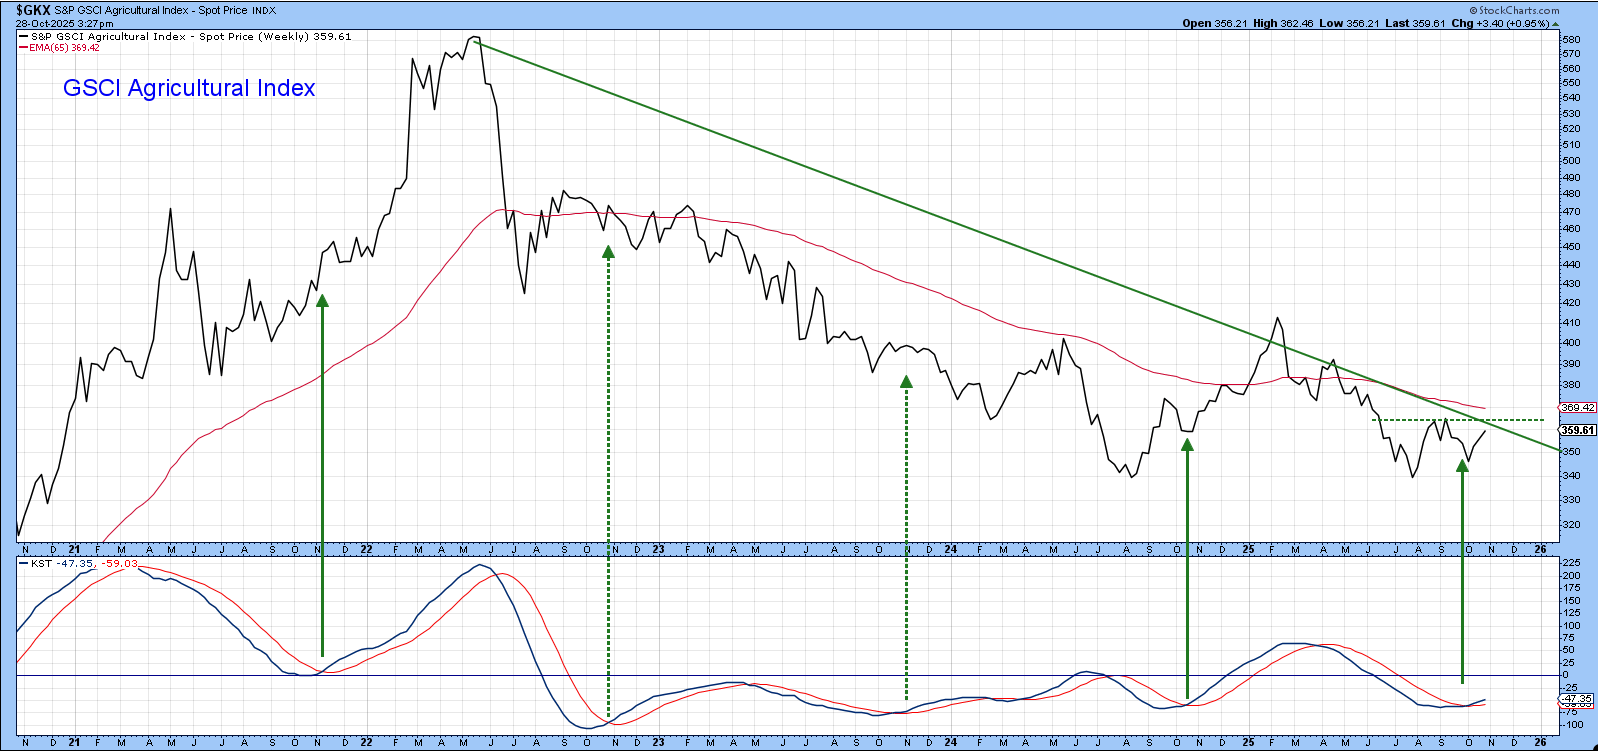
Chart 2, featuring weekly data, focuses on the recent down trend. In this case, a violation of the green bear market down trendline requires a Friday close in excess of 360. A higher probability of success requires a decisive close above 370, since that would take the price above its 65-week EMA and previous high at 365.
Soybeans, Wheat and Corn
Chart 3 features the long-term technical picture for soybeans. Not surprisingly, it is similar to the $GKX. In this instance, though, the long-term KST is in a firmly established uptrend. The price has also violated its down trendline and completed a 1-year bottom. However, a word of caution is required as this is a monthly chart, which only reflects the latest data and not Friday’s end-of-month close. It’s as well to bear in mind that things can change between now and then.
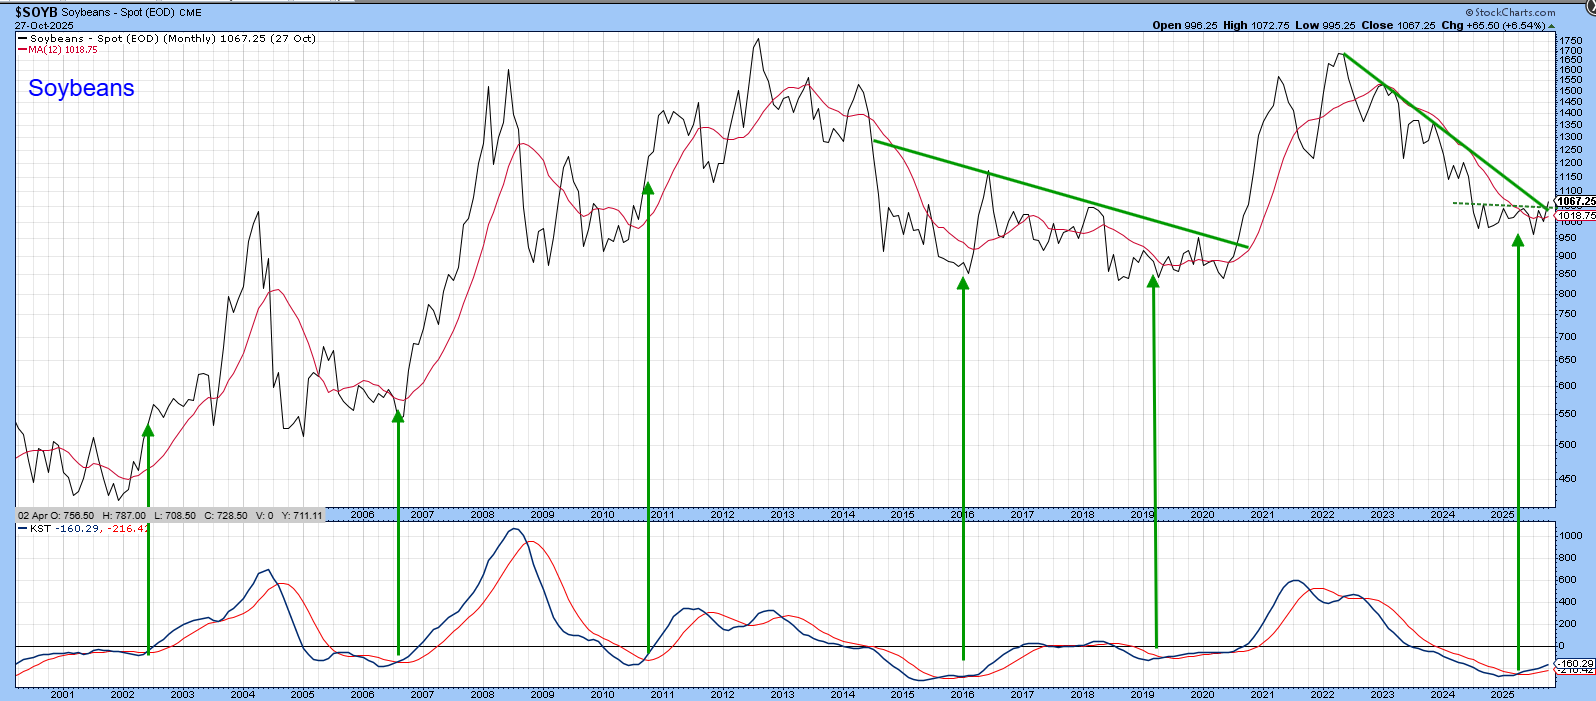
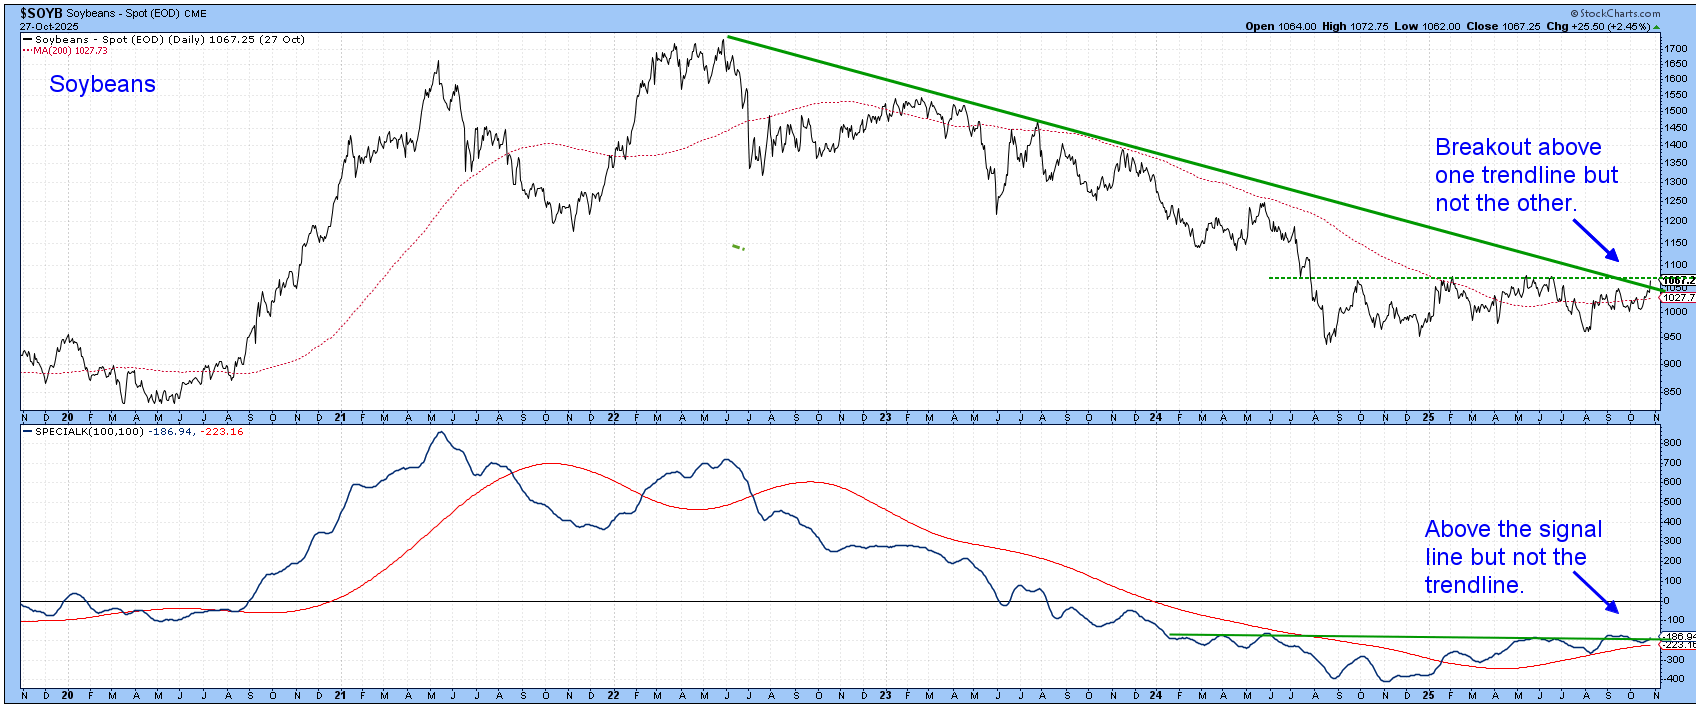
Chart 4, featuring daily data, also presents a picture of an emerging bullish situation, but one nevertheless requiring a bit more of a push to get it over the finish line. That’s because the price has violated its down trendline but has not yet broken out of that sideways trading range. For its part, the Special K (SPK) is above its signal line but has yet to clear the solid horizontal one.
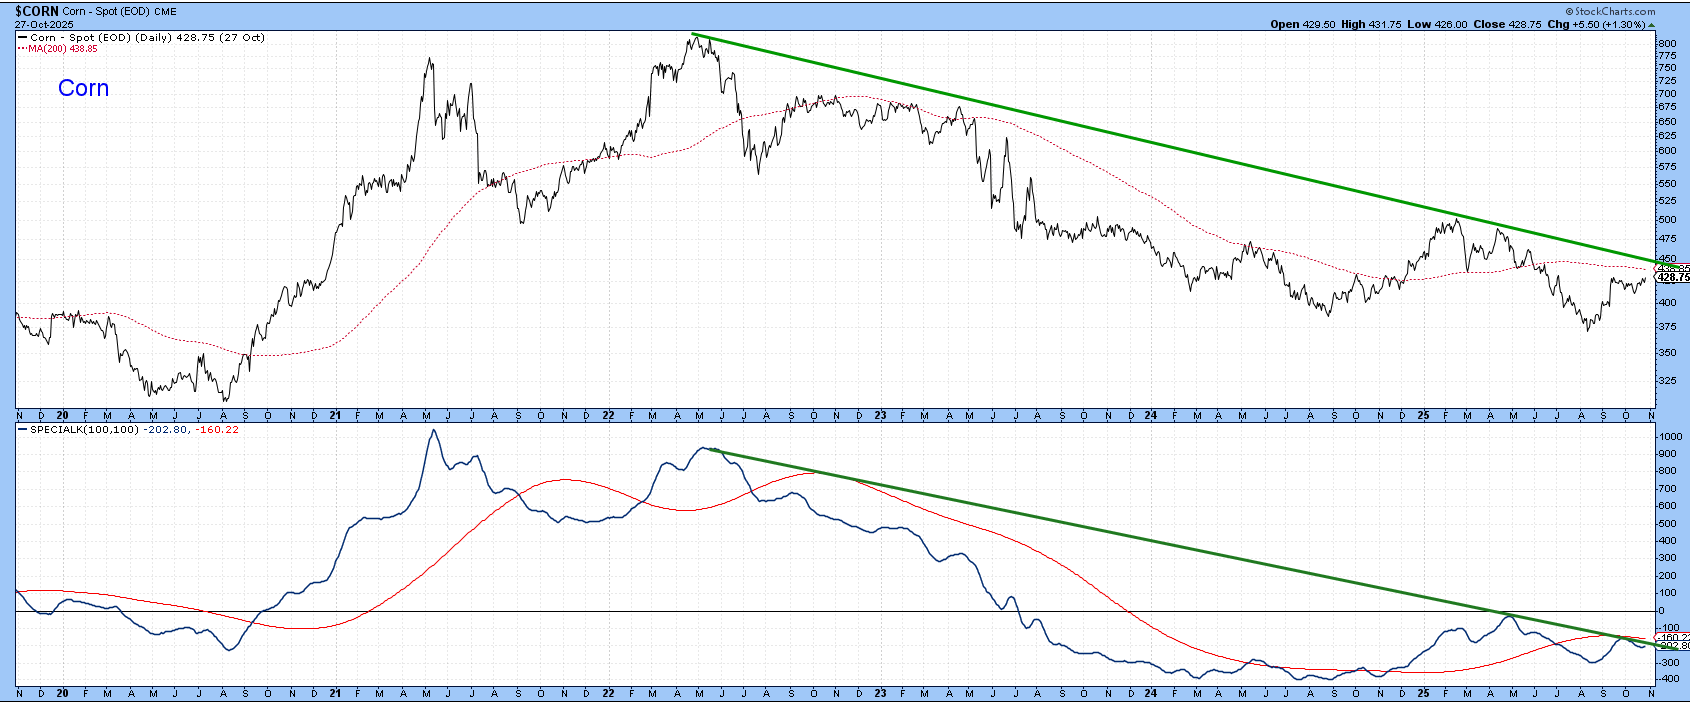
Corn is featured in Chart 5. The price is tracing out a now familiar pattern of a finely balanced technical picture following a long-term decline, though the balance could easily change in favor of the bulls. Nonetheless, corn is not positioned quite as positively as soybeans. That’s because its price is trading well below its 200-day MA and bear market down trendline. Furthermore, unlike beans, the SPK remains below its signal line and 2022-2025 down trendline.
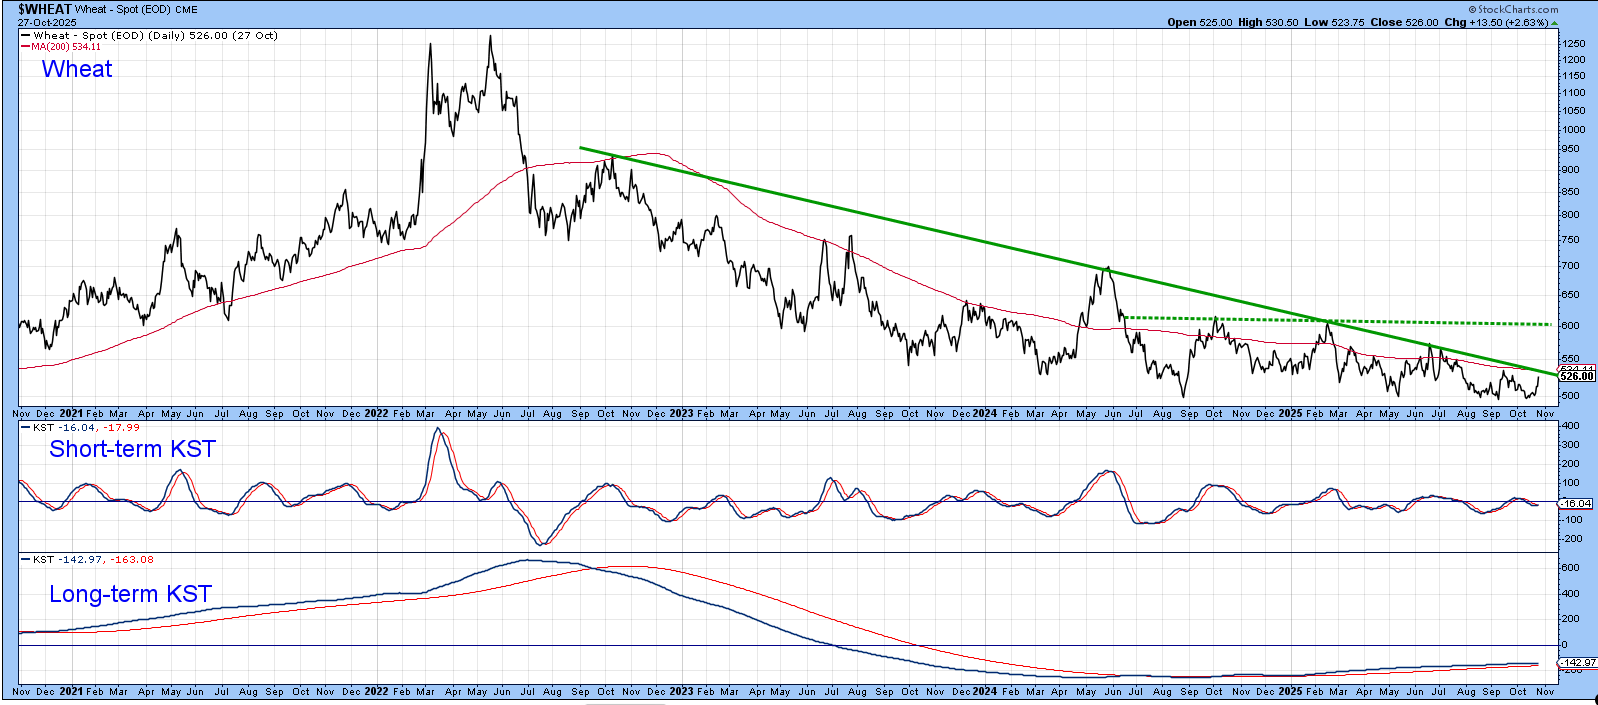
The same can be said for wheat, which has yet to clear its bear trendline and the dashed trendline at $6, marking the top of the recent trading range. Here again, the situation could change very quickly. As it stands right now, the 4-year downtrend is intact.
Gold Update
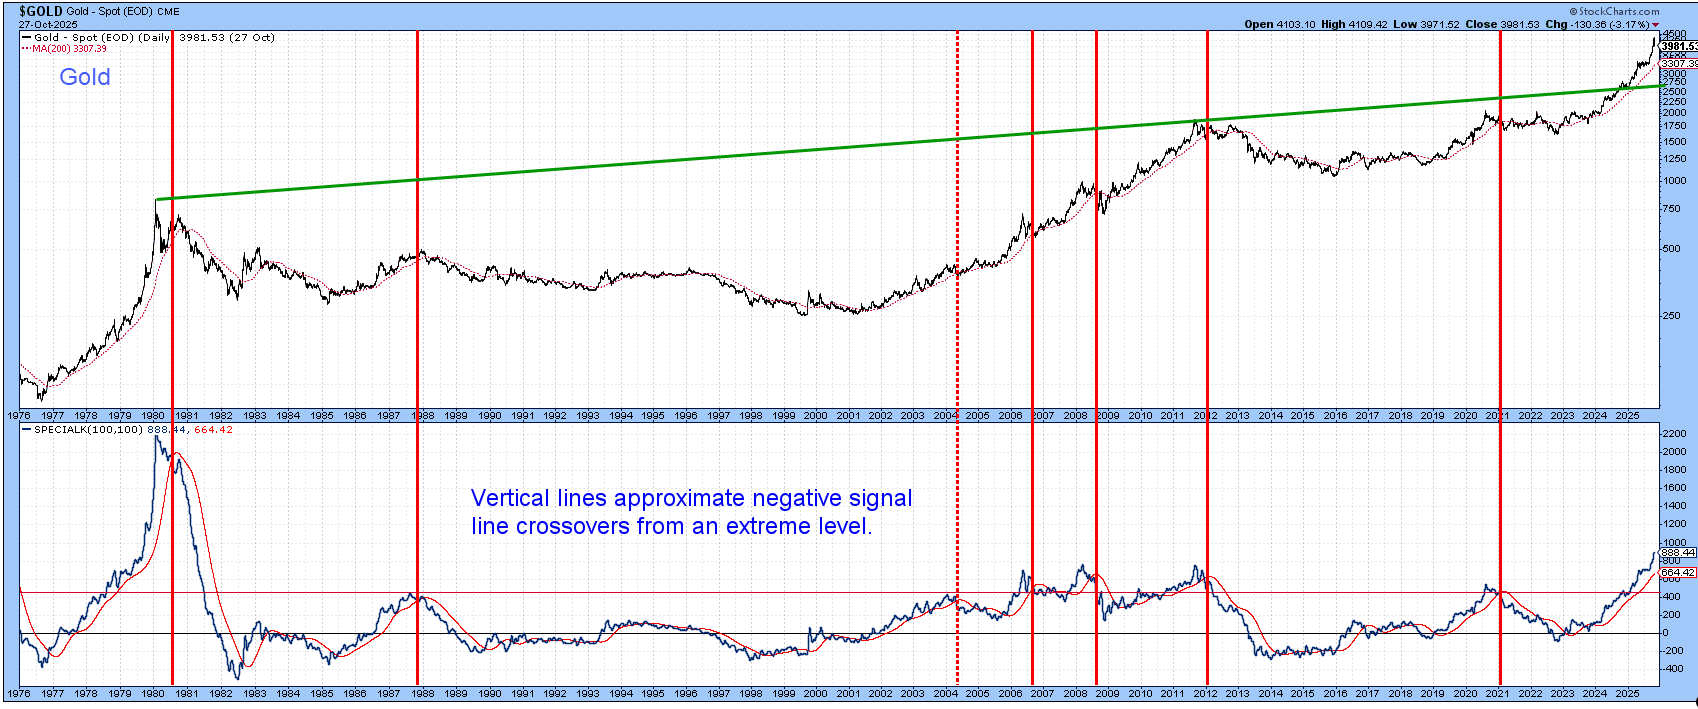
My previous two articles have focused on gold because it may well be close to a major peak, at least in terms of time. One of the indicators I suggested following was the Special K and its relationship with its signal line. The vertical lines in Chart 6 flag negative signal line crossovers that have taken place at or above the red-dashed overbought line. Chart 7 shows that, despite the sharp setback of the last couple of weeks, the SPK is moving higher regardless.
Good luck and good charting,
Martin J. Pring
The views expressed in this article are those of the author and do not necessarily reflect the position or opinion of Pring Turner Capital Group of Walnut Creek or its affiliates.


