Think Oil Is the Only Energy Play? Think Again

Key Takeaways
- Clean energy stocks are outperforming as oil strength lifts the broader resource complex.
- Technicals point to continued upside, with bullish patterns and strong relative momentum building across clean energy ETFs.
- Market history suggests oil rallies and even presidential cycles often coincide with powerful moves in clean energy.
In January, I argued that dusting off the mid-2000s playbook could be a decent strategy for 2026. Back then, ex-US stocks were ripping, gold was on a heater, and the U.S. dollar struggled at resistance. While price action has shifted versus early in the year, one niche is partying like it’s 2007.
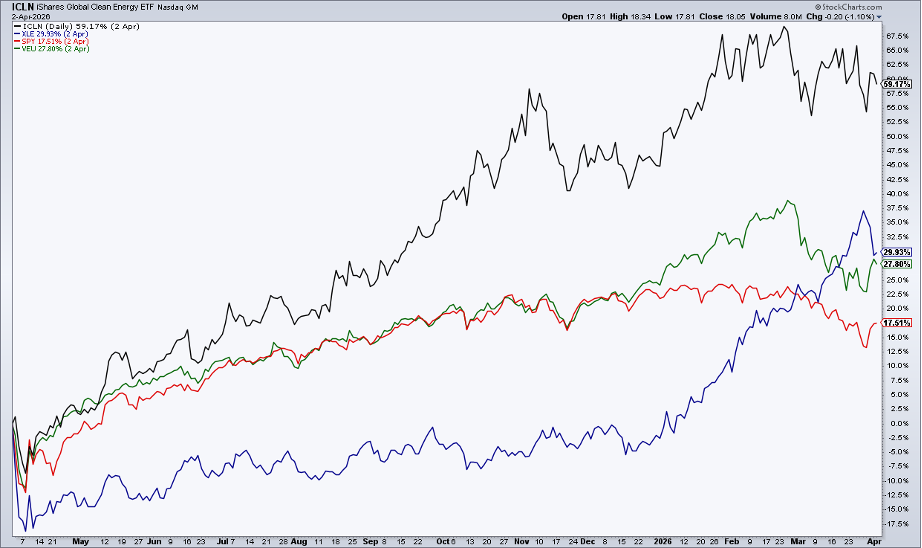
Clean energy stocks have posted tremendous alpha since the post-Liberation Day lows. Now a year removed from the worst of the tariff smackdown in stocks, the iShares Global Clean Energy ETF (ICLN) is up 59% YoY, outperforming the S&P 500 (SPY) and international equities (VEU). And while it lags the State Street Energy Select Sector SPDR ETF (XLE) thus far in 2026, clean energy names have topped SPY and VEU YTD.
This time is different, though, as there’s no catering-dollar-currency catalyst for ICLN as there was in 2007. What’s more, clean energy is no longer a new and nascent industry. In the mid-2000s, it was the shiny new toy for momentum traders to play with as the 2003–2007 cyclical bull market reached its zenith. These days, ICLN has its good days and bad, with long stretches of severe underperformance relative to global equities between growth spurts.
When Oil Rallies, Clean Energy Follows
So why should we look at clean energy today? Its chart is solid, for one thing. Both absolute and relative strength are impressive. Beyond that, I find it pays to dig an extra layer under the surface when a single market theme is so pervasive.
Right now, oil and energy are en vogue and always in the spotlight. (If you’re like me, you checked how WTI and Brent crude oil futures opened first thing at 6 p.m. ET Easter Sunday after the long holiday weekend.) The mid-2000s playbook reveals that when oil and gas are on a tear, clean energy is probably not far behind. To be clear, something like ICLN has similar risks to XLE — should oil plunge, both funds probably come back down to earth. At the same time, traders surely price in the current oil futures curve, which pins December 2026 prices in the low $70s.
That's the backdrop and some of the risks. Now let’s shine a light on ICLN’s technical situation.
A Bullish Setup Takes Shape In ICLN
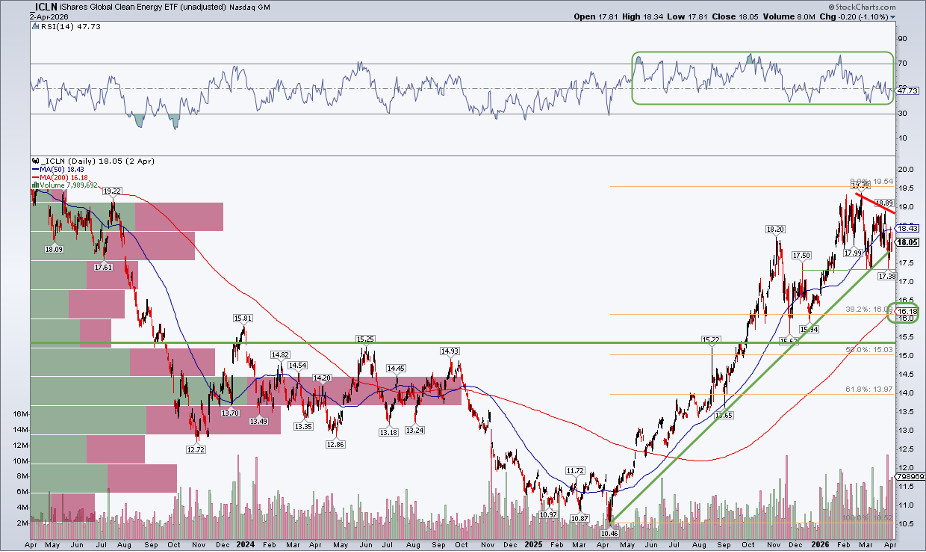
Notice in the chart below that the $2.2 billion AUM ETF is consolidating its YTD gains, now with a series of lower highs and modestly lower lows in the past several weeks. That has the hallmarks of a bull flag pattern. The presumption is that price will resolve in the trend of larger degree (higher), but downside levels must still be monitored.
I see near-term support in the mid-$17s, while the 38.2% Fibonacci retracement of the April 2025 to early 2026 rally comes into play close to the long-term 200-day moving average (just above $16). The 200dma is also on the rise, suggesting that the bulls control the primary trend. Finally, long-term support is down in the $15–$15.50 zone.
A breakout above the year’s high at $19.38 would be bullish, potentially triggering the next explosive advance. A technical risk is if ICLN breaks further below an uptrend support line from the year-ago low.
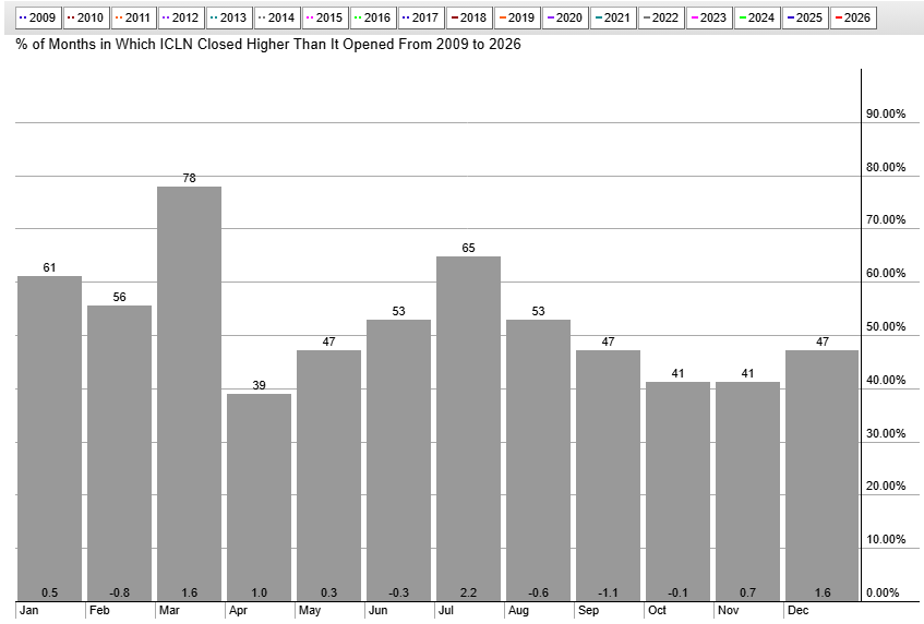
Seasonally, clean energy tends to make its move during the current calendar stretch. March–April has been the sweet spot since 2009, with generally bullish price action through mid-year.
Fundamental investors may want to keep tabs on earnings reports (more importantly, the stock price reactions) from the ETF’s largest holdings: Nextpower (NXT), Bloom Energy (BE), and First Solar (FSLR).
Sifting through what it owns, there’s indeed a dash of AI and data-center exposure in today’s clean energy space compared to that of the previous generation. Be sure to keep your eye on earnings from these players in the weeks ahead.
Where Is Strength Concentrating?
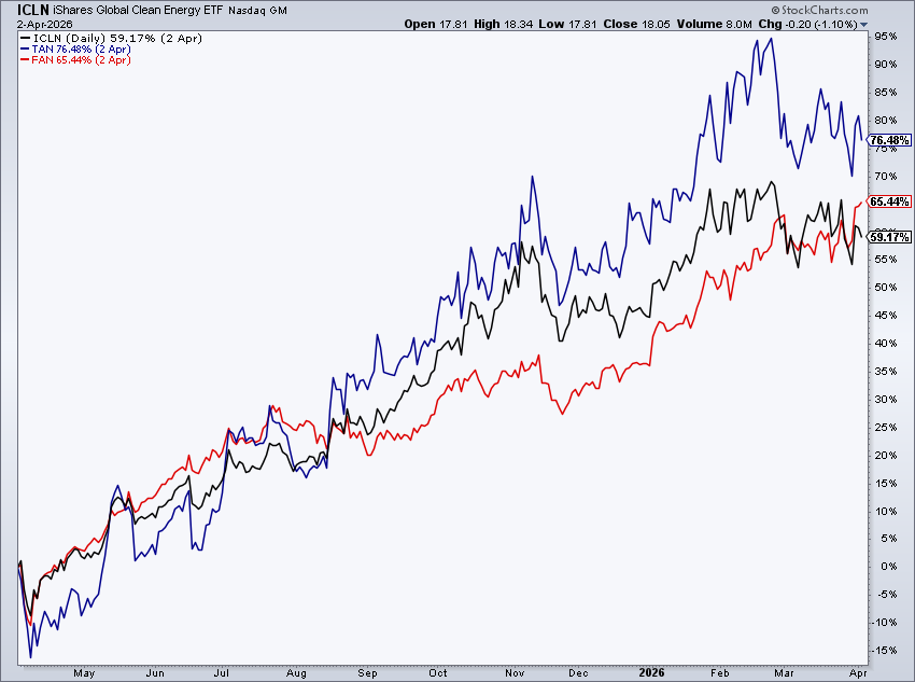
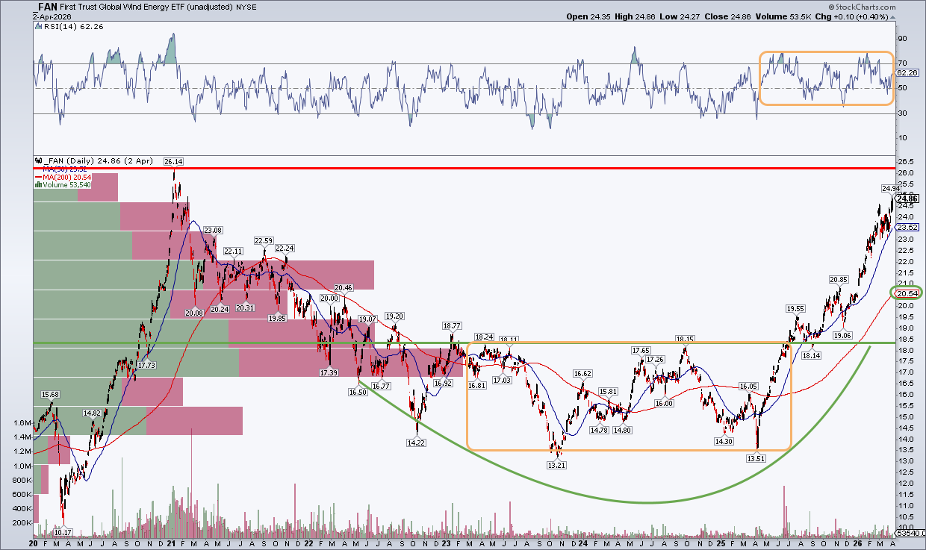
Traders can get more granular and seek out the absolute best relative strength in clean energy by parsing charts with two other products: the Invesco Solar ETF (TAN) and the First Trust Global Wind Energy ETF (FAN). The trio’s YoY returns are comparable (+60% to +75%), but just one closed last week at a multi-year high.
The smallest, FAN, has been blowing wind-energy bears away. Allocated 55% to the Utilities sector and with almost 90% of its assets invested in non-US equities, FAN is perhaps the most rogue of the major alternative energy funds. It has also about doubled from its 2025 double-bottom low, now encroaching on the infamous early 2021 peak (when green hopes flourished amid a blue wave in the Beltway).
Like with ICLN, both the short- and long-term trends are up, while the RSI momentum oscillator is firmly in a bullish zone (above 40). FAN more than achieved its measured-move upside price target (based on the 2023–2025 bottoming process and subsequent breakout).
That tells me there’s more to the rally. Above $26, the only “dead bodies” on the chart are from 2008, when the fund launched.
Markets vs. Narratives
Notably, most clean energy ETFs have been beating the S&P 500 for many quarters; it's not just a 2026 story as oil has taken off. Furthermore, markets have a way of toying with political narratives. Consider that ICLN, TAN, and FAN all performed poorly under the Obama administration, took off during Trump 1.0, cratered once Joe Biden was sworn in, and are now back on the rise in Trump 2.0.
It’s not a political statement, but it gets back to the old Wall Street/Jesse Livermore line: “The stock market is never obvious. It is designed to fool most of the people, most of the time.”
The Bottom Line
Energy has been just about the only game in town across the global equity universe. But energy has several crannies. Among them is clean energy. Solar, wind, and battery-storage stocks fly under the radar, with WTI and Brent crude oil above the fold each day. More upside may be on the way for this often-overlooked corner of the market.
Disclaimer: This blog is for educational purposes only and should not be construed as financial advice. The ideas and strategies should never be used without first assessing your own personal and financial situation, or without consulting a financial professional.