Think the Unthinkable: The Dollar May Go Up!

Last month, I published an article titled “Is the US Market Losing its Edge Relative to Global Equities?” Since then, the Europe‑Australia‑Far East ETF has outperformed the S&P 500. Yet the recent surge in articles and commentary endorsing this same trend gives me some pause, even though the relationship is unfolding as expected.
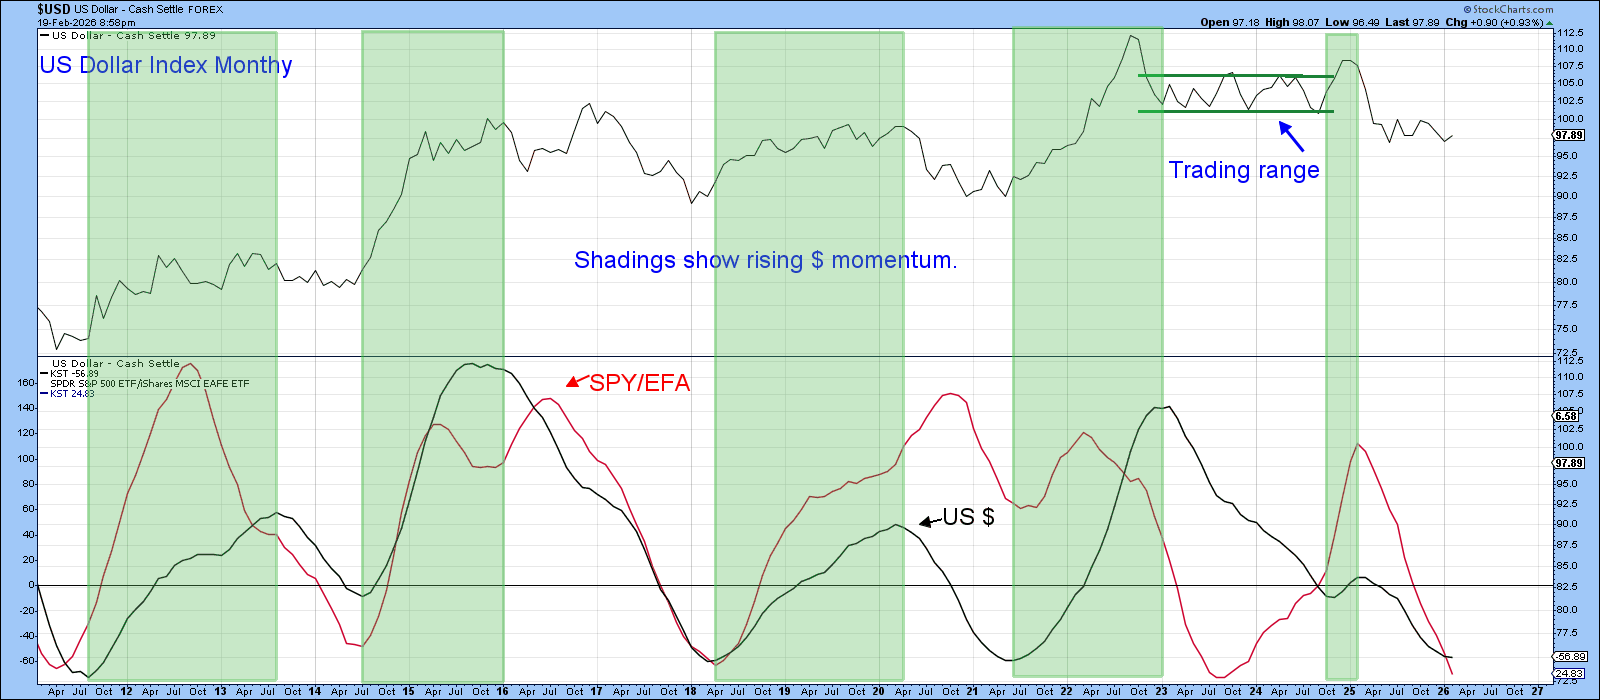
A key feature of swings in the SPY/EFA ratio is that, over long stretches, it tends to move in tandem with shifts in the US Dollar Index. Chart 1 illustrates this by comparing the long-term KST for the US Dollar Index with that for the SPY/EFA ratio. The alignment isn’t perfect but, over the past 15 years, there have been four instances where both indicators bottomed at roughly the same time. A rising dollar and a period of U.S. equity outperformance followed each of those lows. The only exception was the 2023 ratio low, which didn’t lead to a dollar bull market.
That brings us to the current setup, marked as a possible point five on the chart. Both indicators are clearly trending down and are oversold. The conditions for a potential reversal are very much in place.
Before diving into the dollar’s technical setup, it’s worth emphasizing that sentiment remains extremely bearish. From a contrarian standpoint, that’s constructive because it suggests most of the potential negative catalysts have already been priced in. As one recent headline put it:
“Investors Turn Record Bearish on the Dollar – Is This the Final Flush?”
AOL, Feb 18, 2026
According to the Bank of America Global Fund Manager Survey, investors are now more bearish on the dollar than at any point in at least 14 years.
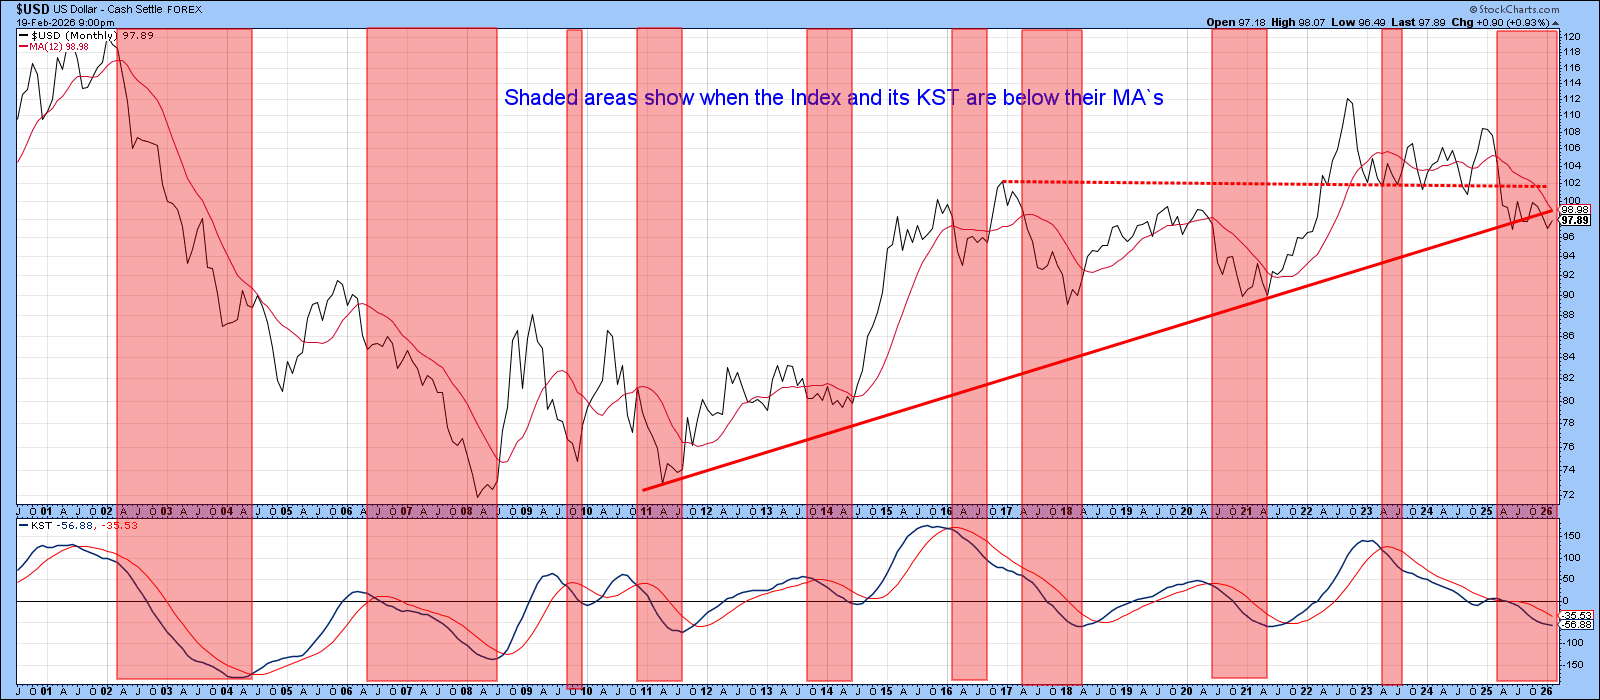
Chart 2 highlights this backdrop by shading periods when the Index and its long-term momentum sit below their respective moving averages — two conditions that define a primary bear market. By that measure, the Index is currently in a major downtrend. That said, it has slipped under its red secular uptrend line through sideways movement, rather than a decisive breakdown. As long as this pattern persists, the absence of meaningful downside follow-through suggests the technical picture may not be as weak as it seems on the surface.
Another sign that the dollar’s technical backdrop may be stronger than we think appears in Chart 3, which divides the post‑1994 price action into secular bull and bear phases. The key point is that bull markets tend to experience persistently overbought RSI readings and typically rebound quickly on those few occasions when the RSI dips into its oversold zone. These traits aren’t decisive on their own, but they add another meaningful piece of evidence to the broader picture.
Notably, in mid-2025, this indicator failed to generate any red shading—something it did during the 2003–2008 bear phase. That absence aligns more closely with a range-bound or secular bull environment than with a sustained bear market.
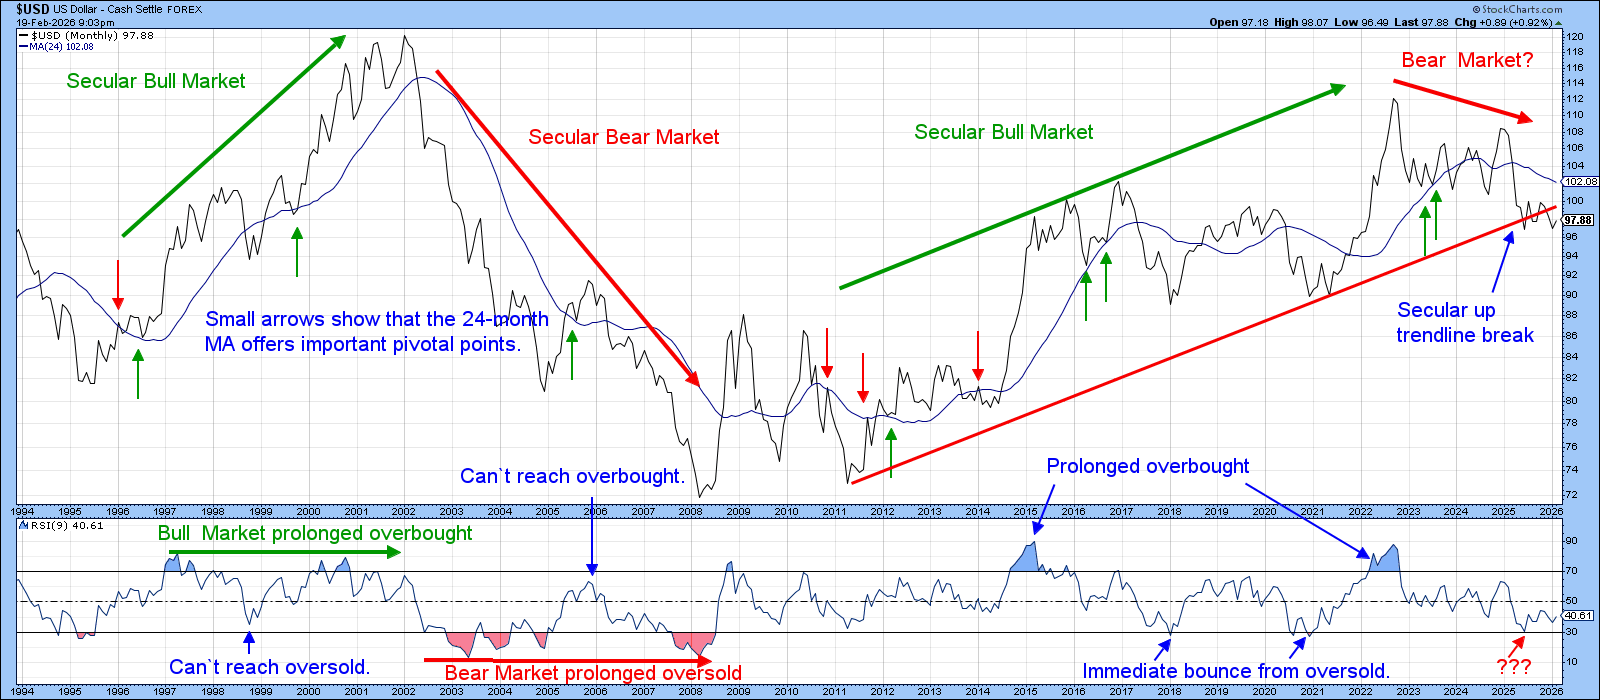
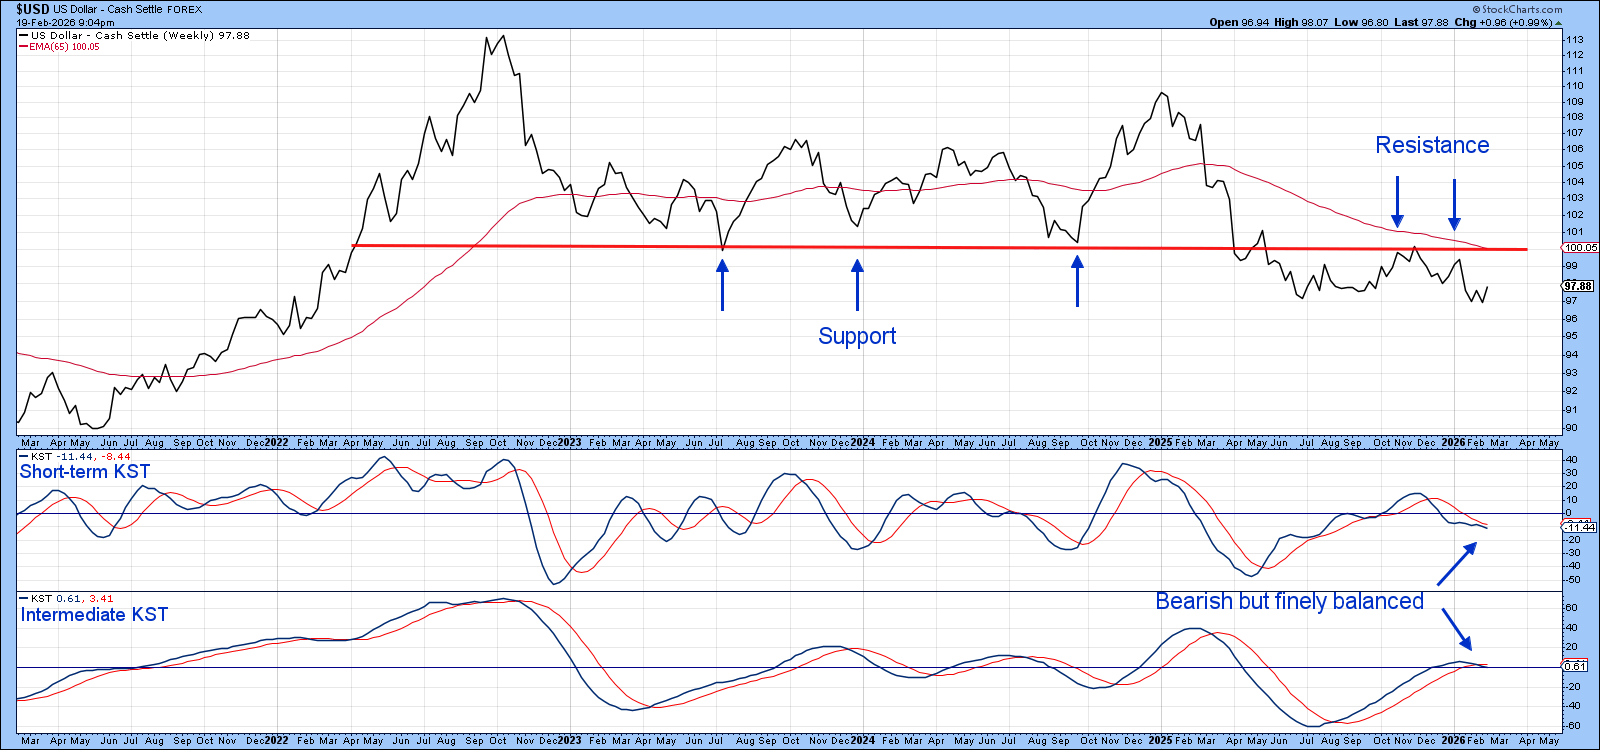
Chart 4 zooms in on the past three years and shows that the red horizontal trendline has shifted its role from one of support to serving as an equally important resistance level. What stands out is that the Index should have confirmed the bear market by breaking below its mid‑2025 low. Since it failed to do so, the downside trendline break may ultimately prove to be a whipsaw.
The likelihood of that outcome will increase if the Index can rally back and hold above its 65‑week EMA, which currently intersects the extended trendline near the 100 level. Both KST indicators are technically bearish, but they are so finely balanced that even a modest rally could flip them back to the upside.
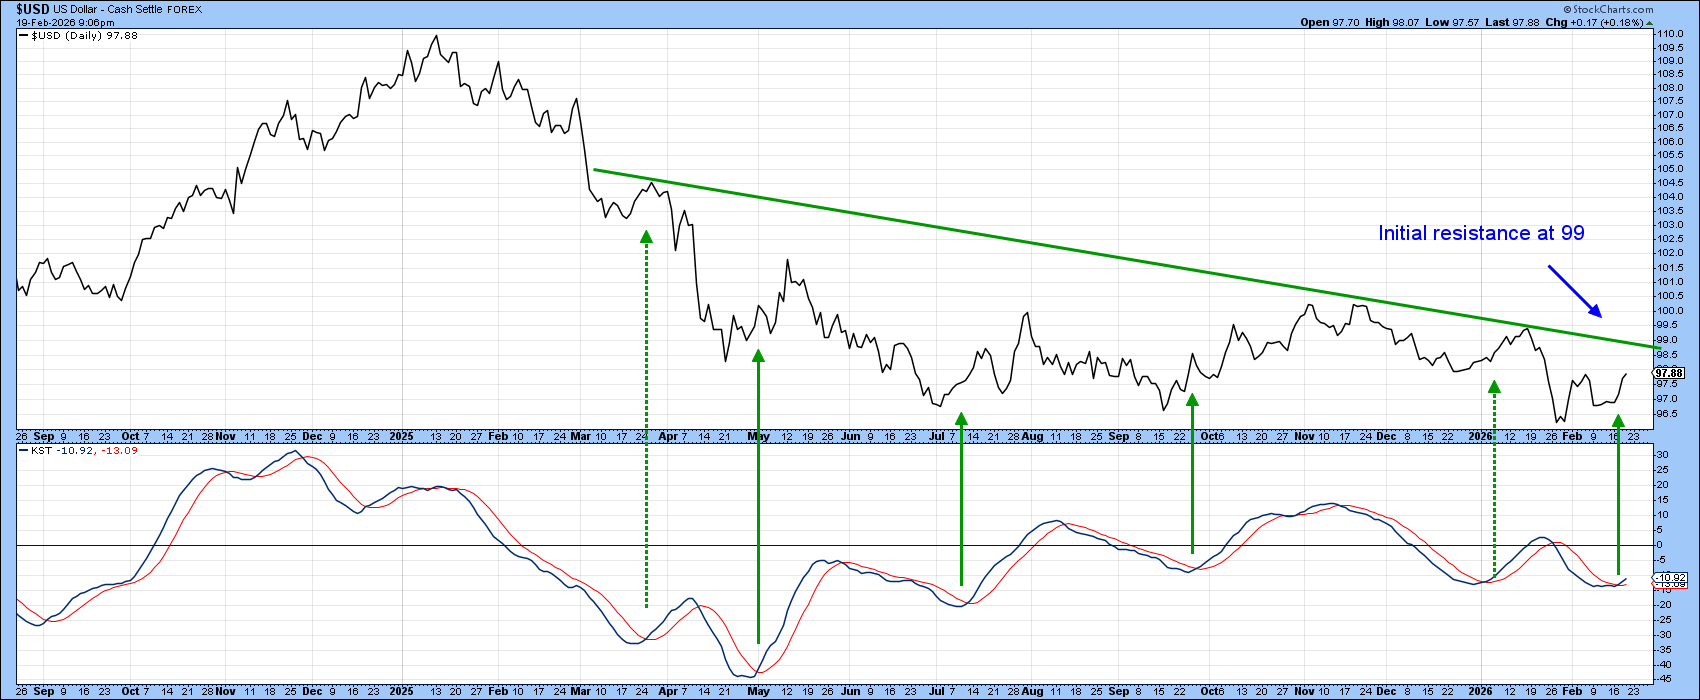
That balance may already be shifting, as the more sensitive daily KST in Chart 5 has turned higher. It could still fail, just as the two prior signals marked by the dashed arrows ultimately did. If it holds, however, and the Index manages to break above the green down‑trendline, then that would be the first clear indication that the crowd of dollar bears may have misjudged the situation. As a colleague once said to me (sarcastically), “All those people can’t possibly be wrong.”
Good luck and good charting,
Martin J. Pring
The views expressed in this article are those of the author and do not necessarily reflect the position or opinion of Pring Turner Capital Group of Walnut Creek or its affiliates.