This Sector Looks Ready to Break Out Big Time
On Friday, the Dow experienced a record high, right alongside the more broadly-based NYSE Composite and the NYSE A/D Line. The speed of Friday's rally caught most by surprise, which adds to its credibility and indicates that higher prices are likley yet to come. Sector ETFs that touched new highs include, IYZ, XLP, IYT, XLB, IYJ, and XLE.
Notably absent was the tech-dominated NASDAQ Composite and tech itself in the form of the XLK. Another sector that did not register a new high, but could be close to doing so, is the high-yielding SPDR Real Estate ETF, the XLRE, so let’s take a closer look.
Chart 1 features XLRE back to its inception around the turn of the century. It experienced a slow-but-steady rise until late 2021, but has since been rangebound.
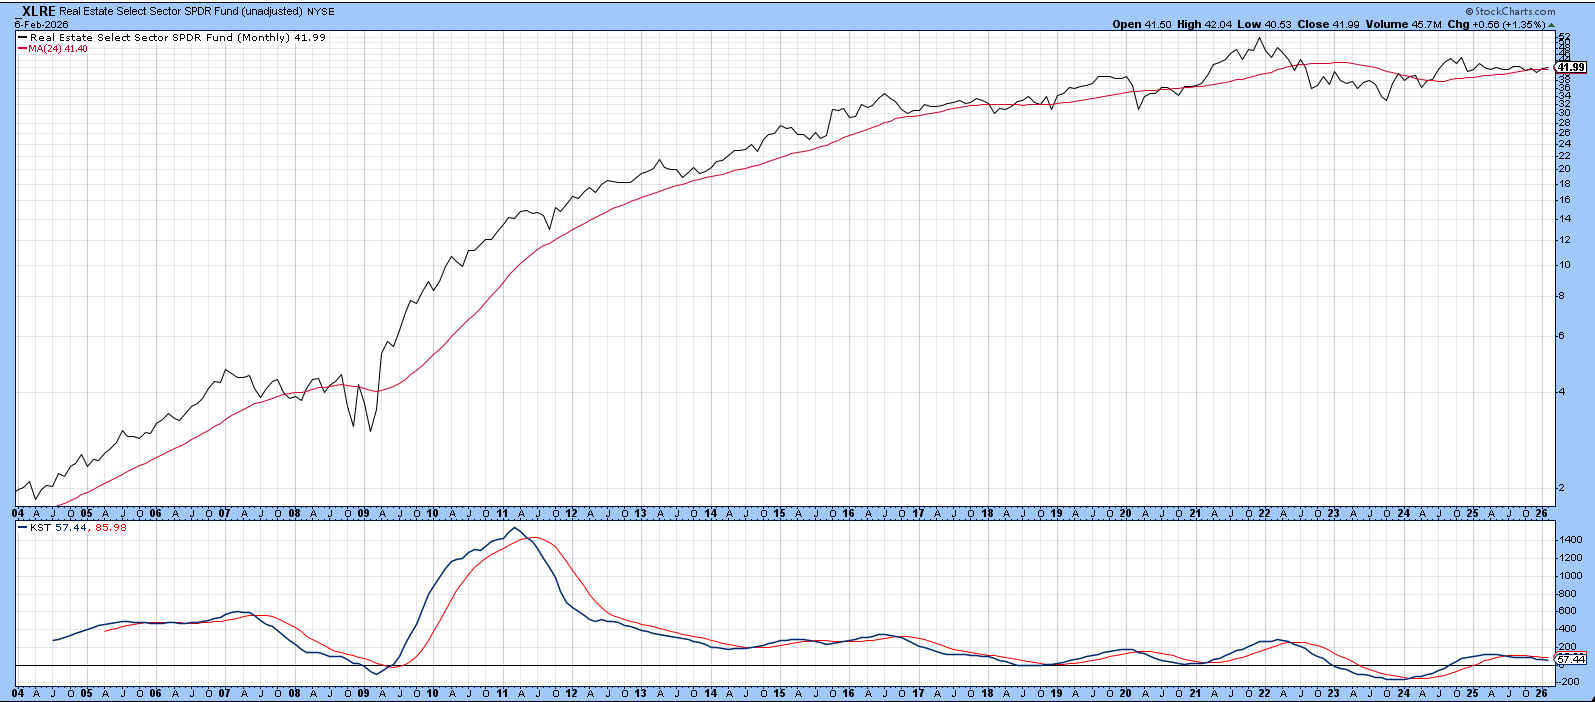
Chart 2 focuses on the last 5 years or so and includes dividends. It is pretty evident that the price has reached an important resistance trendline, with the support expected from a broad stock market rally being one reason it’s likely to go through. Another reason comes from the short-term KST, which has just gone bullish; its intermediate counterpart has also started to turn up. The primary or long-term KST is declining slightly but is effectively in a fine state of balance, one that could easily be tipped in either direction. If the price is able to push through the resistance, that would probably be enough to reverse this indicator.
Ideally, we like to see these long-term smoothed momentum indicators reverse from a subzero position. Nonetheless, the green arrows in the left-hand part of the chart demonstrate that a worthwhile advance can also materialize from an above zero cross.
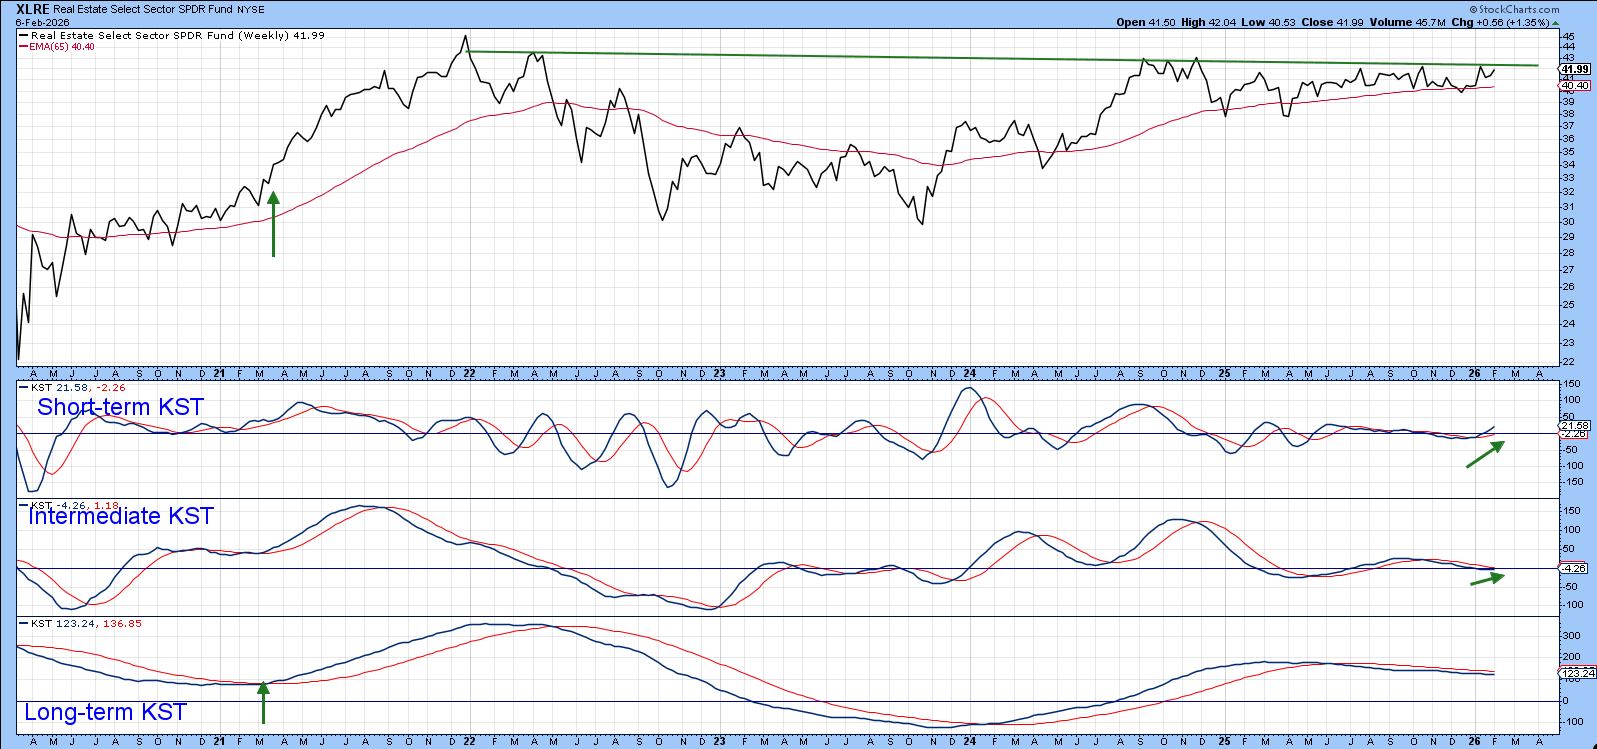
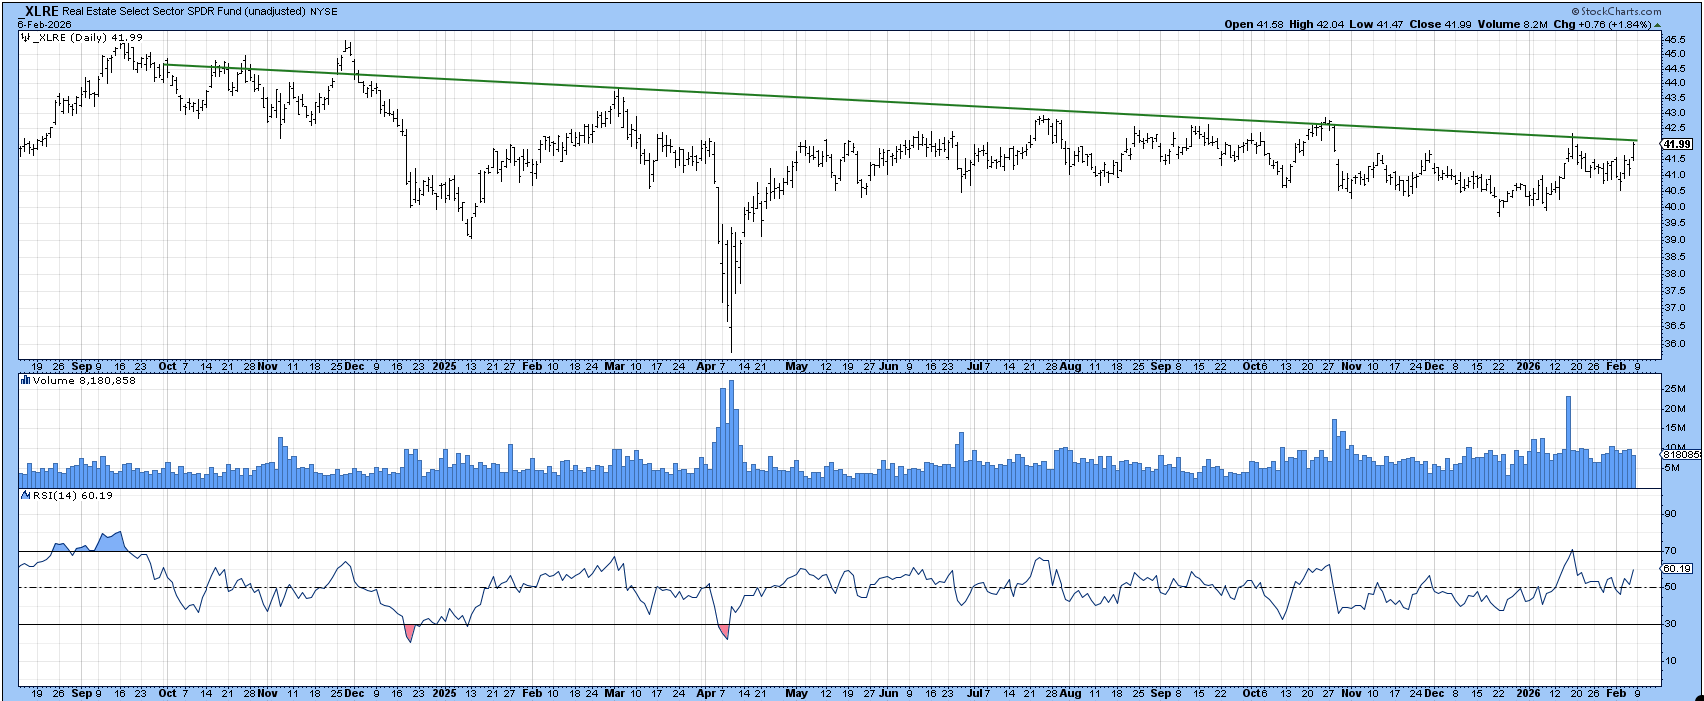
Chart 3 excludes dividends and shows that, on a pure price basis, this sector has experienced a gentle decline over the course of the last two years. As of last Friday’s close, it is literally right at the resistance trendline line.
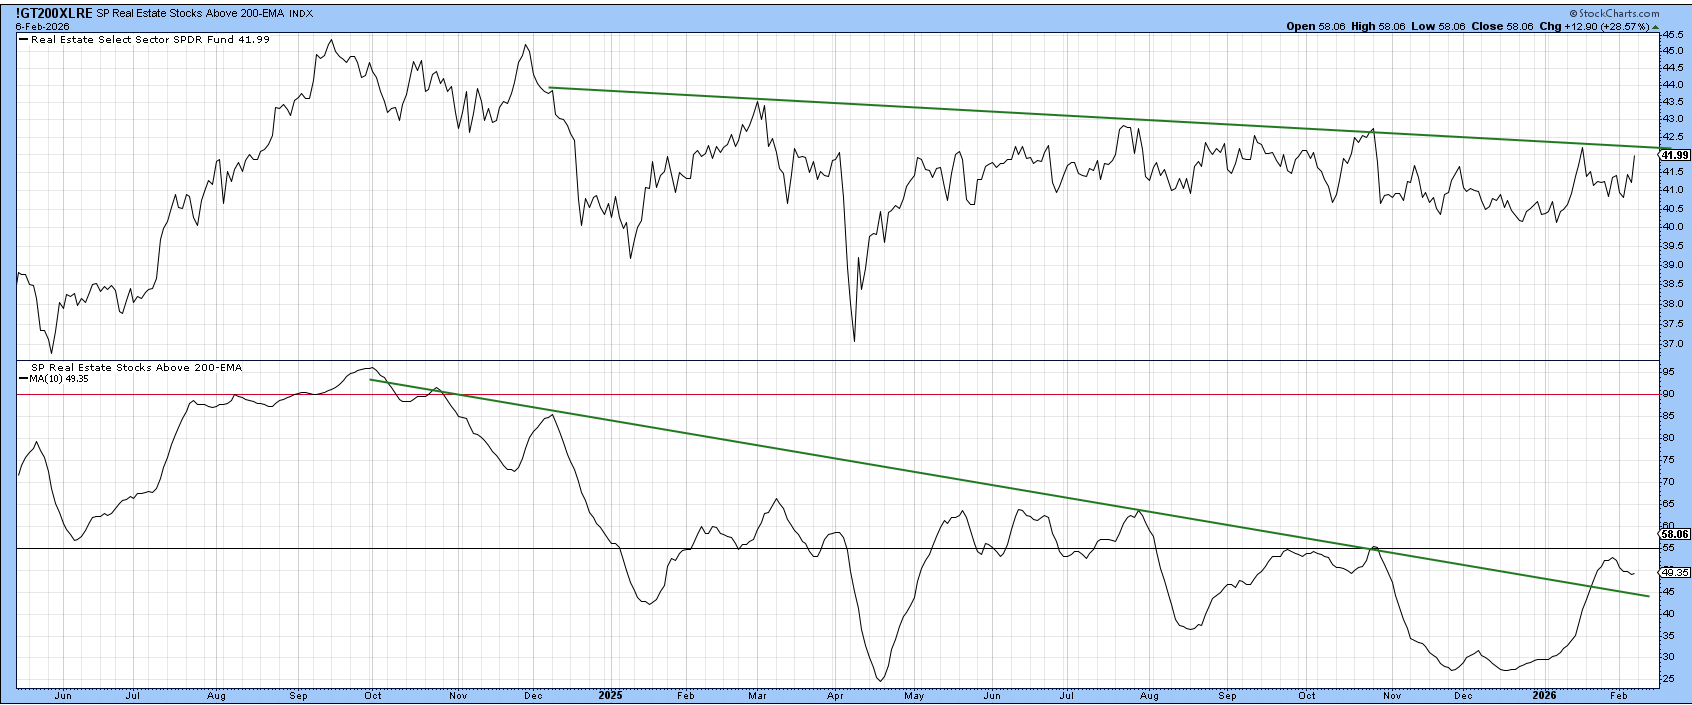
StockCharts conveniently provides us with internal breadth indicators for the major sectors. One of these monitors the percentage of real estate stocks above their 200-day EMA, as displayed in Chart 4. Since the raw data is pretty jagged, the plotted series is a 10-day MA of the actual data, which peaked back in late 2024 and has been working its way lower ever since. In late January, it managed to decisively violate the 2024-2026 down trendline, which suggests the corrective period is over. The current, relatively subdued reading also leaves plenty of upside potential before the indicator reaches an overbought condition.
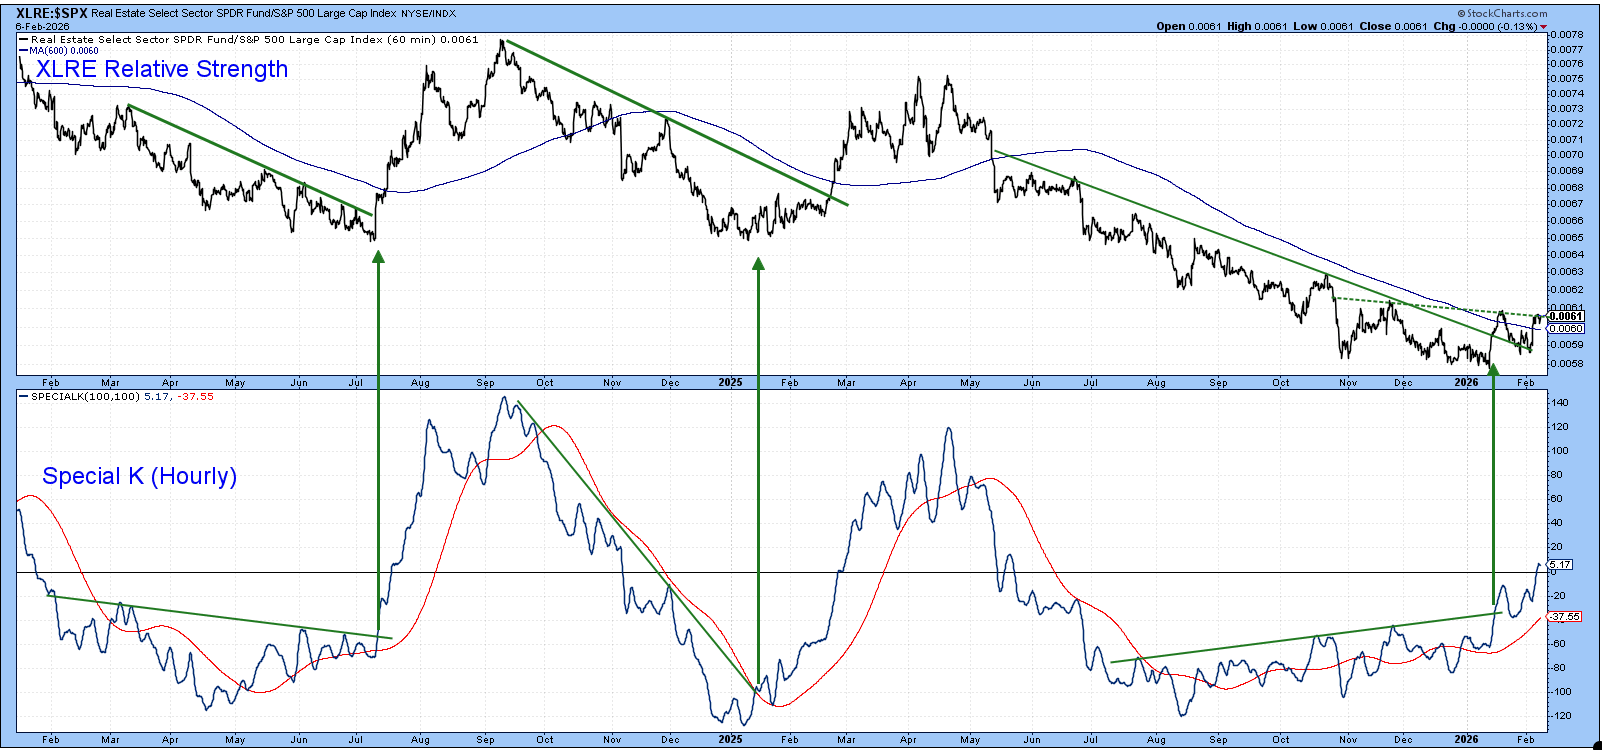
Even as the market has been soaring in the last two years, the XLRE has been moving sideways, thereby resulting in weak relative strength. Part of this underperformance, which actually began over 10 years ago on a pure price basis, is displayed in the upper window of Chart 5 using hourly data. The chart also features the Special K (SPK), which uses the exact same parameters as it would on a daily chart. Important signals of a reversal in trend are triggered when it is possible to construct a trendline for both series and both are violated. The chart exemplifies two examples of such a setup. A third has just been triggered, as the post-June down trendline for the price has been penetrated along with the post July resistance trendline for the SPK.
Another very bullish sign comes from the fact that the SPK has been tracing out a series of rising peaks and troughs since November. Now, the SPK is stuck at the (dashed) neckline of a potential reverse head-and-shoulders. To find out whether the RS line goes through or not, simply click on the chart as new data is updated.
Conclusion
It’s important to note that the XLRE has not yet broken out. However, the various indicators are pointing in the direction of a highly significant and positive setup. If, as I suspect, the overall market is in the early stages of a new up leg, REITS are very likely to participate on both an absolute and relative basis.
Good luck and good charting,
Martin J. Pring
The views expressed in this article are those of the author and do not necessarily reflect the position or opinion of Pring Turner Capital Group of Walnut Creek or its affiliates.


