This Week in Charts: Surprises Ahead?
Wow! What a Week on Wall Street!
The S&P 500 ($SPX), Nasdaq Composite ($COMPQ), and the Dow Industrials ($INDU) all flirted with record highs at some point during the week, small caps stole the spotlight for a couple of days, and some beaten-down names like UnitedHealth Group (UNH) and Intel Corp. (INTC) woke up and joined the party.
The market’s still chugging along, and you can see it for yourself on the Market Summary page. When you switch the view to One Month from the timeframe dropdown menu on the top left, you’ll notice that all US Indexes in the Equities panel are trading above their 200-day simple moving average (SMA), with the Nasdaq Composite and Nasdaq 100 ($NDX) leading the pack.
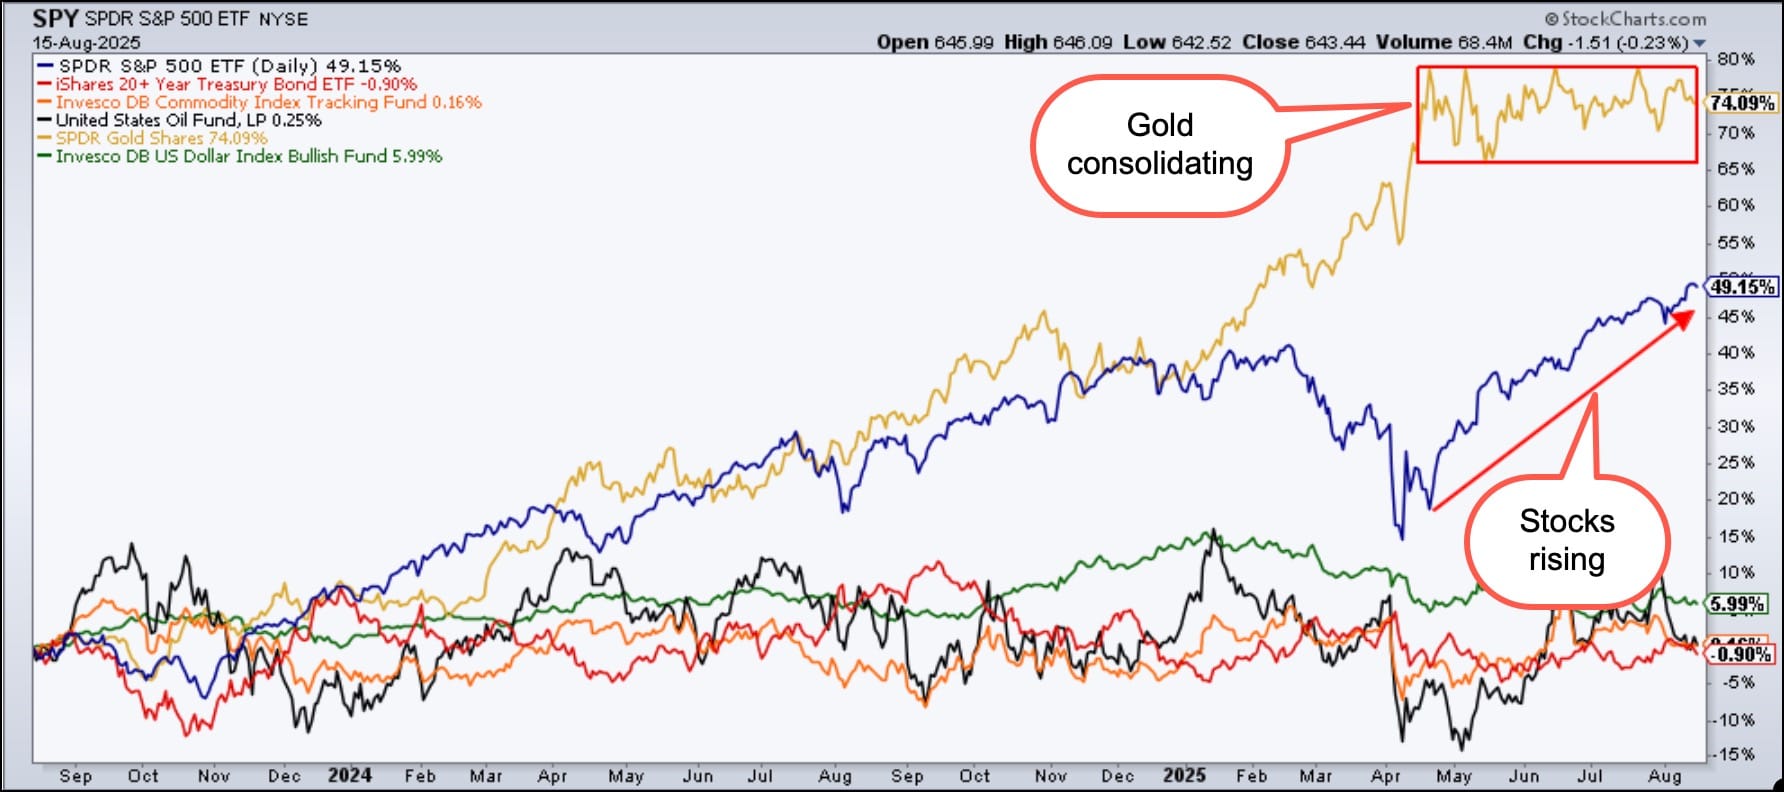
Here’s where it gets interesting. Check out the Intermarket Analysis panel, which examines the relationship between stocks, bonds, commodities, and currencies. The chart on the right of the panel (see below) analyzes the one-year performance of these different asset groups. Gold may be the one-year performance champ, but since mid-April, it has been moving sideways. Stocks, on the other hand, are climbing.
Click on the Charts button (at the top right of the panel) and scroll through the asset group charts. With these, you’ll see that equities are holding strong, whereas all other asset groups are at or slightly below key support levels, either the 200-day SMA or 50-day SMA. Further down, you’ll find the relative performance over the past year, and see that equities are outperforming all other asset classes. This type of price action in equities is likely to make investors feel complacent (the VIX closed at 15.09), but, as you know, this is exactly when the market loves to throw curveballs.
And speaking of curveballs, there are a couple of market movers that could impact the market next week. There’s the outcome of the meeting between President Trump and Putin, and further out, the Fed’s interest rate decision. These could quickly shake up the asset class leaderboard.
Bottom line: Whether you invest in stocks, bonds, commodities, or currencies, it pays to understand how they all dance together. The Market Summary page provides a quick visual pulse of the market’s action. It’s worth checking out daily, weekly, or, at the very least, monthly.
Equities are looking strong now, but next week’s a whole new ballgame. So kick back, pour yourself a cup of coffee, and enjoy this week’s collection of articles and videos. They’re packed with wonderful insights that’ll keep you on top of your investment game.
Have a great weekend and happy charting!


