Three Charts That Prove the Power of Process Over Prediction

Successful investing using technical analysis is not just about finding the “next big thing” and buying strong charts. What it's even more about is using the charts consistently after you’ve taken a position, in order to track whether the price action actually follows through on your expected outcome.
I recently sat down with Grayson Roze to discuss our Ten Must-See Charts for October 2025, which included the three charts I’m about to share with you. My goal today is to illustrate the initial thesis as we discussed, and then update on what’s happened in the weeks since we released the video.
Most importantly, I hope this exercise helps reinforce the value of a consistent process of technical analysis. As I love to tell my Market Misbehavior premium members, “An imperfect but consistent process is way better than a perfect but inconsistent process!”
Caterpillar, Inc. (CAT)
For Caterpillar, the breakout above resistance at $440 in mid-September was a pivotal moment in the ongoing uptrend phase off the April low. This sideways consolidation pattern, really more of a “time correction” than a price correction, took CAT right to its 50-day moving average. A surge higher into late September propelled this industrial name to a new three-month high on strong momentum and improving relative strength.
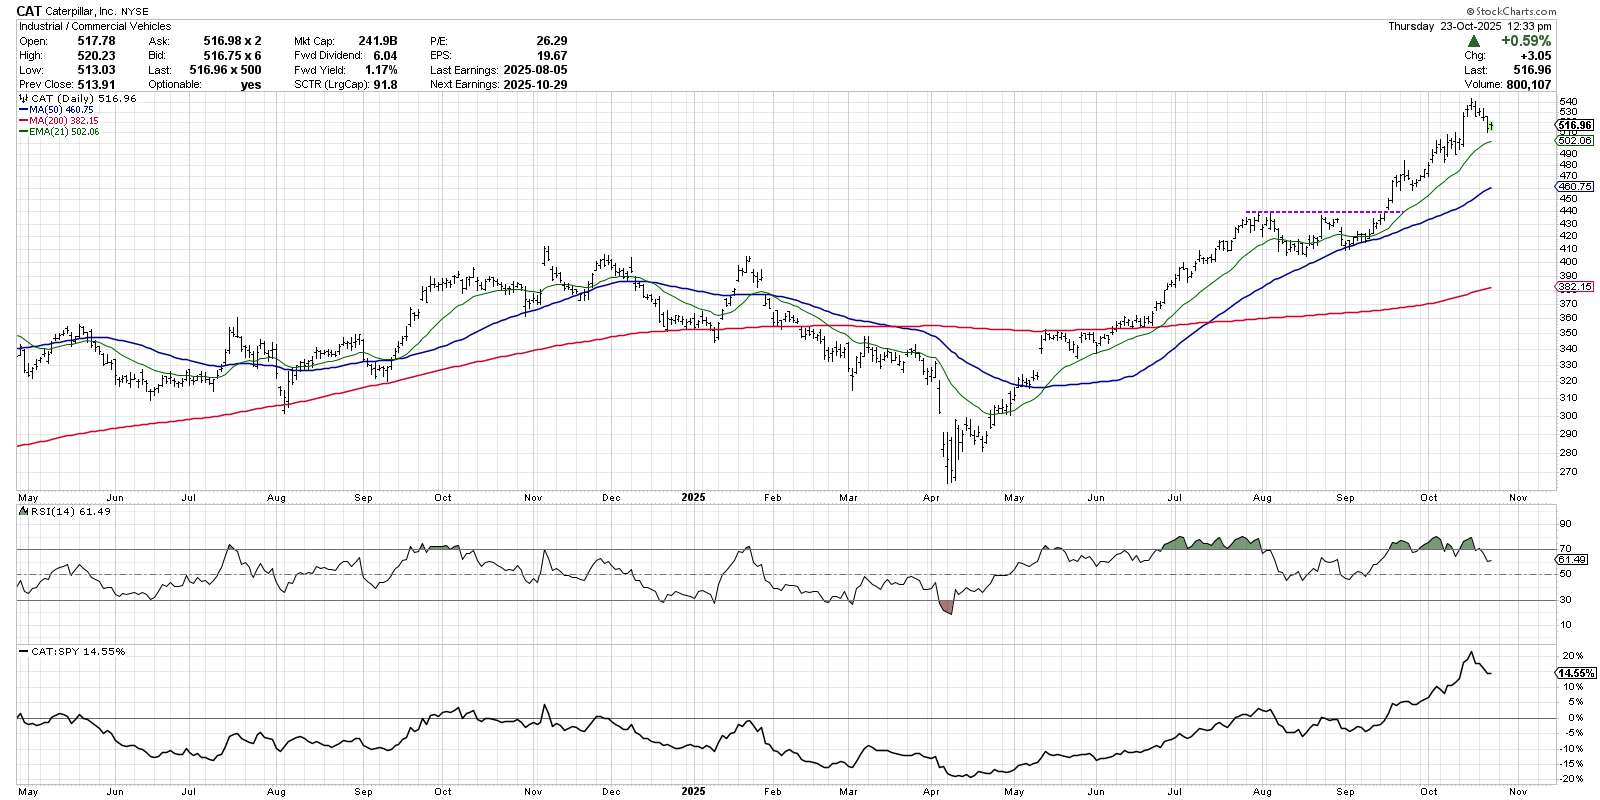
Caterpillar has continued quite well with the uptrend phase, reaching a new all-time high just above $540 earlier this month. We’re now seeing a tactical pullback within the uptrend phase, which could bring the 21-day exponential moving average into play. As long as CAT remains above this initial level of support, we’re inclined to consider this chart as “innocent until proven guilty.”
Also note that in the August and September time correction, the RSI was overbought in July before the sideways price action. We’ve recognized a similar pattern in the RSI over the last four weeks, perhaps implying another corrective move is ready to go. Again, we’re watching support levels, and as long as those hold, then the uptrend remains in great shape.
Broadcom Inc. (AVGO)
Broadcom seemed an excellent candidate for the “top ten” list because it had pulled back to gap support. We were encouraged by the gap higher on earnings in early September, and after achieving a new all-time high around $370, the stock had pulled back to that gap range. The 50-day moving average also appeared to confirm potential support around $320–330, providing a clear downside risk level.
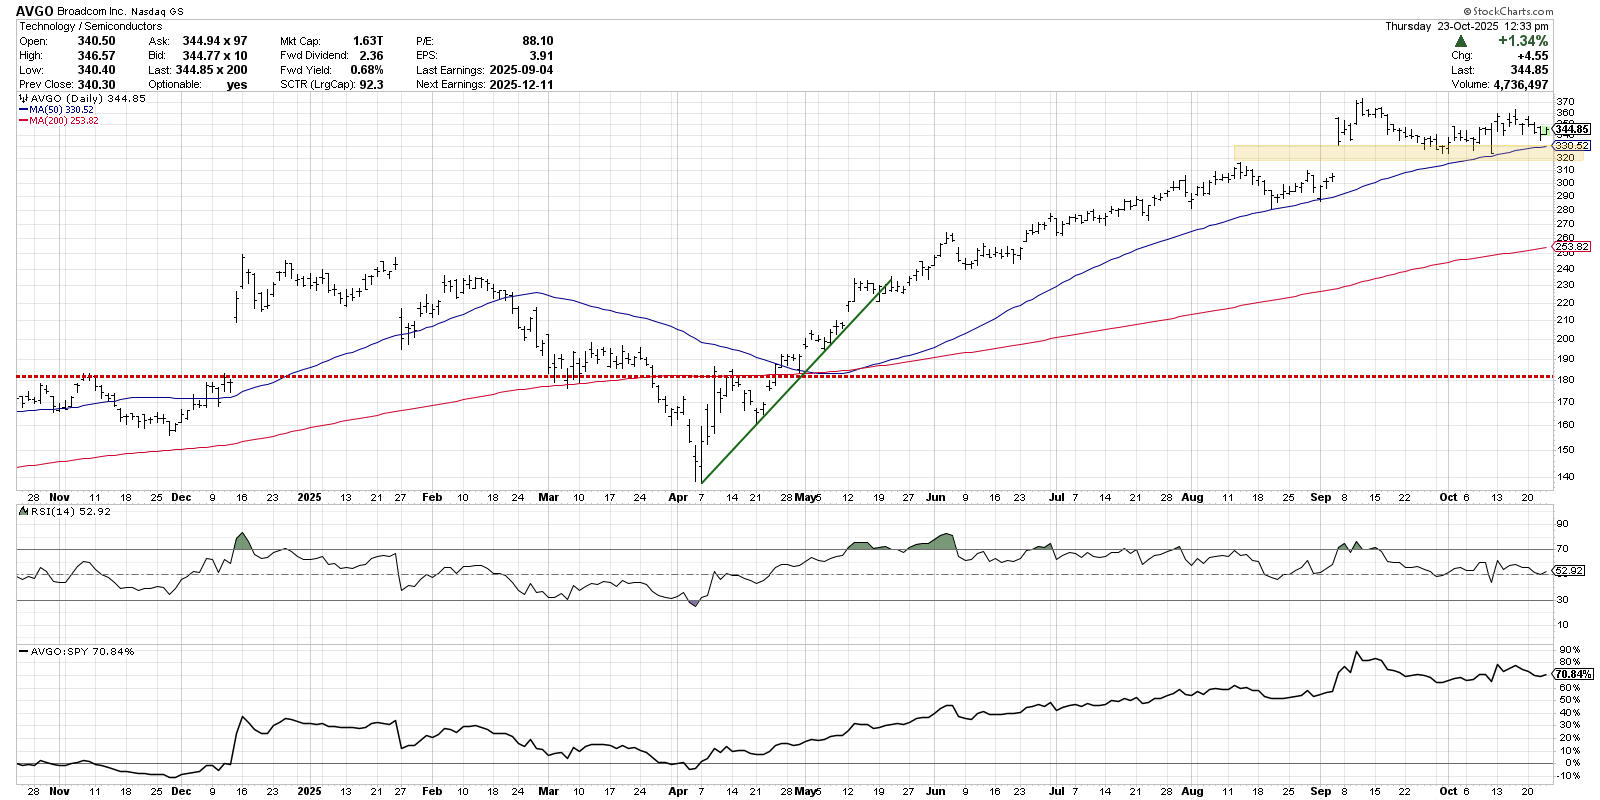
I would say that AVGO has demonstrated a similar correction to what we discussed with Caterpillar. Has the uptrend phase implied by the September breakout continued to show strength? No. But has the stock broken any significant support levels, which would indicate a new distribution phase? Also no!
For now, we’re noting the absence of strong momentum, with the RSI remaining between the 40 and 60 levels. Legendary trader Jesse Livermore would consider this a time to “sit on your hands,” waiting for a breakout with a clear momentum mandate. In other words, AVGO sits in a consolidation phase until proven otherwise!
APA Corporation (APA)
We’ve generally been leaning away from energy stocks because of the consistent weakness in crude oil prices. But despite that general price weakness going into October, APA Corporation stood out because of a classic uptrend channel. Higher highs and higher lows, combined with potential support at the 50-day moving average, suggested APA as a decent opportunity to diversify away from the growth stocks that have dominated investors’ thinking in 2025.
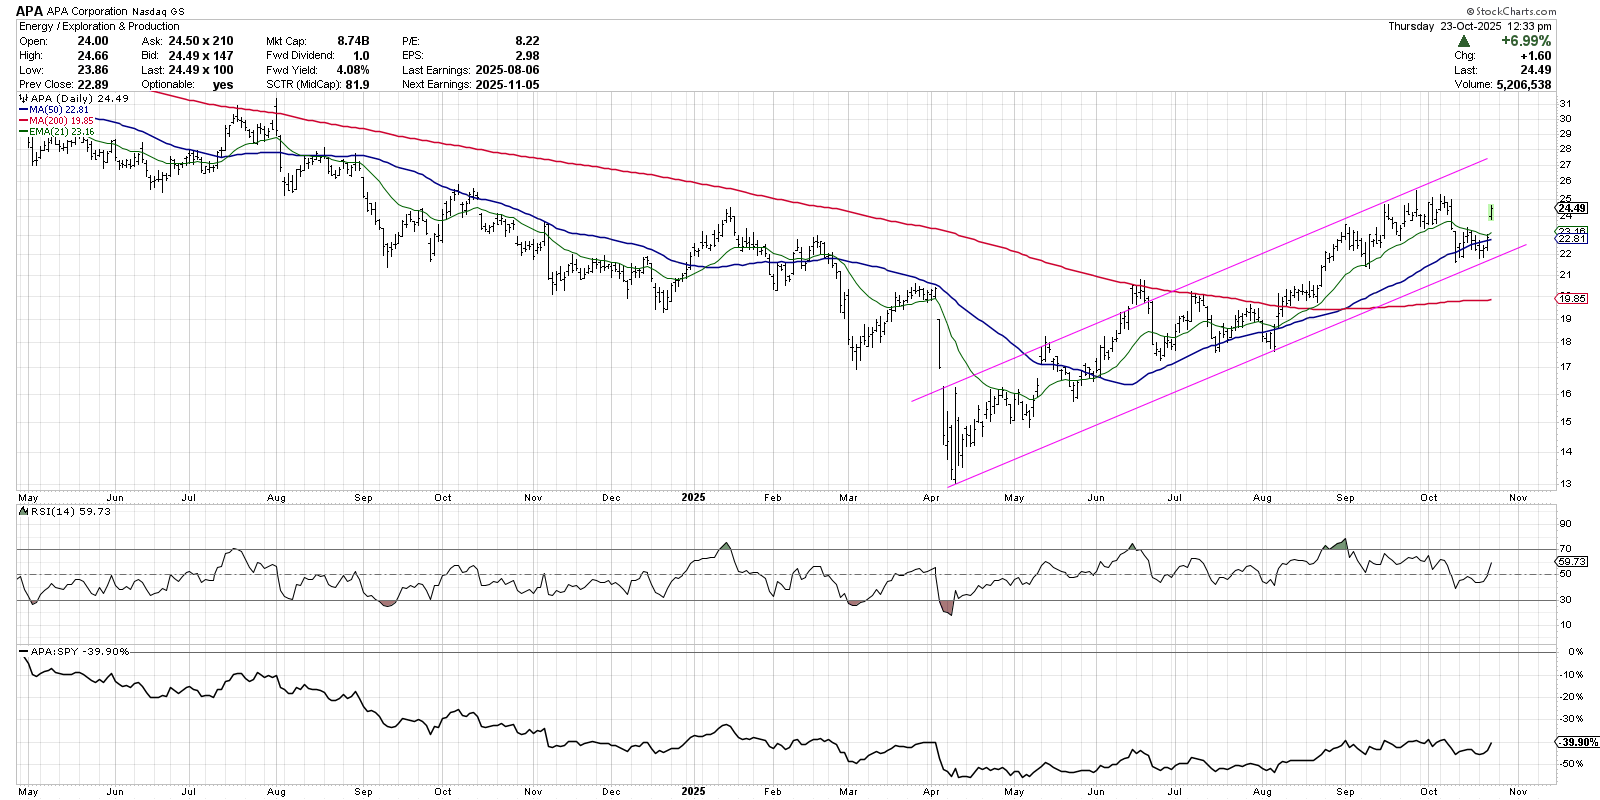
In recent weeks, APA has pulled back to the lower end of the trend channel, once again finding support at a trendline based on the April and August lows. The energy name has also bounced off the 50-day moving average, very similar to what we observed in July and August. With APA and other energy stocks gapping higher this week on stronger crude oil prices, we would consider the chart to be “innocent until proven guilty” as the accumulation phase continues.
Which stocks stand out to you as you revisit our top ten charts for October 2025? Make sure you drop a comment and let me know!
RR#6,
Dave
P.S. Ready to upgrade your investment process? Check out my free behavioral investing course!
David Keller, CMT
President and Chief Strategist
Sierra Alpha Research
marketmisbehavior.com
Disclaimer: This blog is for educational purposes only and should not be construed as financial advice. The ideas and strategies should never be used without first assessing your own personal and financial situation, or without consulting a financial professional.
The author does not have a position in mentioned securities at the time of publication. Any opinions expressed herein are solely those of the author and do not in any way represent the views or opinions of any other person or entity.


