To Be Invested or Not to be Invested? That is the Question
Market conditions tell us when to be invested in stocks and when not to be invested. Chartists can filter the noise and define market conditions using three simple indicators. They are the long-term trend for the S&P 500, the percentage of stocks in long-term uptrends, and the High-Low Line. All three are currently bullish, which means market conditions are favorable for stocks. At the very least, there is a bull market somewhere and this means being invested. Today's report will cover these indicators and show the key levels to watch.
Key Takeaways
- The weight of the evidence remains bullish for stocks (be invested).
- SPY remains in a long-term uptrend.
- Over 60% of S&P 500 stocks are in long-term uptrends.
- New highs continue to outpace new lows.
The Long-Term Trend for SPY
The SPDR S&P 500 ETF (SPY) is the single most important benchmark for US stocks. There is a bull market somewhere when SPY is in an uptrend.
I use the 5-/200-day SMA cross to identify the long-term trend. Smoothing the close with a five-day SMA reduces whipsaws and maintains signal integrity. An uptrend is present when the 5-day is above the 200-day. A downtrend rules when the 5-day is below the 200-day. A bullish cross occurred on May 15th and this signal remains valid.
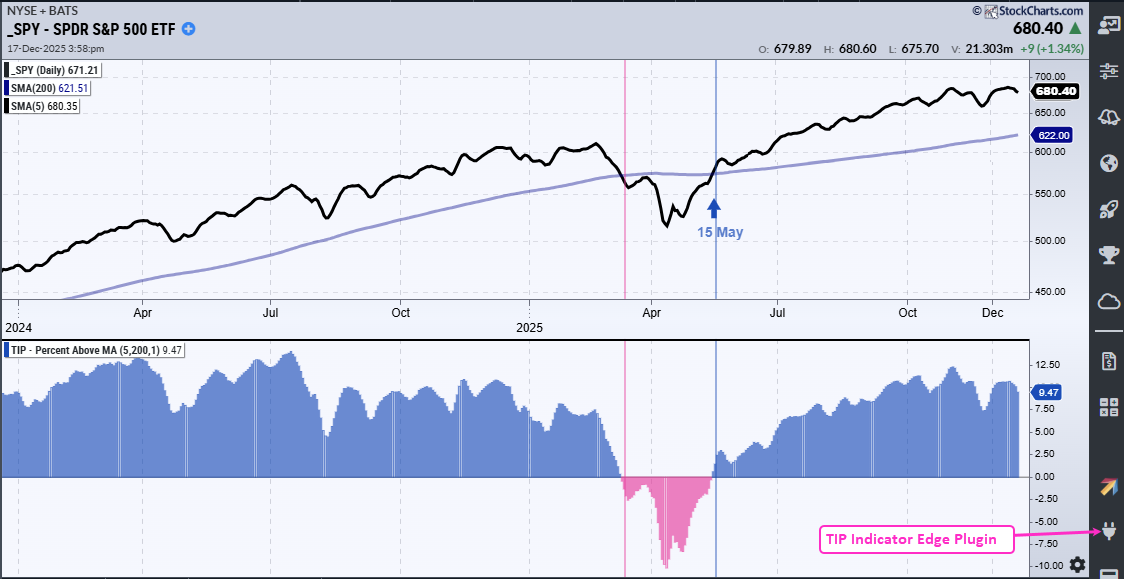
The indicator window shows Percent above MA (5,200), which shows the percentage difference between the 5- and 200-day SMAs. This indicator is positive (blue) when the 5-day is above the 200-day and negative (pink) when the 5-day is below the 200-day.
I am not concerned with divergences because these just create noise for talking heads! Instead, I just want to know the direction of the long-term trend. Percent above MA is one of 11 indicators in the TIP indicator edge plugin for StockCharts ACP.
Percentage of Stocks Above 200-Day SMA
The next check is for participation. How many stocks are in long-term uptrends and long-term downtrends? At its most basic, the market is net bullish when 51% of S&P 500 stocks are in long-term uptrends. Ideally, we want to see more than 60% of stocks above their 200-day SMAs, which is the vast majority.
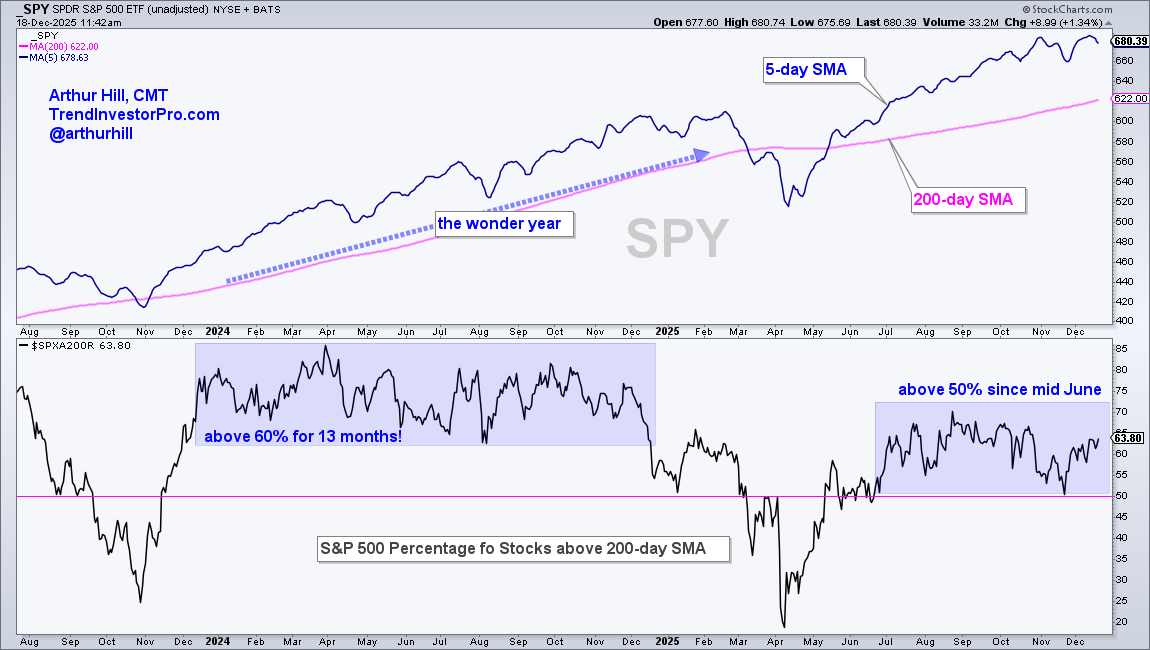
Currently, over 60% of S&P 500 are above their 200-day SMAs, which is the vast majority of stocks. This is bullish. Notice that this indicator has been above 50% since mid-June, and successfully tested the 50% level in November. A cross below 50% would show a material decrease in upside participation and provide the first sign of trouble.
Recent reports and videos at TrendInvestorPro:
- Comparing the February Peak with Current Conditions (SPY)
- Breakout Updates for Tech, Housing, Retail, and Bank ETFs
- Metals Continue to Lead, as Bitcoin and Oil Lag
- 7-10Yr T-Bond ETF Hits Moment of Truth
- Core ETF ChartList (76 ETFs organized in a top-down manner)
Click here to take a trial and gain full access.
New Highs vs. New Lows
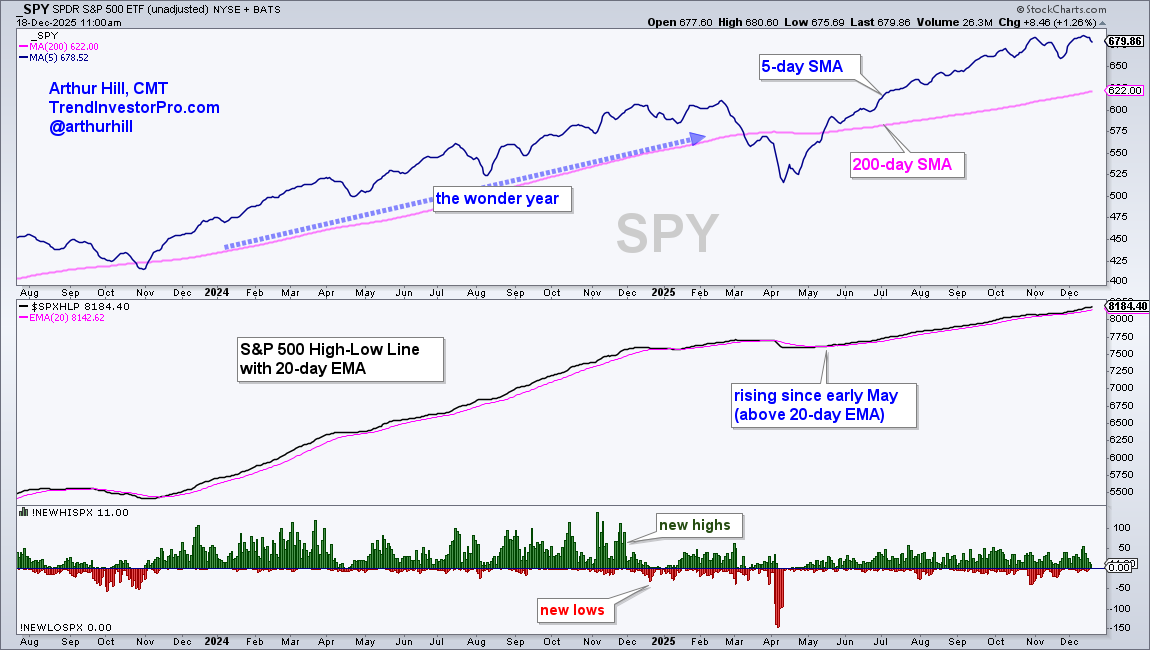
The next check is for leadership. How many stocks are recording new 52-week highs and how many are recording 52-week lows? Stocks making 52-week highs are in leading uptrends, while stocks making 52-week lows are in strong downtrends. We want to see more new highs than new lows.
The High-Low Line is a cumulative measure of net new highs (new highs less new lows). It rises as long as new highs outnumber new lows. Most recently, the High-Low Line turned up with a cross above its 20-day EMA in mid May and remains in an uptrend. Bullish.
The weight of the evidence is clearly bullish for stocks. SPY is in a long-term uptrend, over 60% of S&P 500 stocks are in long-term uptrends, and new highs continue to outpace new lows. This evidence has been bullish since mid May. As long as the evidence remains bullish, we want exposure to stocks. This position changes when the evidence changes.
See the TrendInvestorPor Premium Page for more analysis and videos.


