Top Charts for December: When the 200-Day Becomes the Deciding Factor

Key Takeaways
- Your first step when analyzing a chart is to assess the strength of the trend or look for rotation from bearish to bullish phase.
- Charts of COO, COIN, and HBAN are either finding support/resistance at the 200-day moving average or breaking above it.
- The 200-day moving average paints a clear picture of changing trends or evolving opportunities.
Successful investing is not about stumbling upon a perfect trade by accident, but rather about building a consistent process of analyzing the charts to look for constructive setups. My own technical analysis checklist starts with an evaluation of the trend. We can assess trend strength using Charles Dow’s classic method of looking for higher highs and higher lows, or we could use a simple moving average to determine when a stock has rotated from a bearish phase to a bullish phase.
As I gathered charts to highlight as part of my Top Ten Charts to Watch for December, I found three specific charts where the 200-day moving average is part of a compelling technical story. We’ll also show how other technical analysis tools can help us validate the message of the 200-day and provide a more complete picture of price.
Finding Support From Above: COO
A downtrend, by definition, is formed by a pattern of lower highs and lower lows. Cooper Cos. (COO) was in a clear downtrend phase from September 2024 through August 2025. But after making a few higher lows in recent months, COO has now broken back above the 200-day moving average for the first time since January.
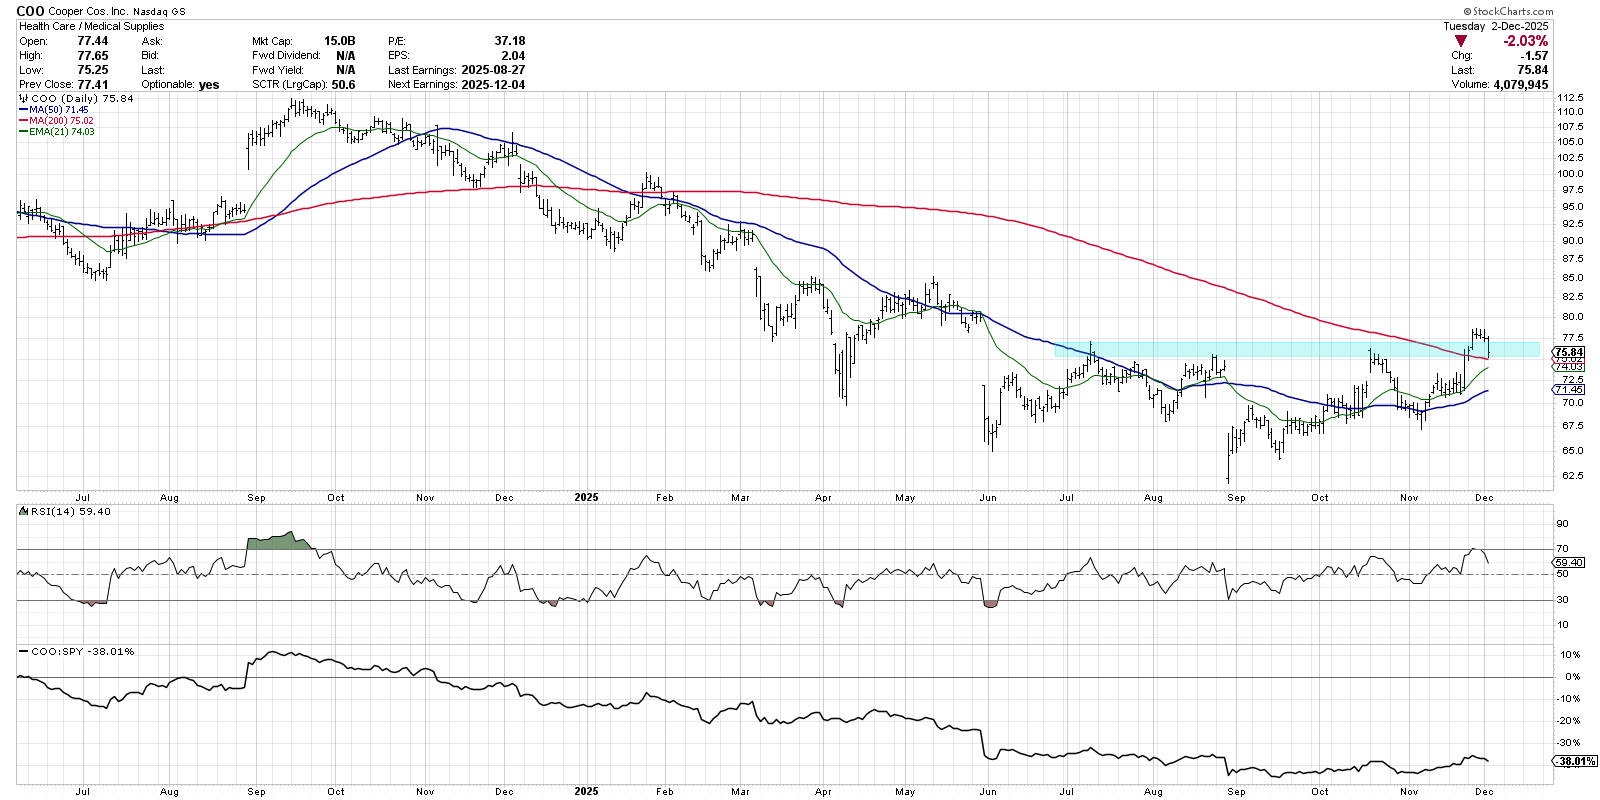
When the price popped above the 200-day last week, that also meant a push above a well-established resistance range around $75–77. After a break above resistance, charts will often see pullback to the breakout level. A new bullish uptrend phase can be confirmed if that subsequent pullback holds the new support level, potentially setting the stage for future price gains.
We can also see that the Relative Strength Index (RSI) had remained in a bearish range since Q4 2024, with the RSI not getting much above the 60 level during short-term upswings for Cooper. With the RSI now rotating into a bullish range, and the price becoming overbought during the breakout move, COO could be setting up for the next leg higher.
Testing From Below After Breakdown: COIN
Shares of Coinbase Global (COIN) have been trending lower, driven in no small part by the severe weakness in Bitcoin and Ethereum in Q4. COIN broke down below its 200-day moving average in mid-November, suggesting a new distribution phase for this cryptocurrency play.
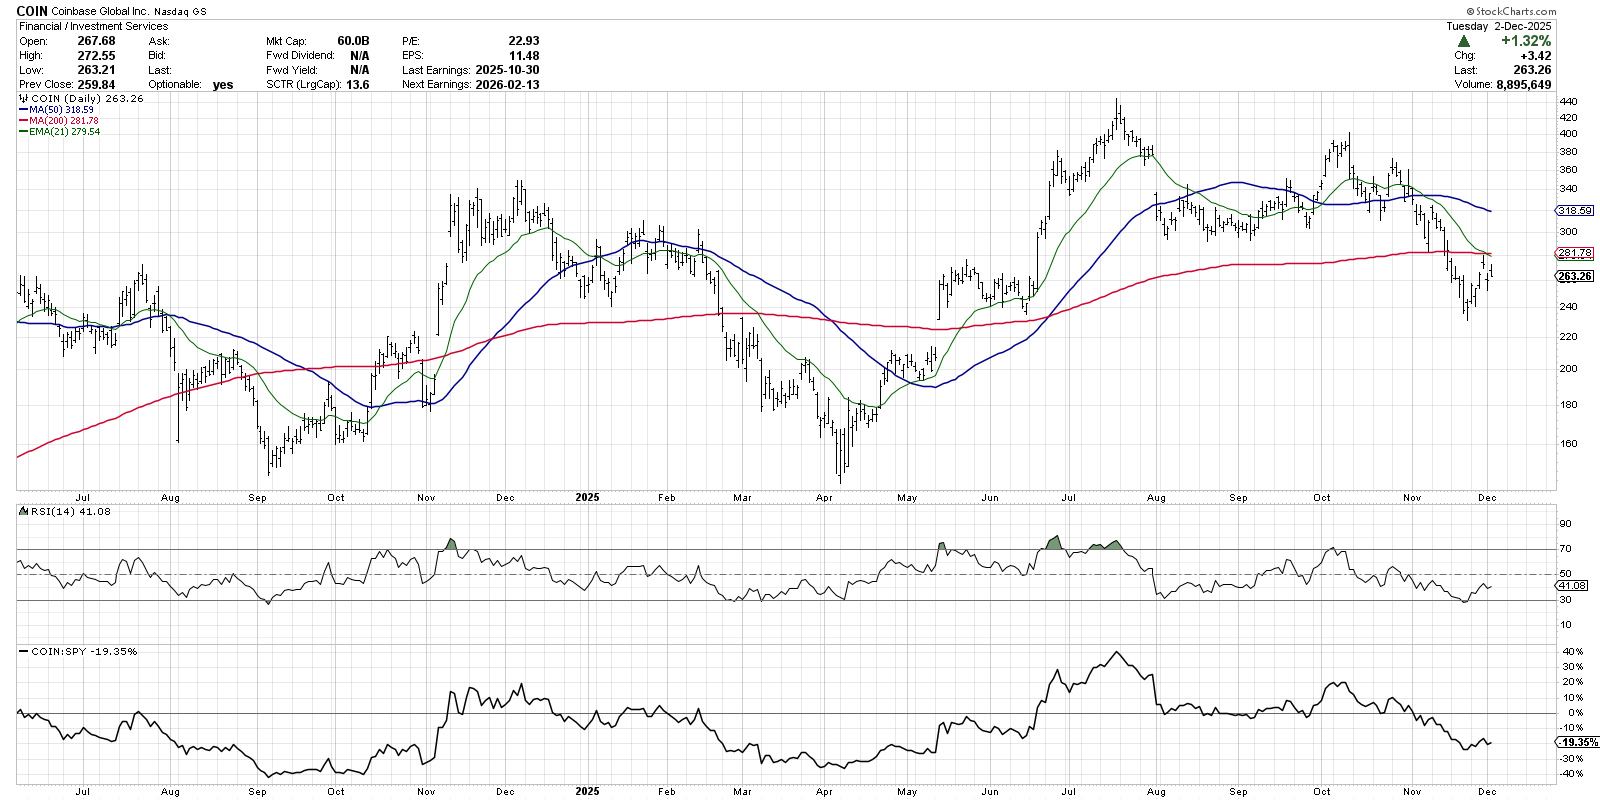
In a sort of inverted version of the chart of COO, Coinbase followed its recent breakdown with a retest of the 200-day moving average from below. If COIN can regain its 200-day moving average, and if that upward surge is fueled by an increase in momentum, then perhaps we could see a return to the mid-300s. However, if COIN would fail to regain this key long-term trend barometer, then my checklist would suggest that the chart should be considered “guilty until proven innocent.”
The Breakout and Recovery Story: HBAN
The chart of regional bank Huntington Bancshares (HBAN) shows what could happen to COIN if the price regains the 200-day moving average. Here we see that the breakdown of the 200-day was followed with the price finding support at the 38.2% Fibonacci retracement level. With that support level serving as a springboard, HBAN has arguably returned to an accumulation phase.
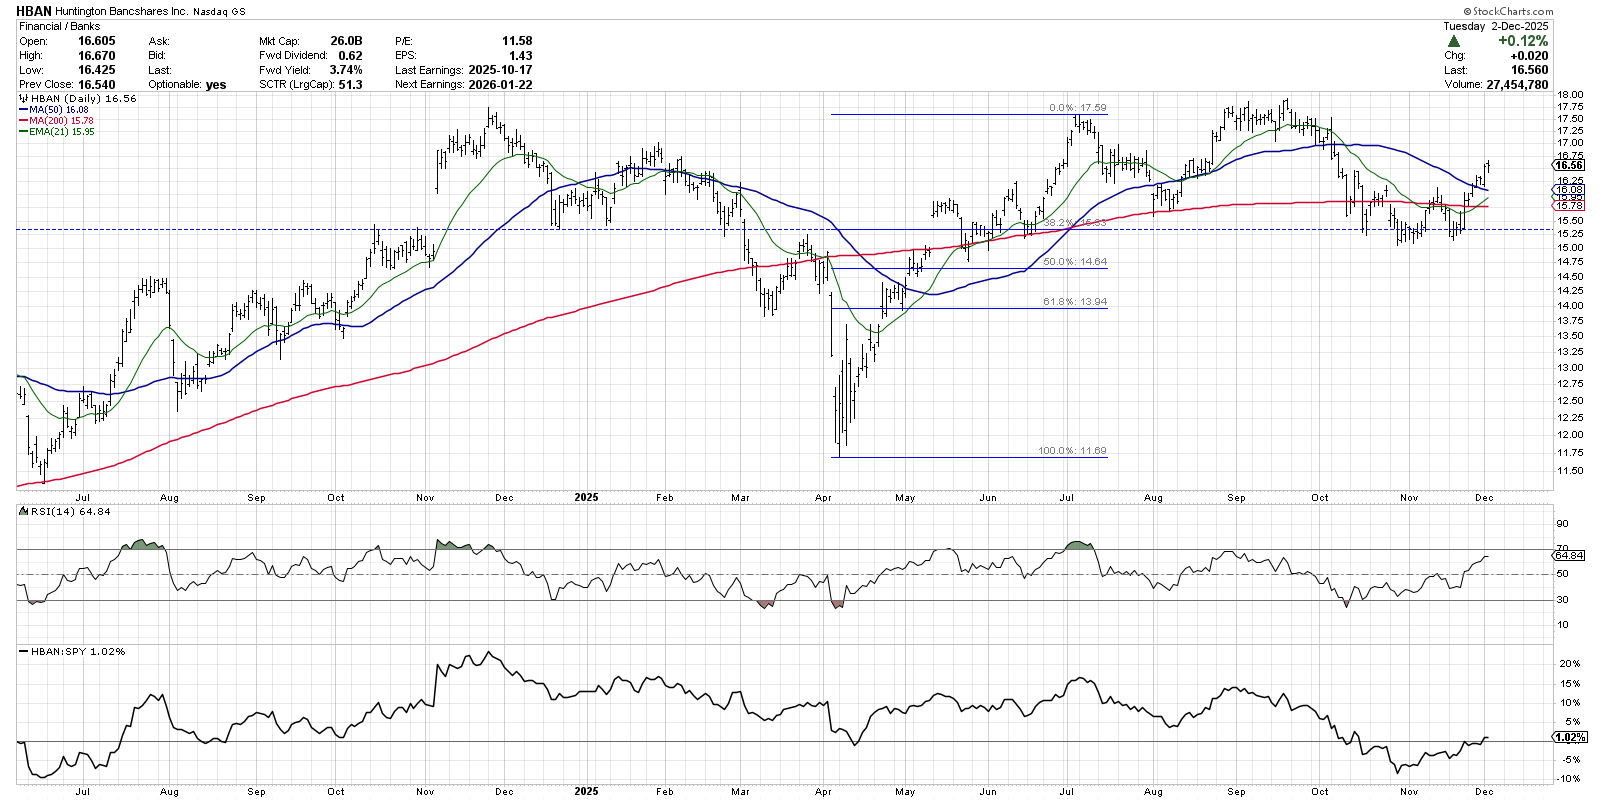
When price breaks below a key moving average, I immediately start searching for new potential support levels on the downside. By setting up a Fibonacci framework using the April low and the July peak, we can identify a 38.2% retracement level around $15.30. Note how the price found support at this Fibonacci level a number of times in October and November.
After settling into a short-term consolidation phase between $15.30 and $16.00, HBAN finally broke above the 200-day and 50-day moving average to clear the trading range. With the daily RSI pushing above the 60 level in recent days, we would consider Huntington to be in a new accumulation phase. And as long as the vital 200-day moving average holds on any future pullbacks, the uptrend phase would be confirmed.
While it can often be quite tempting to overcomplicate our analysis, sometimes simple and straightforward indicators like the 200-day moving average can help paint a pretty clear picture of changing trends and evolving opportunities.
All three of these stocks were featured in my recent video covering my Top Ten Charts to Watch in December. For the other seven stocks and lots of new insights, head over to the StockCharts TV YouTube channel!
RR#6,
Dave
David Keller, CMT
President and Chief Strategist
Sierra Alpha Research LLC
marketmisbehavior.com
https://www.youtube.com/c/MarketMisbehavior
Disclaimer: This blog is for educational purposes only and should not be construed as financial advice. The ideas and strategies should never be used without first assessing your own personal and financial situation, or without consulting a financial professional.
The author does not have a position in mentioned securities at the time of publication. Any opinions expressed herein are solely those of the author and do not in any way represent the views or opinions of any other person or entity.


