Why This Lagging Stock Could Be on the Verge of Exploding

Stocks hit key crossroads all the time, and deciphering which way they'll likely break can be the difference between winning and losing trades. I like to track how stocks trade on an intraday basis relative to the benchmark S&P 500, as I believe this provides us valuable clues as to likely future direction. But we still must see price breakouts or breakdowns to confirm our belief. With that in mind, let's take a look at Salesforce.com (CRM), which has been down trending for months, but has now reached a key pivot point and is showing more bullish signs:
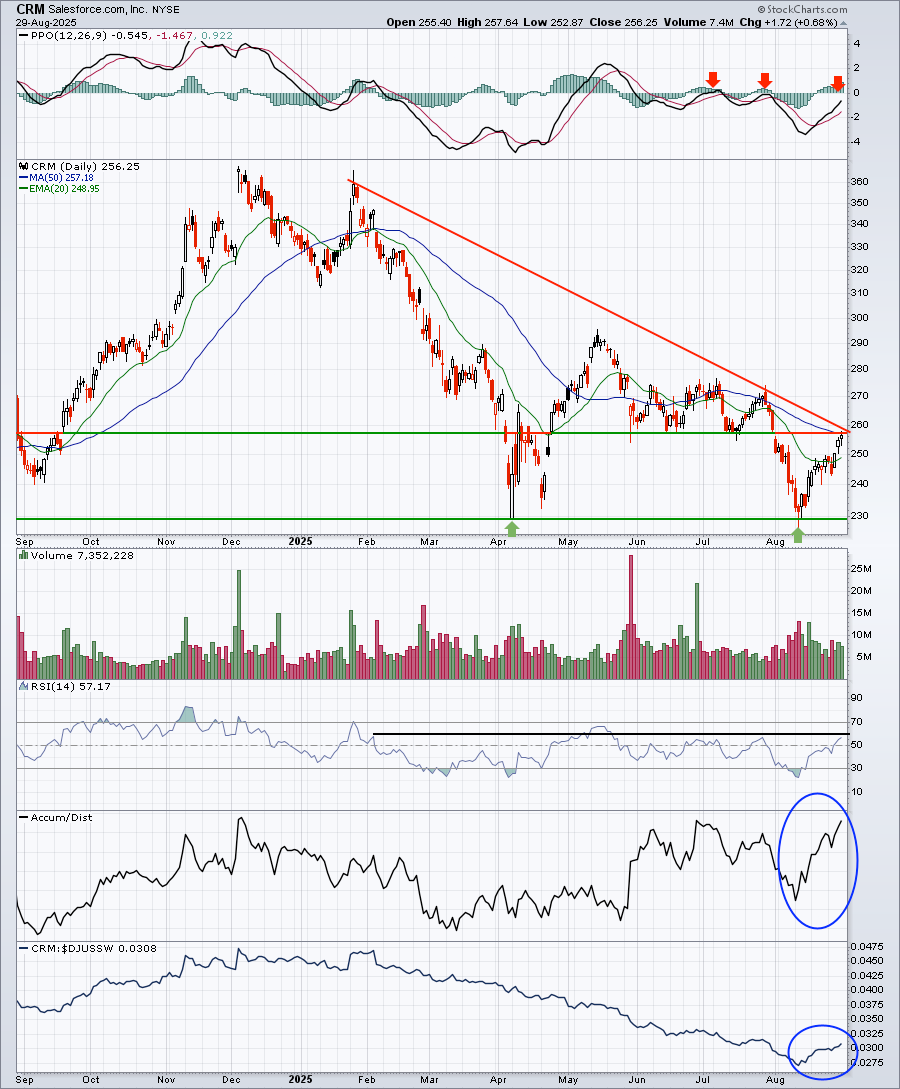
Here are several things to be aware of and/or to look for as a critical test approaches for CRM:
- Short-term price resistance and trendline resistance have now been reached just below 160.
- Volume has accelerated on this latest push higher and towards resistance.
- The AD line is soaring and on the verge of printing a 52-week high, despite price action that's more than 100 points below its 52-week high.
- Key upcoming tests will occur at the PPO centerline and at RSI 60; breaking above both would add to the bullish signals.
On Monday morning, I’ll be providing another stock with intraday clues in our FREE EB Digest newsletter. Simply CLICK HERE to enter your name and email address, and I’ll send it to you on Monday!
Happy trading!
Tom


