Two Currencies May Be About to Go Bullish for Commodities

The Australian and Canadian dollars look like they are about to strengthen big time against their US counterpart. If true, that’s important because these two resource-sensitive currencies have historically moved in tandem with commodity prices.
The Australian Dollar
Chart 1 compares the performance of the Aussie dollar to the CRB Composite over the last 25 years. The six solid arrows identify long-term KST buy signals for the dollar, which have consistently been followed by a rally in the commodity pits. The dashed one in 2014 offers the only false positive. The chart also demonstrates that it has been possible to construct several long-term trendlines for both series. When they have been jointly violated, a major trend reversal has usually followed. The dollar violated its 2021–2024 down trendline last year and is now rangebound. The CRB is right at key resistance at a time when the currency’s KST is in a moderately positive mode.
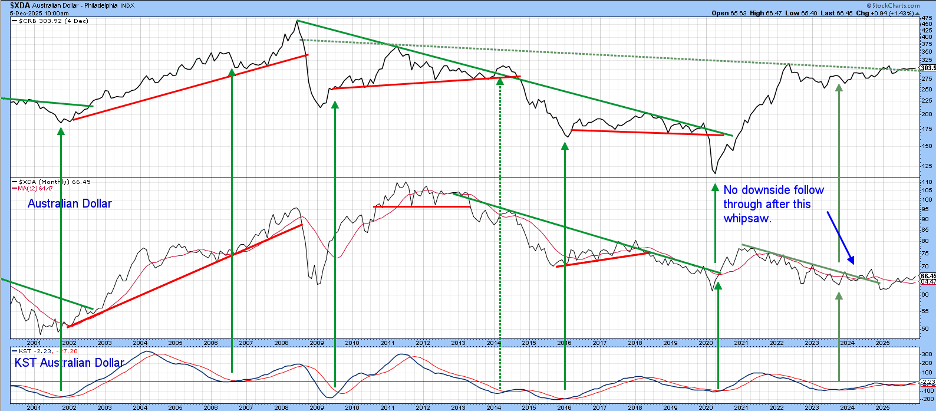
All that’s required is a short-term upward push, which is where Chart 2 comes in.
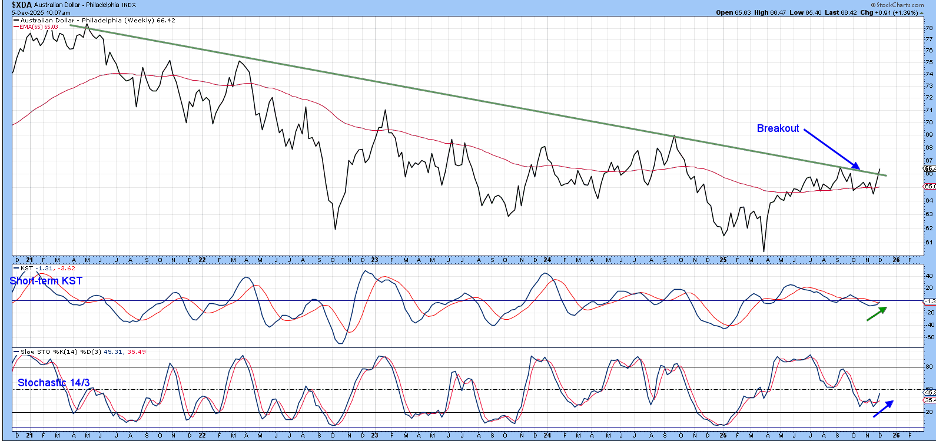
Here we see that the 2021–2025 down trendline, based on weekly data, has just broken to the upside. Since the two momentum indicators are in a positive mode, it seems a small step to conclude that an upside breakout in monthly data, as featured in Chart 1, could well take place in the period directly ahead.
Canadian Dollar
The long-term performance of the Canadian loonie is featured in Chart 3. Once a decade or so, the data lends itself to the construction of a significant trendline, the violation of which has almost always been followed by a significant trend reversal. The latest line, dating from 2012, is still intact.
It's also apparent that the price broke decisively below the red support trendline at the beginning of the year but was unable to hold there for very long. Whipsaw signals of this nature, when confirmed, are usually followed by above-average price moves in the opposite direction to the breakout. Confirmation in this instance would come from a decisive break above that green secular down trendline. The rationale for the strong rally following the false break comes from the fact that sentiment at the time of the break is extremely negative.
The implication is that traders are almost universally positioned for a decline. When prices don’t follow through on the downside, they are forced to quickly get back to the right side of the market. A break above the secular down trendline takes on added significance, therefore, because of the false downside break.
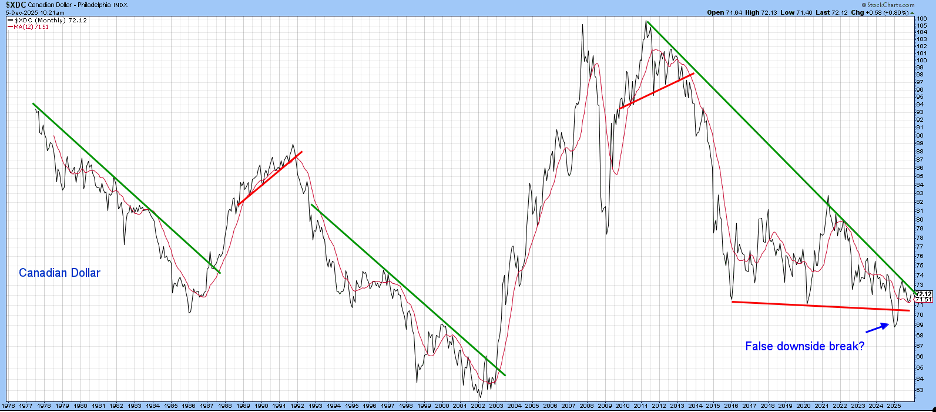
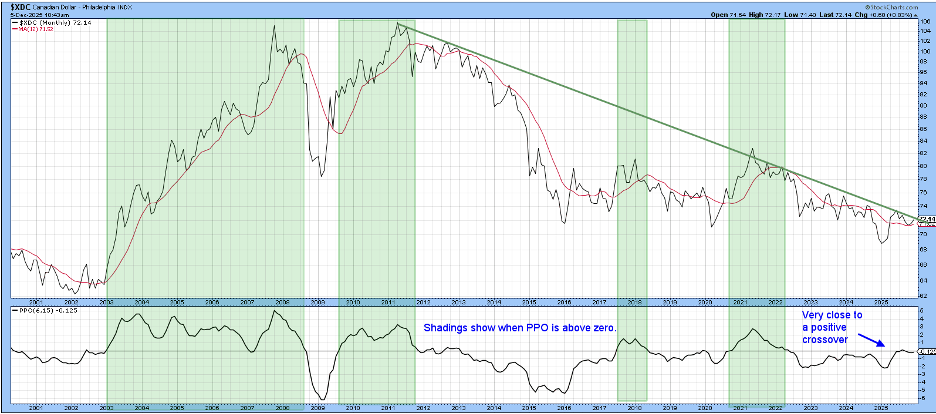
Chart 4 tells us that the long-term technical balance between buyers and sellers is evenly matched. That’s because the Percentage Price Oscillator (PPO), using the 6- and 15-month parameters, has been flat for the last few months. The green shadings approximate periods when it rallies above zero. The PPO is only slightly below that equilibrium point at present. Consequently, it would not take much to generate a bullish signal.
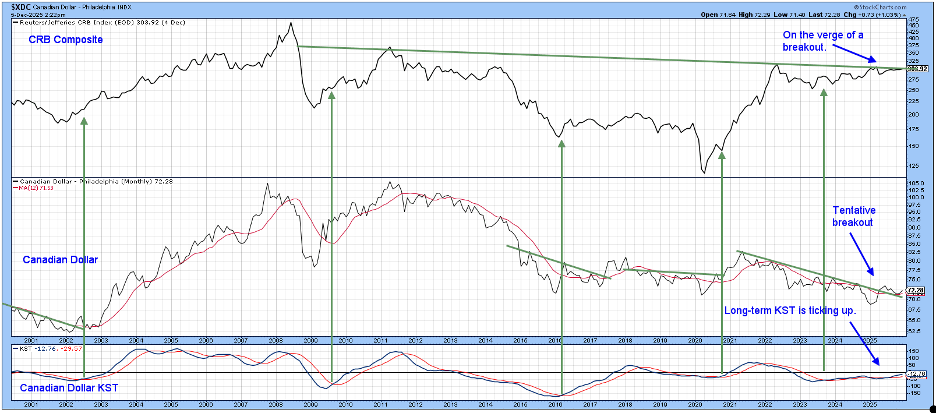
That’s important because Chart 5 makes plain the connection between the Canadian dollar and the CRB Composite. Like its Australian counterpart, it too is on a KST buy signal. Note that the most recent down trendline for the currency has already been violated. That for the CRB itself is probably not far behind.
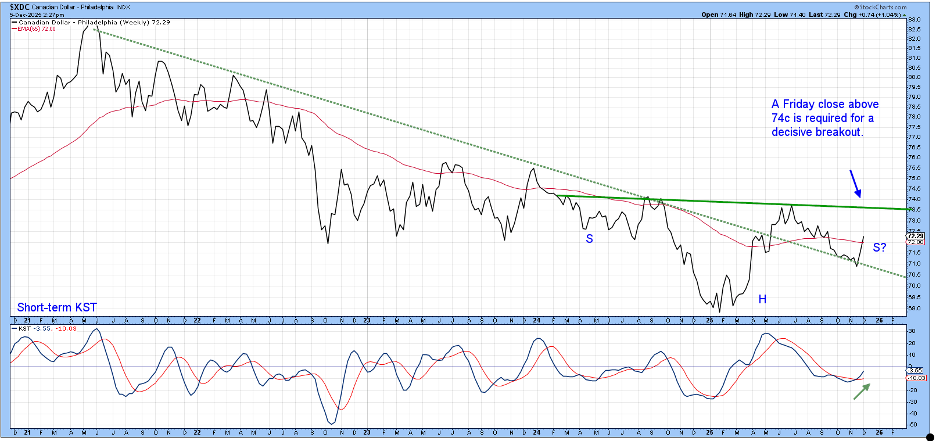
The equivalent weekly trendline to that plotted in Chart 5 appears in Chart 6, this time in a dashed format. It was violated earlier in the year; the dollar successfully tested its extension only recently. Since the short-term KST has gone bullish, it seems likely that at least a test of the neckline of the potential reverse head-and-shoulders is about to happen.
Good luck and good charting,
Martin J. Pring
The views expressed in this article are those of the author and do not necessarily reflect the position or opinion of Pring Turner Capital Group of Walnut Creek or its affiliates.


