Unveiling the Factors Behind a Potential Energy Surge

The PerfChart below reminds us that energy (in red) has been a real laggard in the last 200 days. However, a review of the latest charts suggests that it may be about to play catch-up.
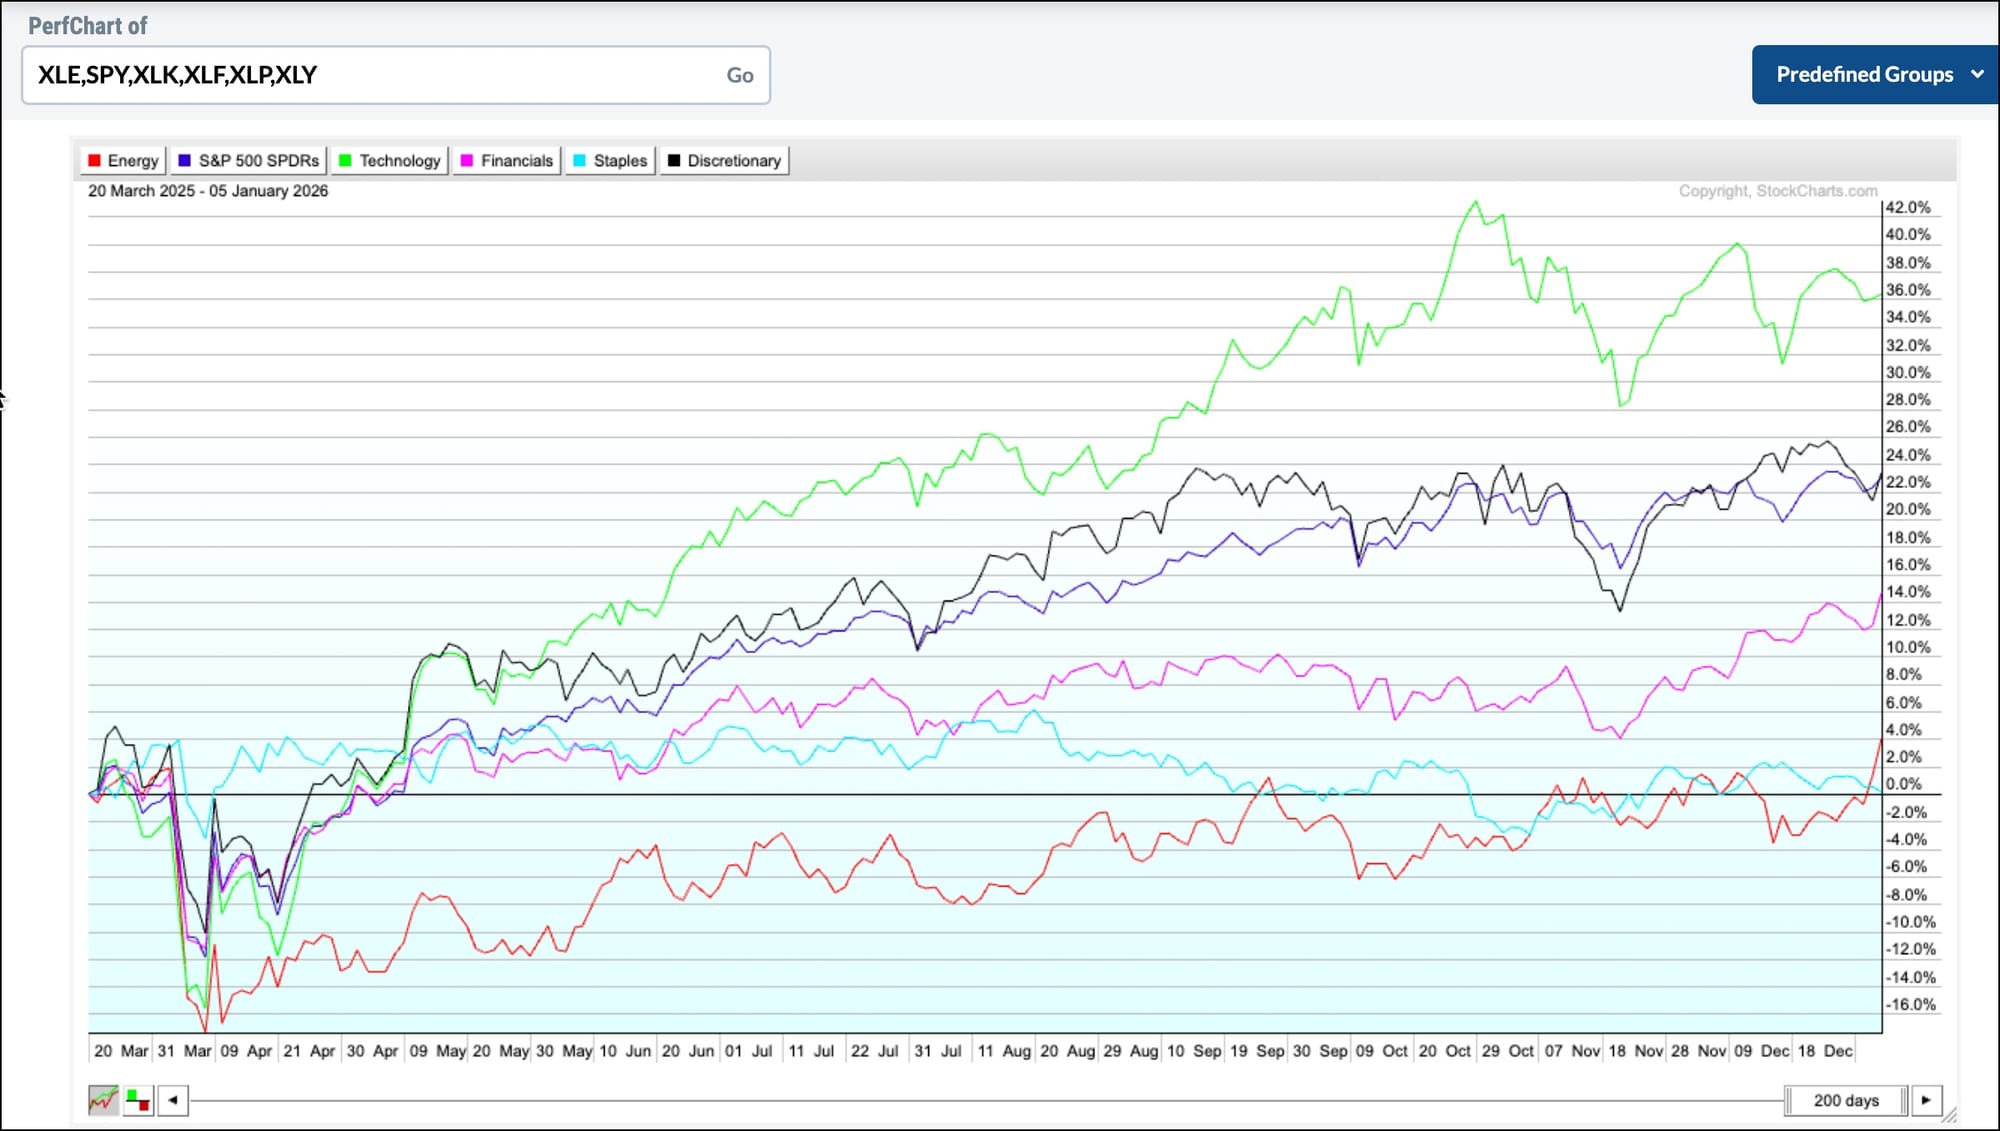
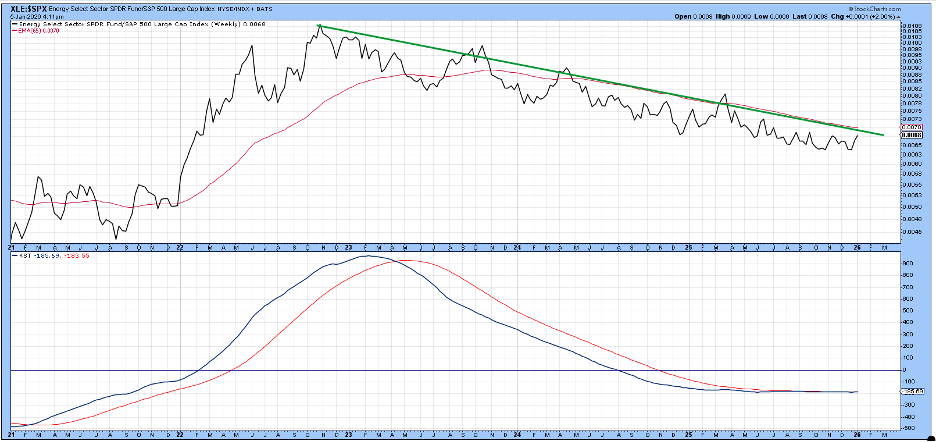
Chart 1, for instance, shows that the SPDR Energy ETF (XLE) has broken out from a two-year consolidation pattern. It’s also supported by the oscillator in the lower window monitoring the percentage of energy stocks trading above their 200-day EMA. That indicator has just reversed to the upside from a moderately oversold reading. The vertical lines isolate overstretched upside reversals since 2006. Two of them fall under the label “false positive,” but the remaining six were followed by a worthwhile rally. A nice advance from the latest signal has already taken place. More to the point, the indicator is still in neutral territory and not in the least bit overstretched.
One caveat: this is a monthly chart. The final plot and breakout status will not be known until the end of January. That said, other charts and indicators, which I will get to later, suggest the break will still be intact at the month-end close.
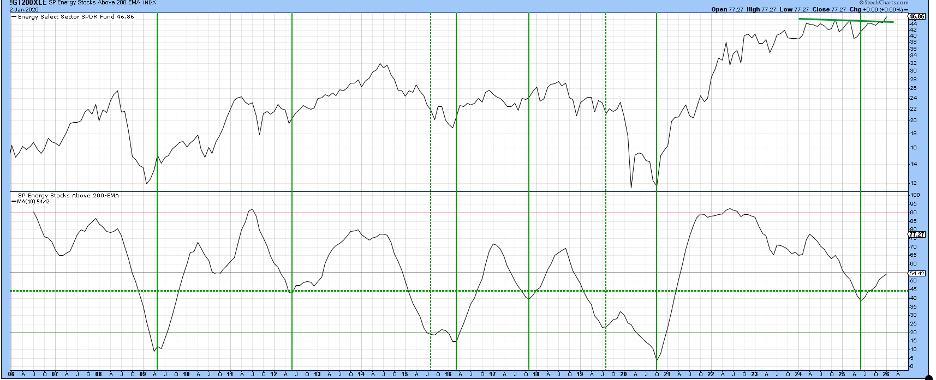
Chart 2 features daily data, which also reveals an upside break. The oscillator, reflecting the percentage of energy stocks above their 20-day EMAs, has just reversed from an oversold position below the green horizontal dashed line. The two dashed vertical lines identify disappointing signals, but the 11 remaining ones were followed by rallies lasting at least four weeks, which would be sufficiently long-lasting to maintain the breakout in Chart 1.
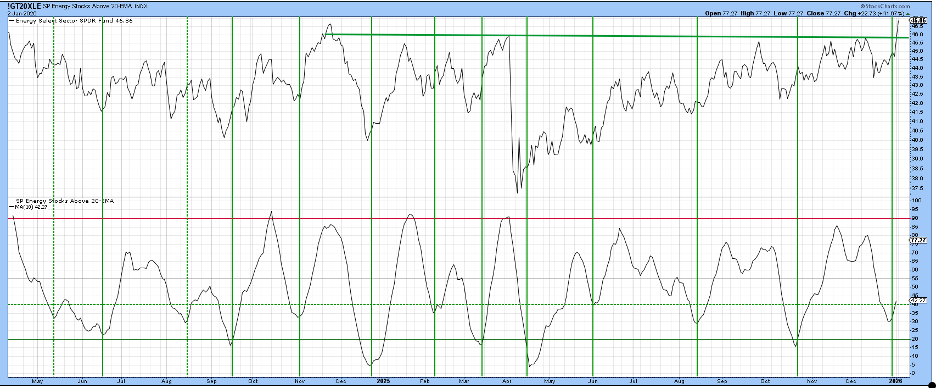
Chart 3 features the absolute price and its daily KST in the upper two windows. Relative action and the relative KST appear in the lower ones. Two takeaways are the breakout in the price and the violation of a nine-month down trendline in relative action. Both momentum series are on the verge of a buy signal and will go bullish unless the breakout unexpectedly fails.
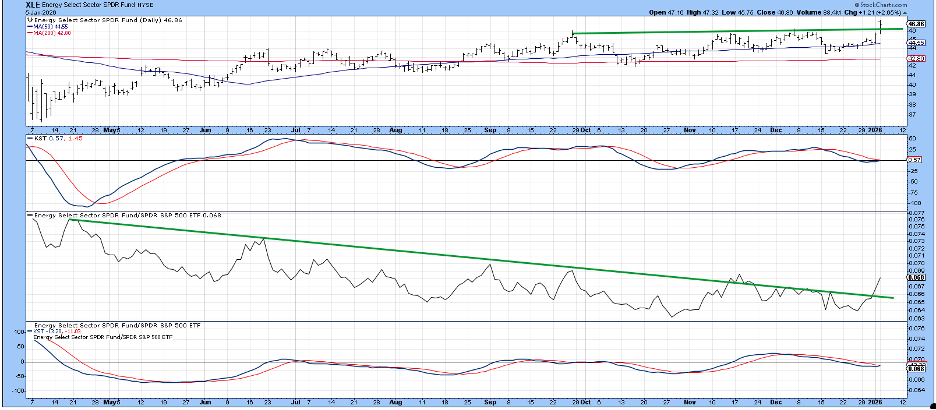
Chart 4 shows that the recent downtrend in relative action is part of a much larger trend dating from late 2022. Its long-term KST in the lower panel has gone completely flat since the beginning of 2025. That tells us the technical structure is extremely finely balanced, and whichever way it is resolved is likely to be followed by a strong and lengthy move, most probably to the upside.
Energy stocks are going nowhere unless supported by higher energy prices to which they are linked. The relationship between crude oil and energy shares is not as close as gold shares are to gold, but it’s still very much coupled over the long haul.
The price of crude, which is featured in Chart 5, looks very much as if it has broken down from a four-year top. The gently rising short-term KST offers some hope for the bulls, but it’s really difficult to make a bullish case unless or until the price breaks above the two trendlines and 65-week EMA at $67.50.
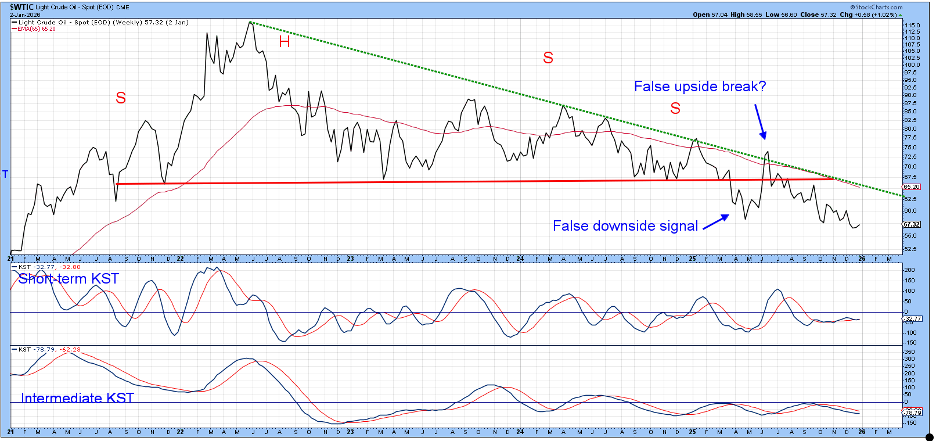
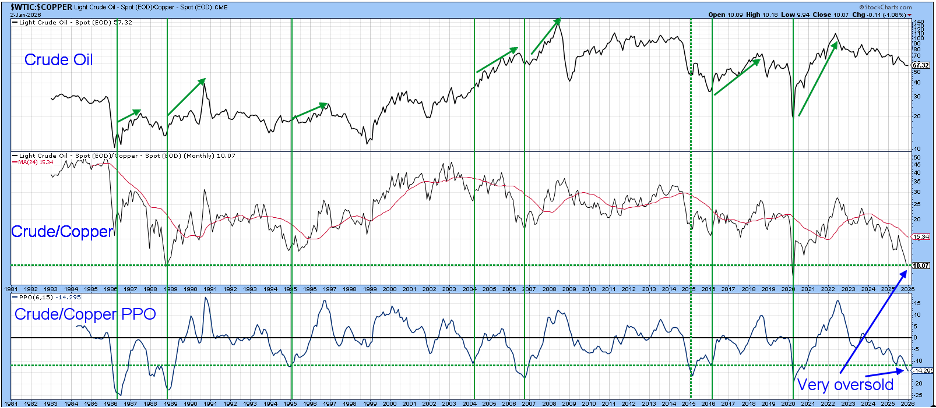
Chart 6 tells us a turn may be close at hand. A couple of weeks ago, I pointed out that a typical business cycle experiences a chronological sequence whereby the price of copper leads crude oil at major lows. The reason is that copper, being used in construction, electrical equipment, and appliances, etc., responds to early-cycle re-stocking and bottoms ahead of oil. Oil consumption is dominated by transportation, air travel, petrochemicals, and broader consumer activity and, therefore, is more sensitive to late-cycle demand.
The chart also indicates that when the crude/copper ratio moves to an extreme and reverses, a huge oil advance usually follows. In that respect, the vertical lines flag oversold reversals in the ratio’s PPO and the green arrows, the subsequent crude rally. The oscillator is still declining and has not yet generated a signal. However, the elastic is so overstretched now that a rebound is likely to occur at any time. When it does, the bull case for crude and energy shares will be that much stronger.
Good luck and good charting,
Martin J. Pring
The views expressed in this article are those of the author and do not necessarily reflect the position or opinion of Pring Turner Capital Group of Walnut Creek or its affiliates.


