U.S. Dollar: The 100–101 Zone Is the Pivot Between Bull and Bear
In 2025, the U.S. Dollar Index ($USD) sold off sharply, pushing most commentators firmly into the bearish camp and prompting dire predictions of further weakness. While most of my primary trend models remain bearish, it would take only a modest amount of additional strength from current levels to flip the balance back to a bullish configuration.
The Long-Term Technical Position
Chart 1 helps frame the situation. The green‑shaded zones highlight periods when the Percentage Price Oscillator (PPO), using 6‑ and 15‑month parameters, is above zero, a condition that has historically defined a constructive environment for the dollar. A positive PPO reading has also allowed the Index to sidestep most major declines over the past 25 years. At present, the indicator is still negative, but it appears to be closing in on a potential upside crossover.
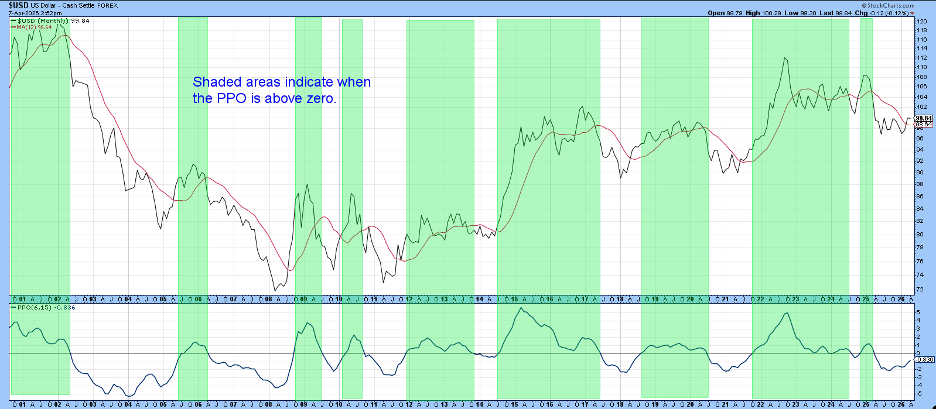
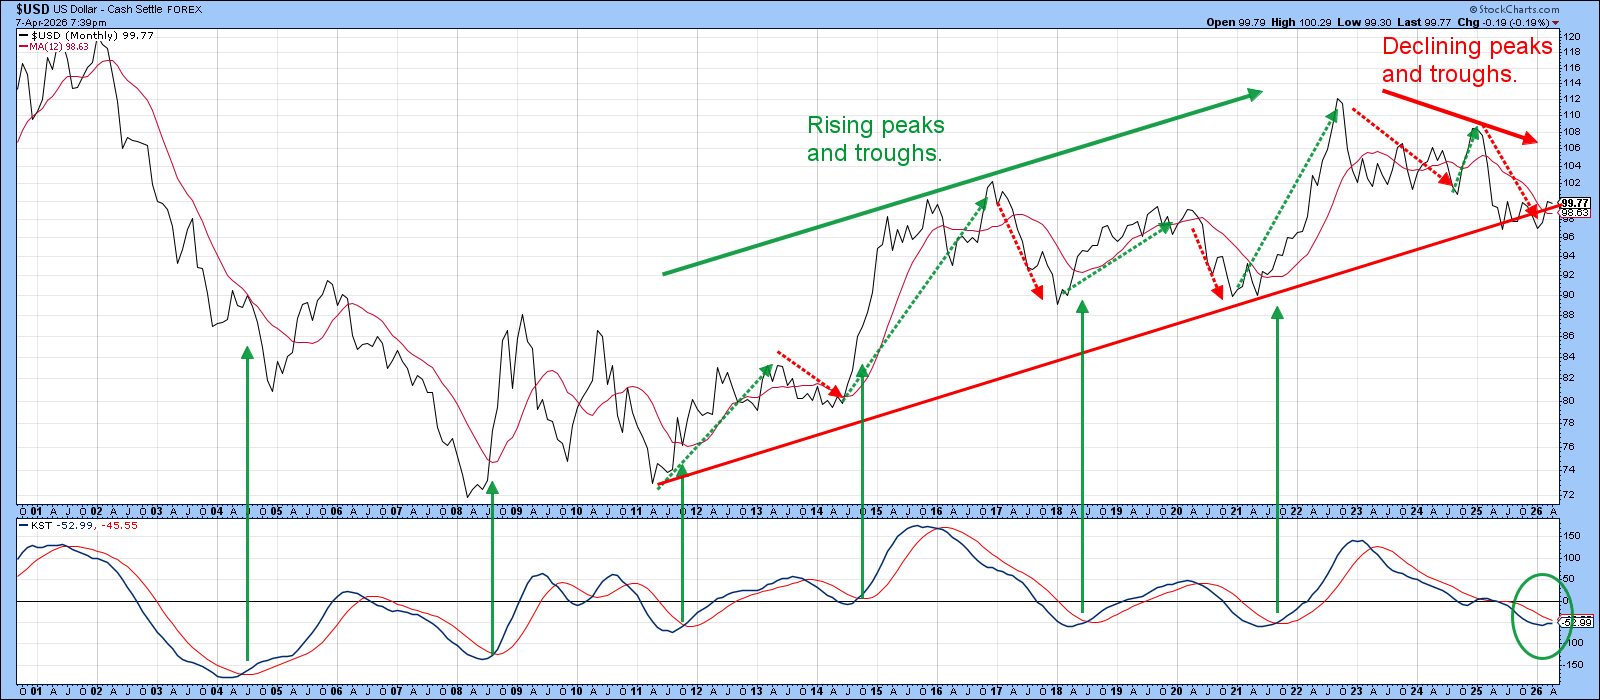
Chart 2 remains in a bearish configuration, but it is also beginning to show early signs of potential improvement. The long‑term Know Sure Thing (KST) has started to turn higher, though not enough to trigger a positive crossover of its nine‑month moving average. Price is holding above its 12‑month MA, yet it has not been able to break out of the 2025–26 trading range.
The dashed arrows highlight an important structural point. Between 2011 and 2022, the Index carved out a series of rising peaks and troughs. Since then, however, it has posted a lower peak in late 2024 and a lower trough last year. That pattern keeps the post‑2022 downtrend intact and represents a clear piece of negative evidence. Even so, an upside break above the recent trading range would be enough to prevent a decisive violation of the red post‑2011 secular uptrend line.
A closer look at the shorter‑term indicators suggests that the 100–101 area is not only a critical level but one that may soon face a meaningful challenge.
Shorter-Term Indicators
Chart 3 underscores that recent price action can be divided into two distinct phases. Before April of last year, the Index was confined to a trading range while holding above the red trendline. Since then, the green segment of that same trendline has acted as a persistent barrier to upside progress. The 65‑week EMA has been tracking in the same general area. Although the Index currently sits slightly above the EMA, the penetration is far from decisive, particularly as price is pressing directly into that green resistance line.
Two additional observations stand out. First, the long‑term KST calculated from weekly data is more sensitive than the monthly version shown in the prior chart, and it has turned marginally bullish. Second, the short‑term KST is already in a bullish mode, suggesting that conditions are as favorable as any in recent months for an upside breakout attempt.
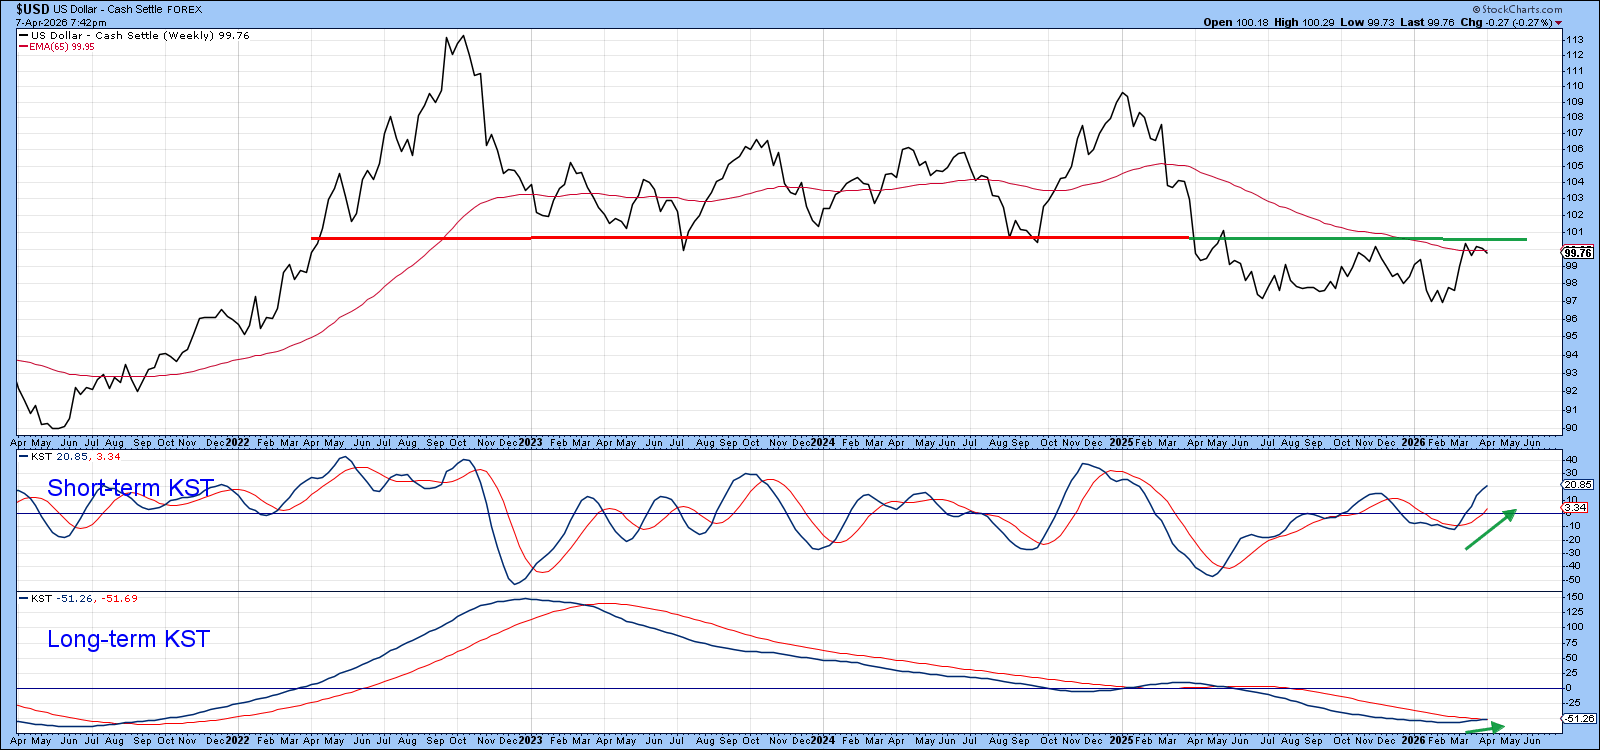
Chart 4 tracks the percentage of a basket of cross‑dollar relationships that are currently in positive trends. Because it’s based on monthly data, the indicator tends to generate reliable breadth‑momentum buy signals when it bottoms at or below the green oversold line. The solid vertical lines show that these signals have maintained a remarkably consistent record of identifying dollar rallies since the early 2000s. That the indicator has only just triggered a fresh signal is, in my view, an encouraging development.
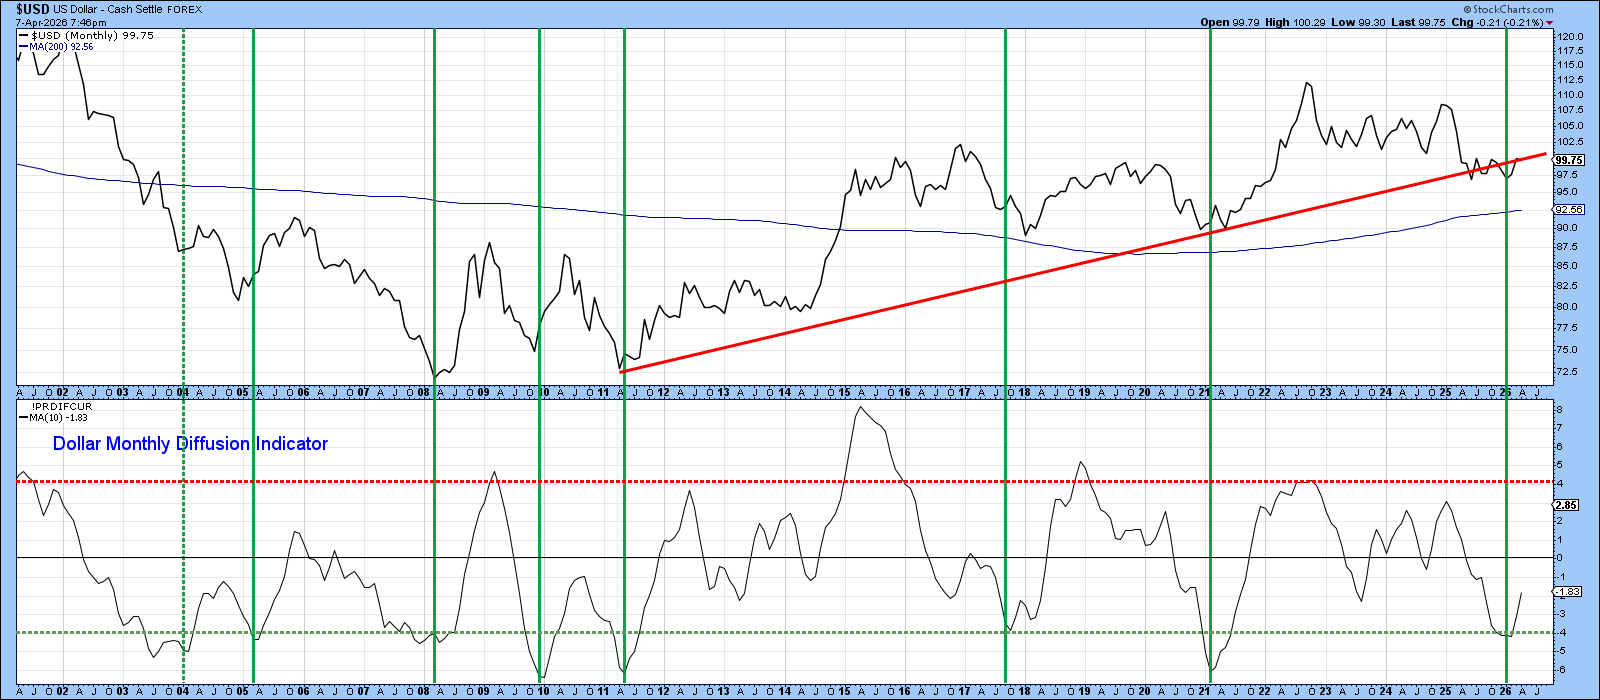
Chart 5 highlights a weekly slowed stochastic. The green dashed arrows mark multiple instances where it diverged positively from the Index, with confirmation arriving once the price broke above a corresponding green resistance trendline. The same dynamic appears to be unfolding again: this momentum indicator has been diverging positively since early 2025.
In the current situation, confirmation would come from a decisive weekly close above the blue dashed resistance trendline, which sits in the 100.2–100.5 zone.
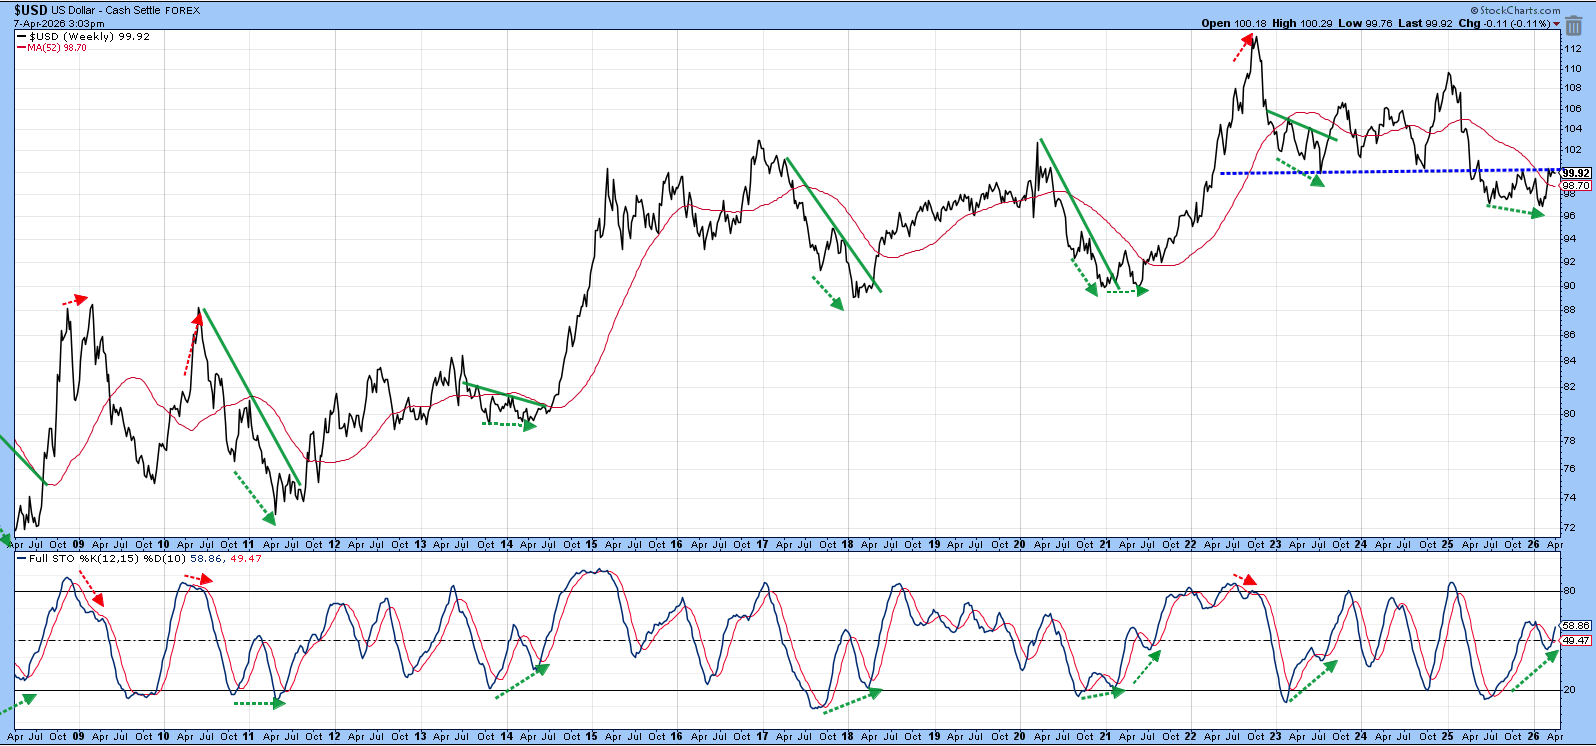
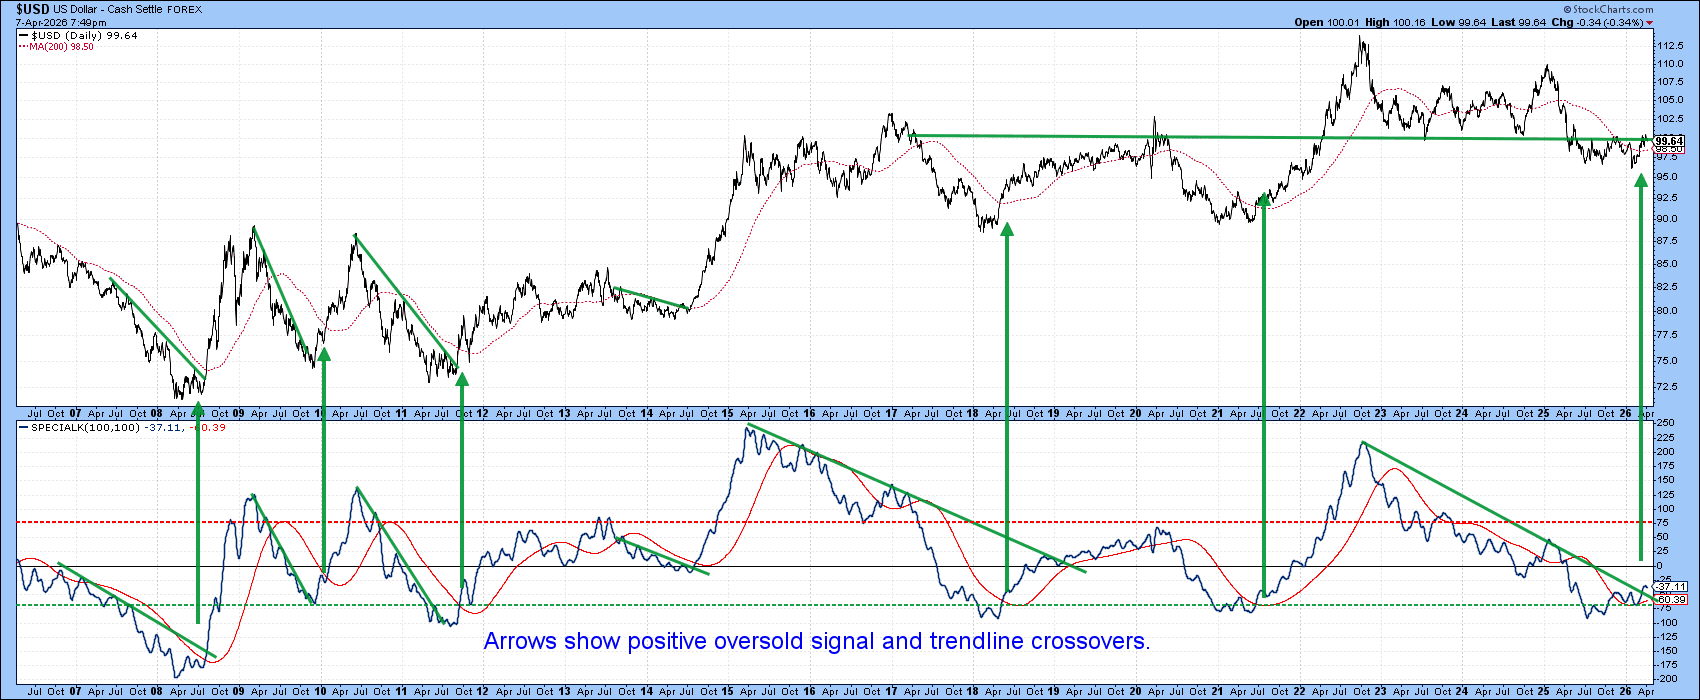
Chart 6, which features the Special K, shows that this long‑term momentum indicator has recently crossed above its signal line and bear‑market trendline. Because this upside break has occurred from an oversold reading, it has the potential to qualify as the sixth such signal since the financial crisis, provided it’s confirmed by a decisive move above the green resistance trendline just north of the 100 level.
Bottom Line
The long‑term indicators remain marginally bearish, but the more sensitive measures are positioned to improve. If they follow through, they could reverse what is currently a narrow, yet still negative, balance in the dollar’s primary trend profile.
Good luck and good charting,
Martin J. Pring
The views expressed in this article are those of the author and do not necessarily reflect the position or opinion of Pring Turner Capital Group of Walnut Creek or its affiliates. The Six Stages of the Business Cycle are followed each month in Martin Pring’s Intermarket Review.