The US Dollar Index Hits a Critical Crossroad: Will It Reverse or Rally?

The last time I wrote about the dollar was back in July under the title "The Dollar Index Just Gave a Major Sell Signal - Does That Mean It's About to Implode?" I concluded that while the consensus of long-term indicators had turned bearish, sentiment among analysts and traders was sufficiently negative to limit downside potential, and that even the potential for a limited counter-cyclical rally was a possibility. “When the consensus is negative, as it is now, and the question is no longer whether the dollar will decline but when and by how much, it is usually time to look in the opposite direction, even for a temporary period.”
I bring that up because the technical position has since improved, not to the point where a bull market signal is in the bag, but where a decent rally foreshadowing one is a far more realistic possibility than it was last summer. In short, the dollar has reached an important crossroad.
The green-shaded areas in Chart 1 (below) approximate periods when the long-term KST is above its moving average and the unshaded ones when below. It has been in a bearish, unshaded mode since 2023.
US Dollar Index Hits Resistance
Earlier this year, the US Dollar Index ($USD) broke down from an important trading range. After the initial drop, it experienced a normal retracement move back to the extended red breakdown trendline. The point to bear in mind is that the subsequent decline should have pushed it decisively under that initial low in true bear market fashion. Instead, $USD held above it and has now rallied back to the red trendline, which now represents an important crossroad.
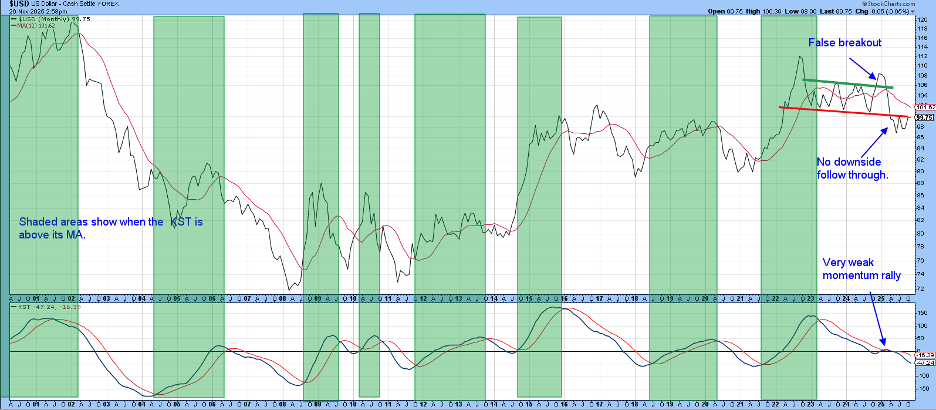
Chart 2 compares $USD to a Percentage Price Oscillator (PPO) using the 6- and 15-month parameters. The green-shaded areas indicate when the oscillator is above zero. This technique is not perfect, but it does capture most of the major moves from the turn of the century. Right now, it is bearish because the oscillator is trading well under its equilibrium level. That’s important because $USD itself is still threatening to violate the post-2011 secular uptrendline.
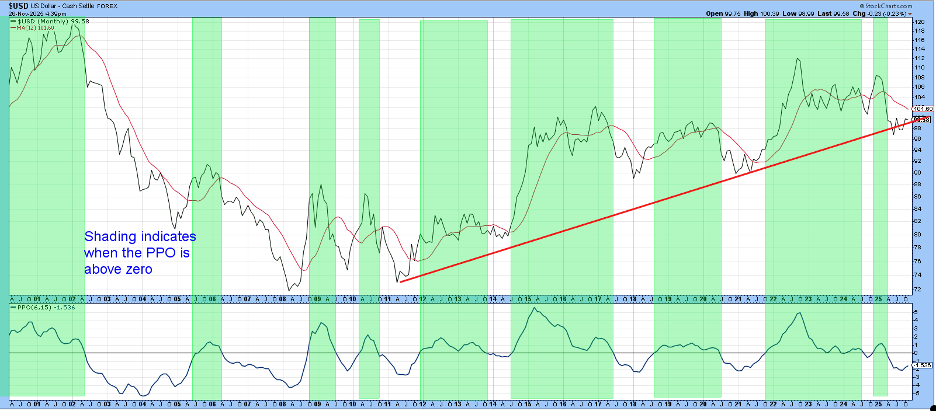
Chart 3 takes this a step further by pointing out that upside reversals in the PPO from at or below the oversold dashed-green horizontal line have usually been followed by a worthwhile rally. These instances have been identified by the vertical green lines. The two dashed ones keep us honest, as they represent false positives. The horizontal green line demonstrates the area around 100 as a pivotal point for both rallies and reactions. Since the PPO has only recently turned up, it seems likely that a positive penetration of that resistance around 100 is doable.
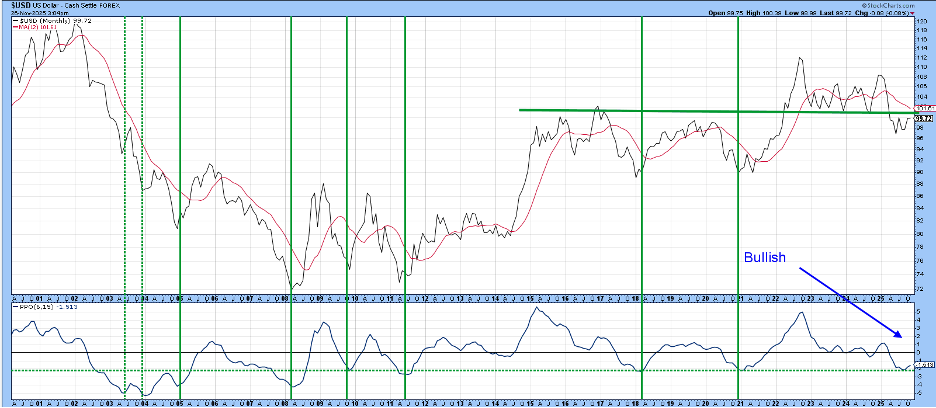
Chart 4, using daily data, features an indicator monitoring numerous dollar cross rates in a bullish trend. The vertical lines once again approximate points when it bottoms out from a subzero position. The solid lines indicate when these momentum reversals were followed by a higher dollar. The dashed ones once again remind us that it is not perfect. Right now, $USD is attempting to surpass the red trendline and 200-day MA. Since the diffusion indicator is in a positive mode, the odds favor it succeeding.
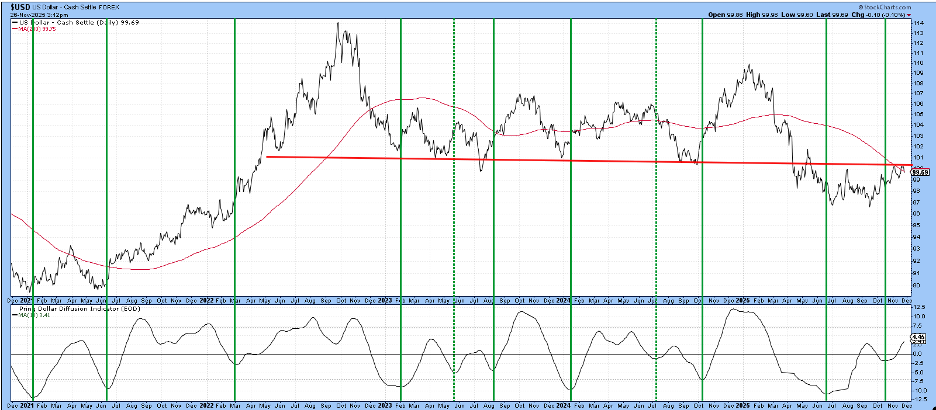
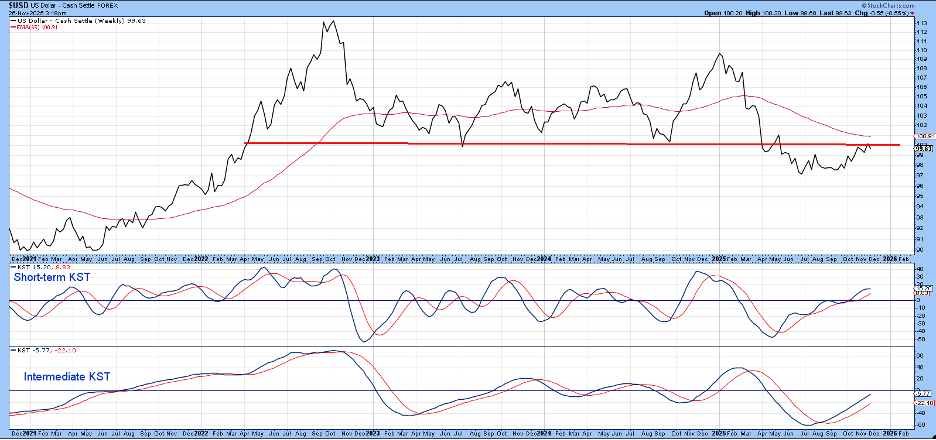
Chart 5 again displays resistance; this time, it is based on Friday closes. Since the short- and intermediate-term KSTs are in a positive mode, it seems likely that this improving momentum will be sufficient to result in a breakout.
The Bottom Line
Our KST and PPO models remain in a bearish mode for the US Dollar Index. From a bullish aspect, the lack of any serious downside follow-through is an encouraging factor. More to the point, there are sufficient grounds for expecting the recent rally will extend sufficiently to surpass significant resistance at 100. That would not necessarily cancel the bearish primary trend signals triggered earlier in the year. However, it could be sufficient to place the technical picture within striking distance of a dollar bull market.
Good luck and good charting,
Martin J. Pring
The views expressed in this article are those of the author and do not necessarily reflect the position or opinion of Pring Turner Capital Group of Walnut Creek or its affiliates.


