Turn Your Stock Watchlist Into Winners With This Chart Tool

Key Takeaways
- A stock or ETF with a high SCTR score often signals strong technical momentum.
- Watching trend-following indicators, like moving averages, together with the SCTR score gives added confidence in whether an uptrend is likely to continue.
- Using the SCTR Reports panel and pre-built scans can help you to find new stocks showing strength.
We’ve all been there. You’re watching a stock, thinking about buying it, and then, boom! The price starts rising, your heart starts racing, and you’re scrambling, drawing trendlines, checking retracements, and throwing a bunch of indicators onto the chart so you can time that perfect entry.
That's when it happens: analysis paralysis. Instead of hitting the place order button on your brokerage account, you freeze. Your head is now filled with reasons not to buy the stock and, before you know it, the stock has run away without you.
An Example: OKLO
Take Oklo, Inc. (OKLO) as an example. Back in mid-October 2024, the stock was trading at around $10. By September 2025, the stock soared to about $140.
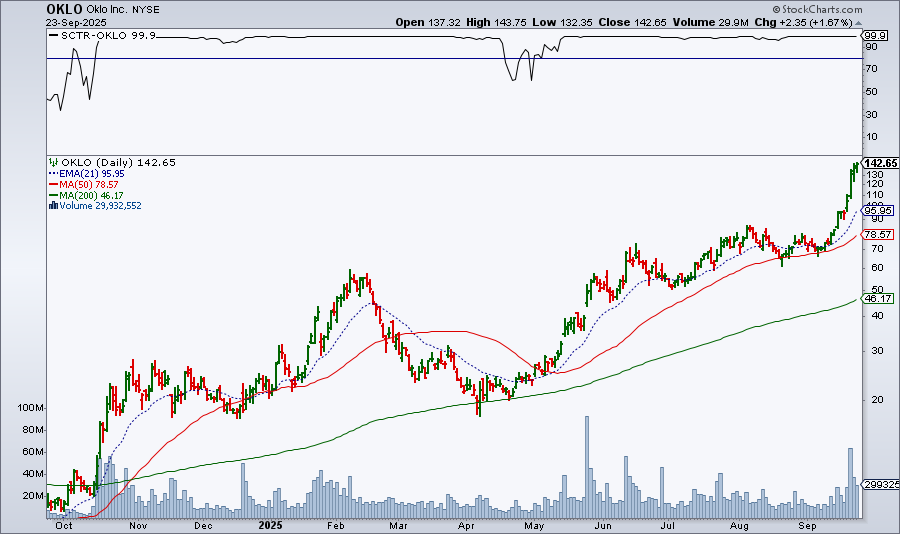
If you’d been keeping an eye on the StockCharts Technical Rank (SCTR) score, either on OKLO’s chart or the SCTR Score panel on your Dashboard, you may have noticed something important. Since mid-October 2024, OKLO’s SCTR score has stayed above 80 most of the time, with a short dip in spring 2025 (the 80 threshold is a personal preference of mine, but feel free to use another threshold level that you’re more comfortable using). This dip was an opportunity for investors to open a long position in OKLO. The SCTR score rose above 80, and the 21-day Exponential Moving Average (EMA) crossed above the 50-day simple moving average (SMA) in early May. This gives you a strong technical case for opening the trade.
If you caught the move, congratulations! If not, don’t worry. OKLO isn’t the only stock out there that’s showing this kind of strength.
Where to Find Strong SCTRs
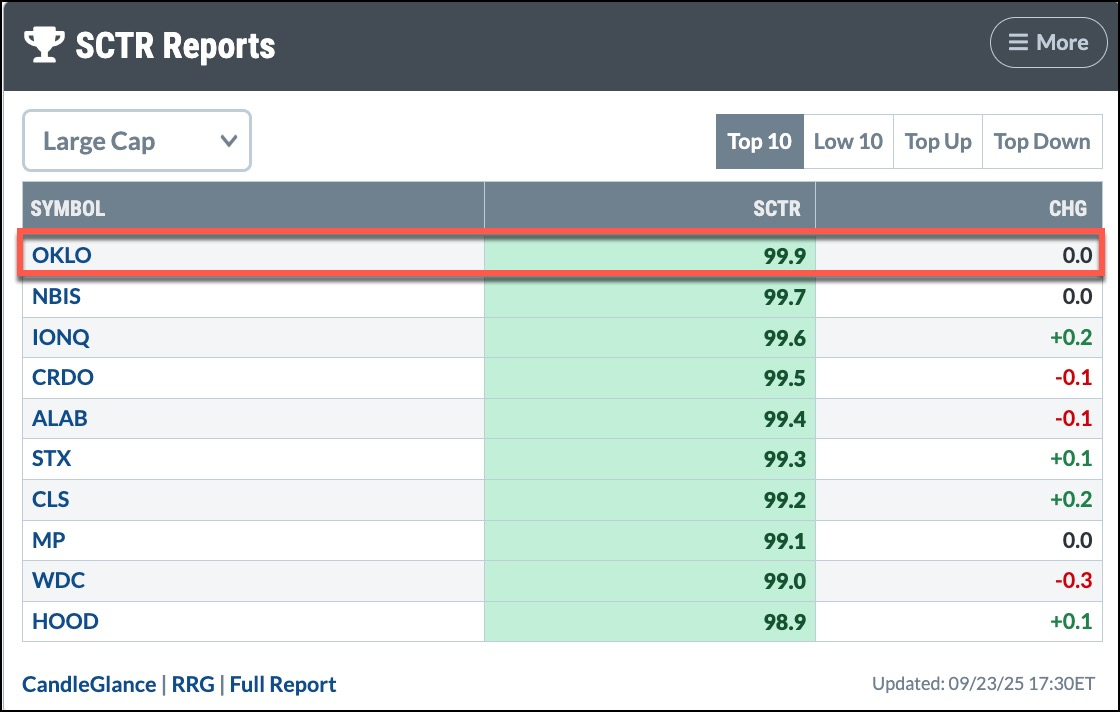
Here’s the good news: the SCTR Reports panel on your StockCharts Dashboard highlights the top 10 stocks from different categories.
If you want to level up, you can run scans right from the Sample Scan Library. These scans are pre-built, which means no coding skills are required. You’ll find a few on the list that focus on SCTR stocks.
Say you ran the Strong SCTRs In Technology Sector, created by David Keller, CMT. When I ran this scan recently, one of the names that popped up was Affirm Holdings, Inc. (AFRM).
AFRM in Focus
A key part of any technical analyst’s routine is, of course, to analyze a chart. And AFRM has a pretty interesting chart, displaying a classic uptrend.
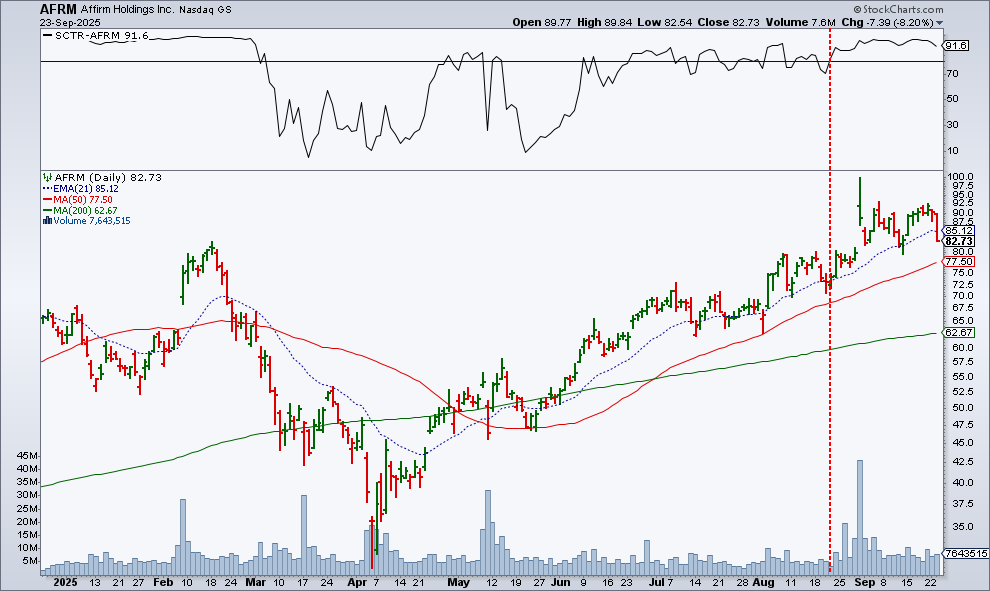
Here’s what AFRM’s chart displays:
- After bottoming in early April, AFRM started trending higher.
- By late May, the uptrend looked strong, confirmed by a move above its 21-day EMA.
- AFRM's SCTR score started rising but then oscillated, going above and below the 80 level between June 24 and August 21.
Things changed in late August. On August 21, AFRM’s SCTR score crossed above 80 (August 21, 2025), and the stock held the support of its 21-day EMA. Since then, despite the mid-September pullback, the SCTR has stayed strong above 80.
Note that AFRM has now pulled back and closed below its 21-day EMA, though the SCTR is well above 80. What’s next? That’s where you watch the SCTR line closely. A break below 80 could present a buy-the-dip opportunity.
The Bottom Line
When the market feels toppy, it can be tough to find stocks that have the juice to run higher. So keep your eyes peeled on the SCTR score panel on your Dashboard and run some scans from the Sample Scan Library. Next time you see a stock that is trending higher with a rising SCTR score, you can confidently hit that buy button. Just be sure to set your exit levels so that, if things go awry, you know when to hit the sell button.
Disclaimer: This blog is for educational purposes only and should not be construed as financial advice. The ideas and strategies should never be used without first assessing your own personal and financial situation, or without consulting a financial professional.


