Using Trend Signals and Oversold Conditions to Get a Jump on the Breakout
Looking to get a jump on a breakout? During long-term uptrends, short-term oversold conditions present opportunities to trade in the direction of the prevailing uptrend, which is the dominant force at work. Today, we will show how to identify the long-term uptrend using the Trend Composite and find oversold setups using the Momentum Composite.
Key Takeaways
- Transports ETF extends its uptrend with a breakout
- Oversold conditions can be used to get a discount
- CSX forming a bullish continuation pattern
- Look for oversold conditions and short-term bullish continuation patterns to get a jump on the breakout
Transports ETF Extends Uptrend with Breakout
The Transports ETF (IYT) formed a bullish continuation pattern from July to November and broke out with a strong advance the last three weeks. As implied in the description, a bullish continuation pattern forms within an existing uptrend. IYT was clearly in an uptrend, as the Trend Composite turned positive at the beginning of July (blue dashed line). Positive values mean the majority of indicators are bullish. The Trend Composite aggregates signals in five trend-following indicators and is part of the TrendInvestorPro Indicator Edge plugin for StockCharts ACP.
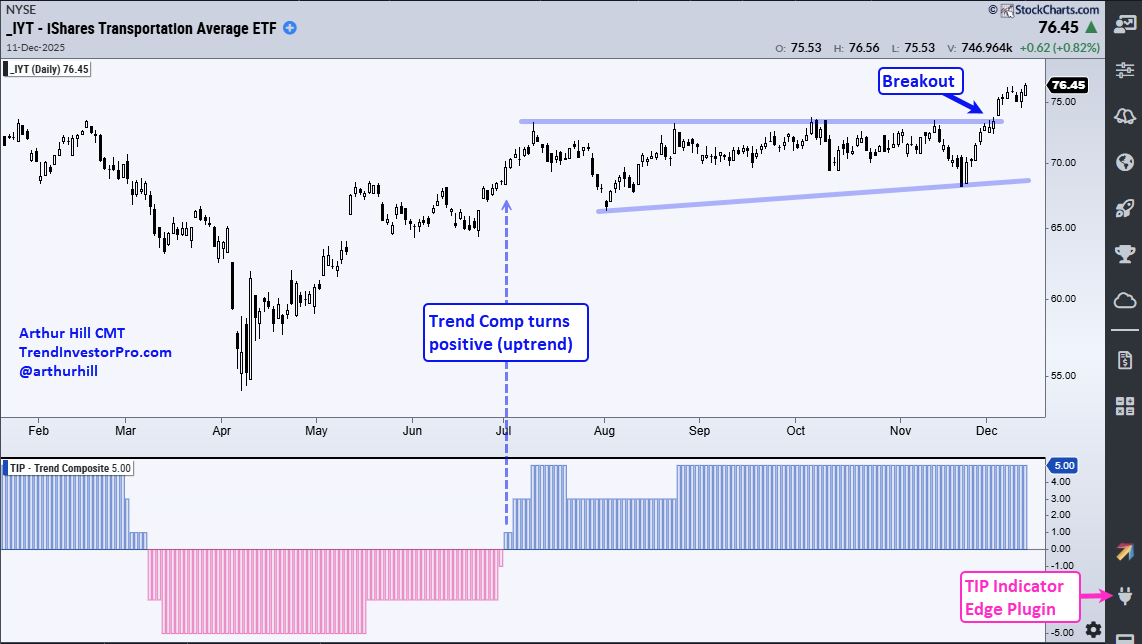
IYT extended higher with a move above 70 in mid-July, then moved into a trading range or consolidation pattern. A consolidation represents a rest within the uptrend. The blue lines show a higher low from July to November and equal highs (resistance) from July to November. Overall, the pattern is an Ascending Triangle, a classic bullish continuation pattern. The December breakout confirms the pattern and signals a resumption of the uptrend.
Using Oversold Conditions to Get a Discount
Once in an uptrend, chartists can look for oversold conditions to find optimal entry points within the uptrend. An oversold condition indicates that there was a pullback or consolidation within the uptrend. These conditions are not just for short-term traders, as trend-followers looking to accumulate within an uptrend can use oversold conditions to build a position.
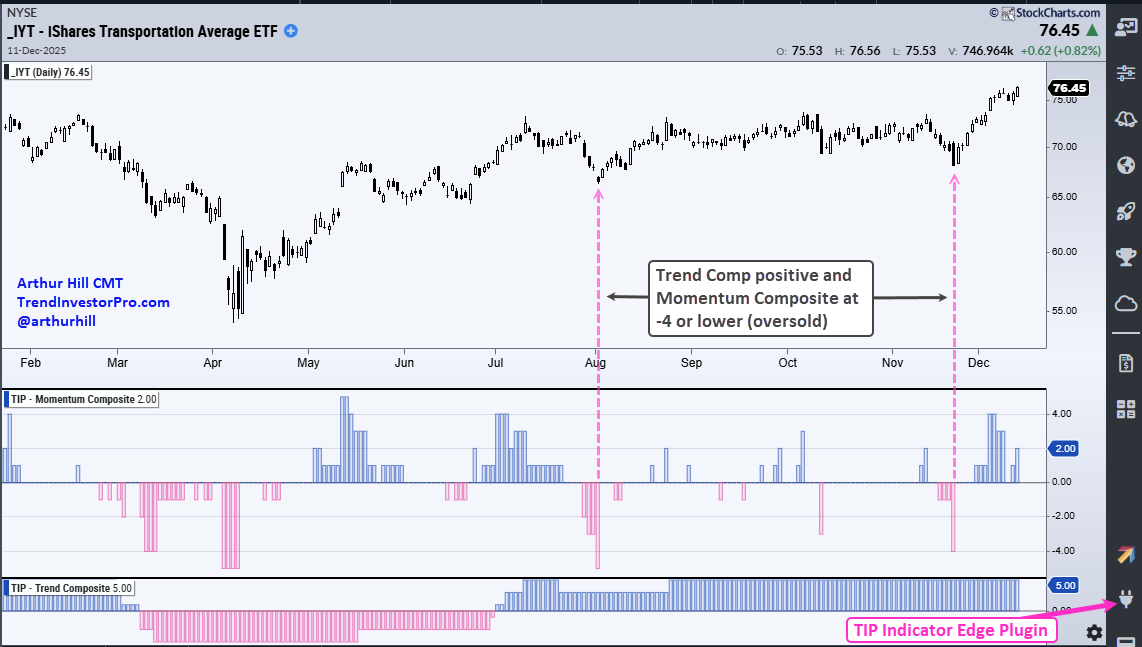
The chart above shows IYR with the Momentum Composite in the middle window. This indicator aggregates signals in five momentum oscillators. A value of -4 means four of the five indicators are oversold. The dashed pink lines show this indicator becoming oversold at the beginning of August and in late November. Though price action looked ugly, keep in mind that oversold conditions present opportunities because the long-term uptrend is the dominant force at work.
Recent reports and videos at TrendInvestorPro:
- Tech ETFs Extend on Flag Breakouts with Semis Leading
- Follow-Up on Housing, Retail and Banking ETFs
- Uranium ETFs Set Up Bullish as Gold Extends
- Bullish setups in Tempus, Johnson Controls and Arista Networks
- Core ETF ChartList (76 ETFs organized in a top-down manner)
Click here to take a trial and gain full access.
CSX Forms Bullish Continuation Pattern
CSX Corp (CSX) is a railroad stock and part of the Transports ETF. It is also in an uptrend with a bullish continuation pattern taking shape. CSX surged from April to mid-August, with the Trend Composite turning positive in late June.
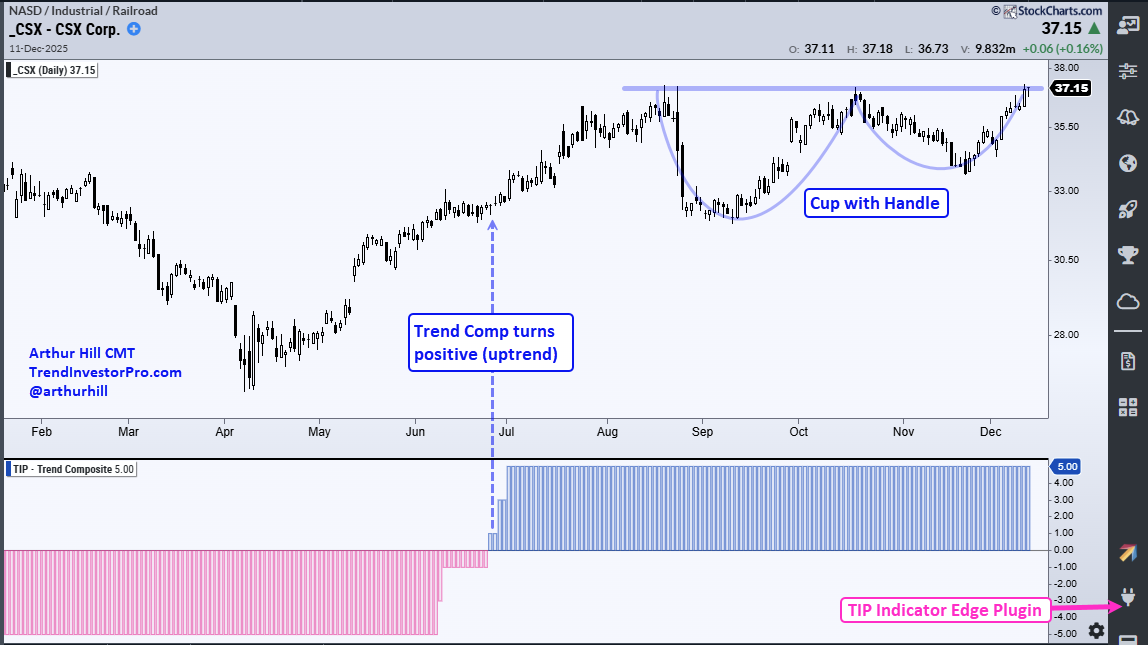
The stock hit resistance in August and consolidated into December. Again, this is a consolidation within an uptrend, which makes it a bullish continuation pattern. This time, we have a classic cup-with-handle taking shape. A break above rim resistance would signal a continuation higher.
Getting the Jump on the Breakout
Chartists looking to get a jump on this breakout can look for oversold conditions and short-term bullish continuation patterns. This is what we specialize in at TrendInvestorPro. In fact, CSX was featured as it pulled back and became oversold. The chart below shows a falling channel retracing around 61.8% of the prior advance; both the pattern and the retracement amount are typical for corrections. CSX broke out in late November and extended higher into December.
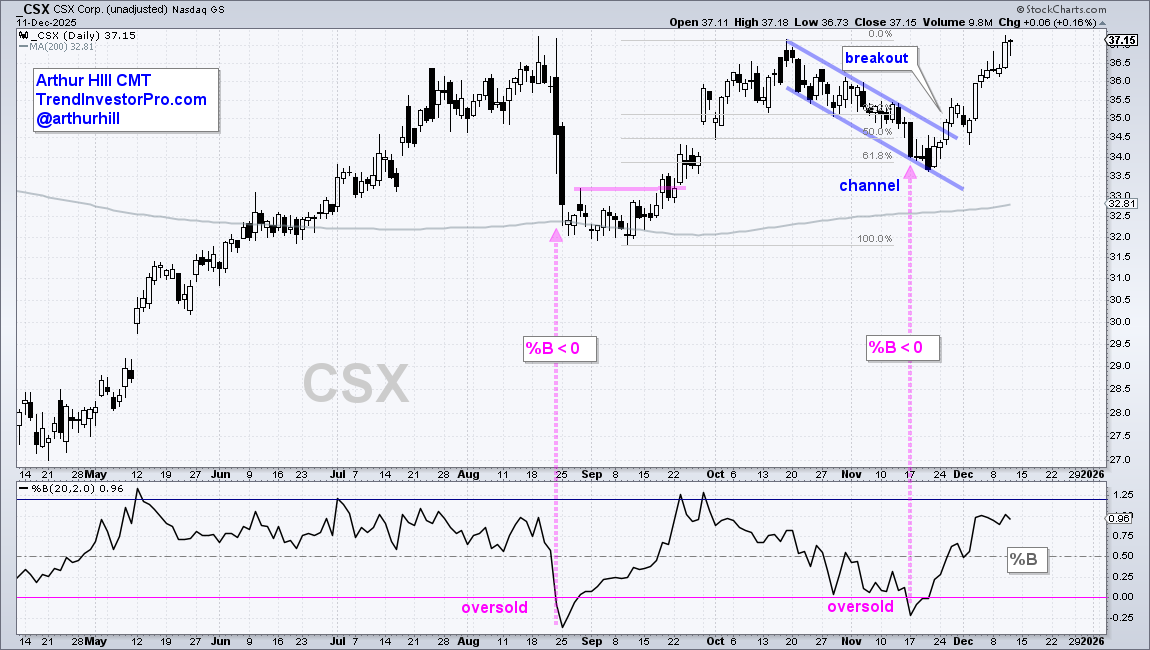
The indicator window shows %B (20,2), which is one of the five indicators in the Momentum Composite. Oversold conditions are present when %B dips below zero, which means the close was below the lower Bollinger Band (20,2). These conditions serve as an alert to focus on the price chart for a tradable setup and signal, which we got with CSX.
See TrendInvestorPro for more reports and videos.


