Wednesday May Have Been Turnaround Day for Some Markets

For several weeks, the financial markets have, to some extent or another, leaned in the direction of a rate cut. By Wednesday, lower rates had already been factored in, so it was a case of selling on the good news.
First, it’s important to remember that technical analysis requires us to examine several indicators to arrive at a meaningful conclusion. The greater the number pointing in a specific direction, the stronger the chances of a valid reversal. I bring that up because price action in several markets on Wednesday was indicative of a short-term reversal. “Short-term”, in this case, means about two to four weeks. However, these initial warnings still require something in the way of confirmation because one day’s action, however significant, is only one piece of evidence.
The Bond Market
Chart 1 features daily prices for the iShares 20+ Year Bond ETF (TLT). Wednesday’s action was one of exhaustion, where the price opened above Tuesday’s high but dropped below its low during the course of the day. Price bars that totally encompass their predecessor are known as “outside” bars. The wider they are relative to it, the greater the implied battle between buyers and sellers and the greater its significance. Wednesday’s bar was quite wide. Equally important is that it closed near the day’s low. This indicated traders entered the session on an optimistic note but ended in a pessimistic mood, as most were taking home a loss. Wednesday’s action, therefore, suggests that the balance of power has shifted to the sellers.
The chart also shows that Wednesday’s action filled the upper part of the mid-April downside gap. That’s important because gaps are almost always filled as market participants revisit these emotional parts of the chart. The problem is that while most are filled within two to four weeks, there is no known method of determining how long this process will take. Nonetheless, a cloud hangs over that market until that gap is filled. The red arrows in Chart 1 indicate that the two September gaps remain open, which is another reason for suspecting bond prices are vulnerable in the near-term.
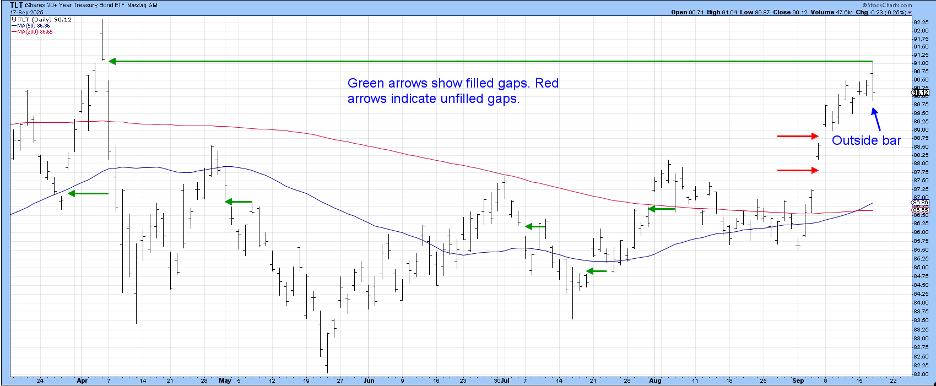
Unfortunately, it’s not possible to construct an up trendline, the violation of which serves as confirmation of the outside bar. However, in this situation, the unfilled gaps represent evidence that TLT is vulnerable.
Japanese Yen
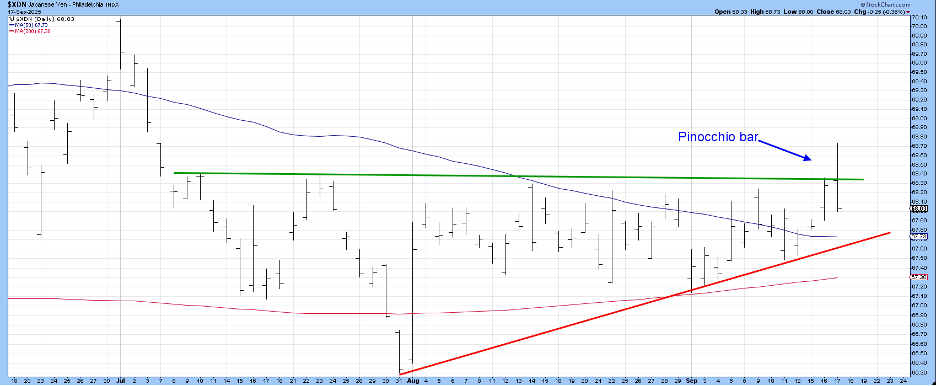
On Wednesday, the Japanese yen formed a one-day reversal pattern, known as a “Pinocchio” bar. It is modeled after the Disney character whose nose grew larger the bigger his lie. Bearish Pinocchios are formed when the intraday action pushes the price above a significant resistance level. However, by the end of the session, the price closes below it. A simple rule states that the bigger the false move, the more significant the pattern.
In the case of the yen, the resistance is formidable, and the nose quite impressive. Confirmation requires a break of the red up trendline. For those expecting instant gratification, it’s important to note that Pinocchios are often followed by two to three quiet sessions before dropping significantly lower.
Small Caps
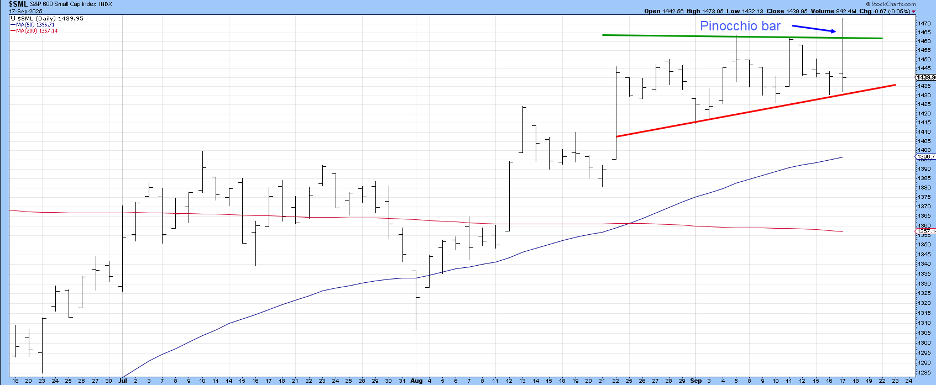
None of the major stock market indexes showed any strong turnaround characteristics on Fed Day. One exception comes from the small-cap sector in the form of the S&P Small Cap ($SML) and Russell 2000 (IWM) indexes. The $SML experienced a Pinocchio breakout above its August/September trading range. Confirmation in this case would come from a violation of the red support trendline.
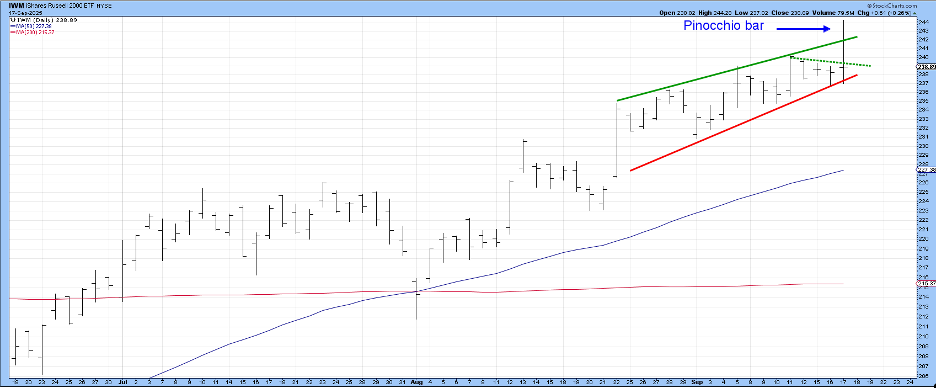
The IWM experienced more of an upward-sloping trend channel and formed a huge nose above the green dashed trendline. Confirmation would again require a drop below the red trendline.
The Bottom Line
Wednesday looks like a short-term turnaround day for bonds, the yen, and small caps, but all require confirmation. It’s important to note that these emotional patterns are often followed by a few quiet bars before the new downward trend gets underway. If, on the other hand, the intraday high of a single bar formation is taken out in a decisive way, it’s usually a good idea to conclude that they have failed. After all, markets are like people, and people can and do change their minds for no apparent reason at all.
Good luck and good charting,
Martin J. Pring
The views expressed in this article are those of the author and do not necessarily reflect the position or opinion of Pring Turner Capital Group of Walnut Creek or its affiliates.


