Week Ahead: NIFTY May Not Stay Insulated from Global Tensions; Relative Outperformance Expected from Indian Equities

The markets traded with a distinct negative bias throughout the short trading week, with sustained selling pressure and a moderately weak close. After attempting to stabilize at higher levels early in the week, the Nifty 50 gradually drifted lower and breached key short-term supports, oscillating in a range of 758 points before closing near the lower end of the range. Volatility cooled off, with India VIX decreasing by ~4.78% on a weekly basis, reflecting increased nervousness amid global uncertainties. Nifty ended the week with a minor net loss of 106.50 points (-0.47%).
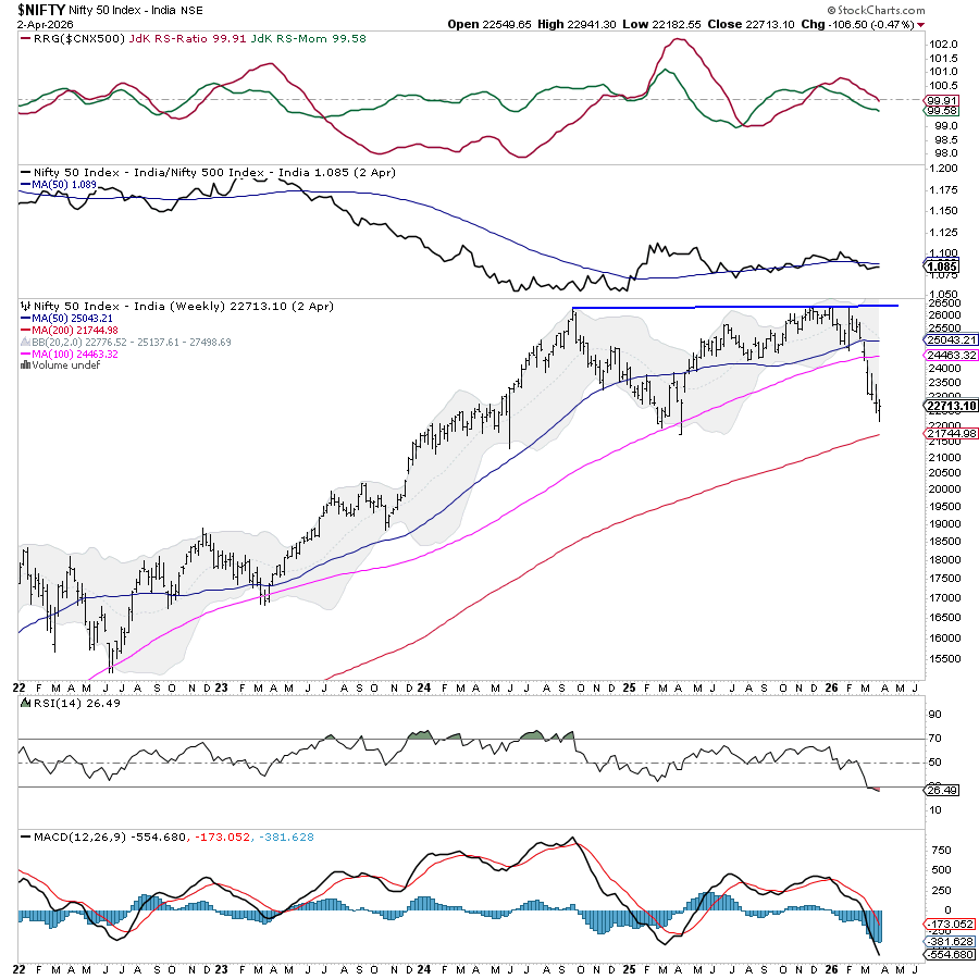
From a structural standpoint, the Nifty 50 Index has violated an important support zone and slipped below its recent consolidation base, indicating a short-term deterioration in trend. The price continues to trade below the 50-week and the 100-week moving average and is now approaching a critical confluence support zone near 21,700, which coincides with the 200-week moving average and a major pattern support. This makes the current setup technically crucial.
While the broader trend remains relatively stable for now and a technical rebound cannot be ruled out with the slightest trigger, the ongoing weakness suggests that any further breach below 21,700 may trigger an extended corrective phase. External factors such as persistent geopolitical tensions in the Middle East and rising crude oil prices continue to pose risks and may keep sentiment fragile, though relative outperformance by Indian equities may persist.
For the coming week, markets are likely to begin on a cautious note with a negative undertone. Immediate resistance levels are placed at 23,000 and 23,250, while supports come in at 22,480 and 22,000. A sustained move below 22,000 will increase the probability of testing the 21,700 zone sooner rather than later.
The weekly Relative Strength Index (RSI) stands at 26.49, placing it in oversold territory. It has formed a new 14-period low; however, it remains neutral and does not show any divergence against the price. The Moving Average Convergence/Divergence (MACD) remains below its signal line and continues to stay in negative territory, reinforcing the prevailing bearish momentum.
Pattern analysis shows that the Nifty 50 has continued drifting lower but is attempting to show resilience at lower levels, at least in relative terms. The price is currently tracking the lower Bollinger band, and the index is now testing lower supports while staying below key moving averages like the 50-week MA and the 100-week MA. The long-term structure remains intact as long as the 200-week MA (~21,700) is protected, but the near-term technical damage is evident.
Given the current setup, the approach for the coming week should remain cautious and defense-oriented. Traders should avoid aggressive fresh buying until signs of stabilization emerge near key support zones. Emphasis should be placed on protecting existing gains and adopting a highly selective, stock-specific approach. Any pullbacks toward resistance levels should be used to lighten positions rather than initiate fresh exposure. Overall, a guarded and risk-managed strategy is recommended, while closely monitoring the behavior around the 21,700 support zone.
Sector Analysis for the Coming Week
In our look at Relative Rotation Graphs®, we compared various sectors against the CNX500 (NIFTY 500 Index), representing over 95% of the free-float market cap of all the listed stocks.
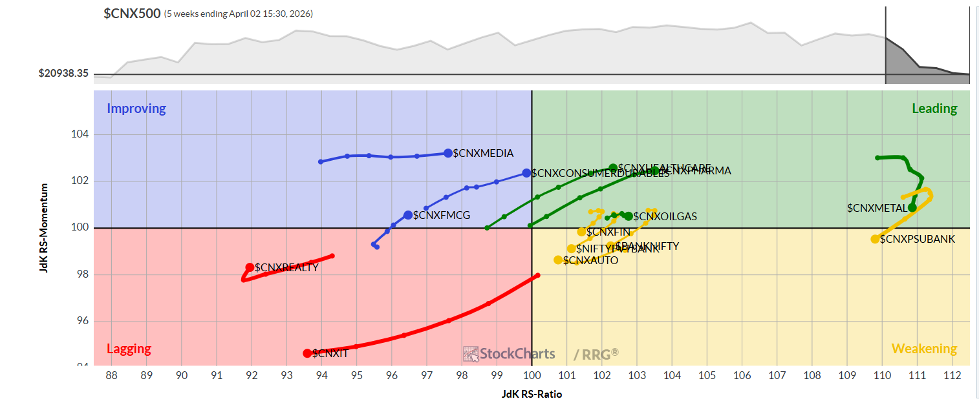
The Relative Rotation Graph (RRG) shows that the Nifty Pharma, PSE, Infrastructure, Metal, and Energy groups are inside the leading quadrant. The Nifty Midcap 100 Index has also rolled inside the leading quadrant. The Metal Index is sharply losing its relative momentum; however, these groups are likely to relatively outperform the broader Nifty 500 Index.
The Nifty 500 Index has rolled inside the weakening quadrant. The Nifty Auto, PSU Banks, and Nifty Bank Index are also inside this quadrant. These groups will see a continued slowdown in their relative performance.
The Nifty Services Sector and the IT Index are languishing inside the lagging quadrant; they may find themselves underperforming the broader markets relatively. The Realty Index is also inside the lagging quadrant. However, it looks to be improving on its relative momentum.
The Nifty FMCG Index and the Media Index are inside the improving quadrant. We may see these sectors slightly improving their relative performance against the broader markets.
Important Note: RRG™ charts show the relative strength and momentum of a group of stocks. In the above Chart, they show relative performance against the NIFTY500 Index (Broader Markets) and should not be used directly as buy or sell signals.
Milan Vaishnav, CMT, MSTA
Consulting Technical Analyst
www.EquityResearch.asia | www.ChartWizard.ae