Week Ahead: NIFTY Not Yet Out Of the Woods; Deal With Upticks In This Manner
The markets staged a sharp rebound through the week and ended with strong gains, recovering decisively from the previous spell of weakness. Nifty traded in a wide 1,531.10-point range, oscillating between 22,542.95 and 24,074.05 before settling near the week’s high at 24,050.60. Sentiment was aided by a meaningful cooling-off in volatility as India VIX declined from 25.52 to 18.85, shedding 6.67 points or 26.14% on a weekly basis. Nifty closed the week with a robust gain of 1,337.50 points, or 5.89%.
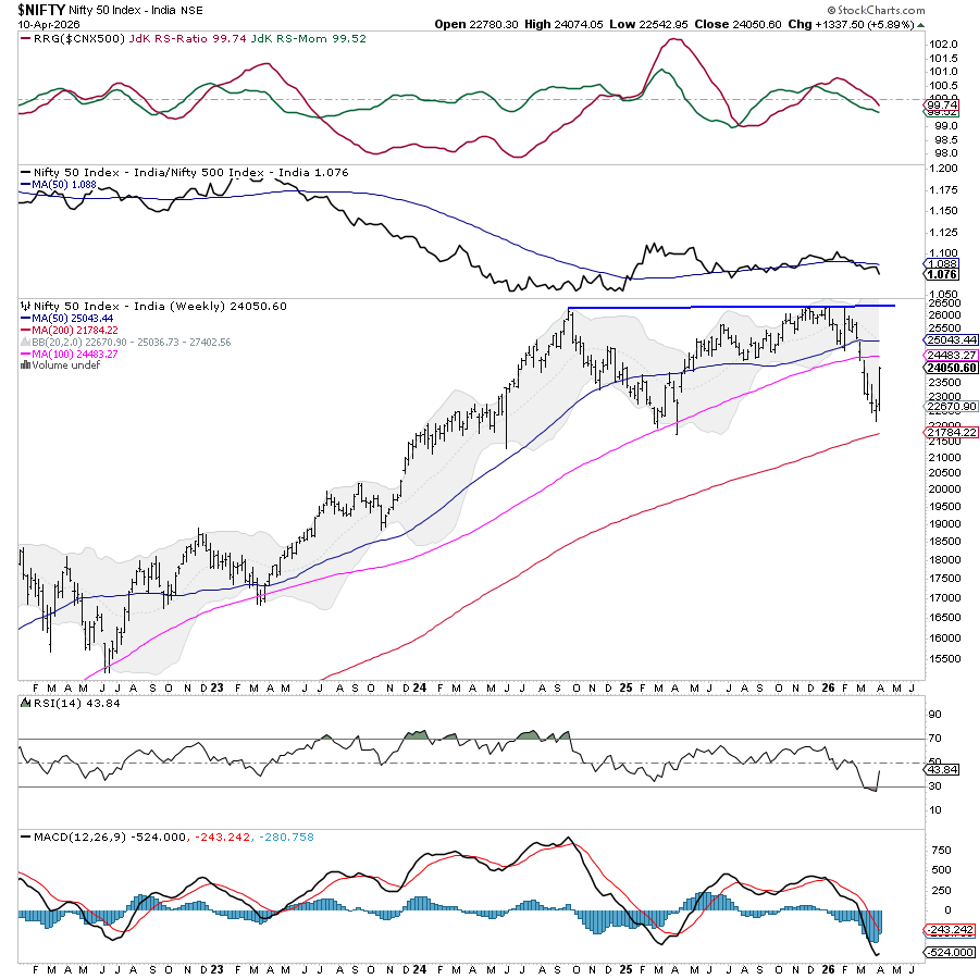
That said, the index is still not completely out of the woods. The week’s recovery candle has helped Nifty rebound sharply from the lower end of its recent decline, but the index continues to trade below an important cluster of overhead resistances, including the 50-week moving average at 25,043.44 and the 100-week moving average at 24,484.27. In other words, the market has seen a strong pullback rally, but it is yet to fully reclaim the zone that would confirm a complete restoration of trend strength.
As long as Nifty remains below the 24,480–25,050 zone, intermittent profit-taking and resistance-led hesitation cannot be ruled out. A sustained move above this band would improve the technical structure meaningfully, while any failure to hold above near supports may once again invite volatility.
Given that the coming week is a truncated one, with Tuesday being a holiday on account of Dr. Babasaheb Ambedkar Jayanti, the market may see a measured start with stock-specific activity dominating the undertone. The most likely resistance levels are seen at 24,485 and 24,625. The important supports are placed at 23,700 and 23,400.
The weekly RSI stands at 43.84. It has turned up from lower levels, but still remains below the 50 mark, which shows that momentum has improved but is not yet outright bullish. There is no meaningful bullish or bearish divergence visible against the price at this stage; the reading is neutral. The weekly MACD remains below its signal line, and both are still in negative territory, suggesting that despite the sharp recovery, the broader momentum setup has not yet fully reversed. The week has formed a strong bullish candle after a steep fall, reflecting aggressive short-covering and value buying from lower levels.
Pattern-wise, Nifty has attempted a forceful rebound after testing the lower Bollinger Band at 22,609.44 and has stayed well above the 200-week moving average at 21,784.72. This keeps the long-term structure intact for now. However, the index remains below its medium-term moving average barrier zone, so this recovery must see follow-through before it can be considered the start of a fresh directional uptrend. Until then, this remains a technically important rebound, but not yet a full trend reset.
For the coming week, the focus should clearly remain on protecting gains rather than chasing every rise. Fresh buying should be kept limited to technically strong stocks that are either improving in structure or showing strong relative strength against the broader market. Chasing all up moves is not advised, especially with the index approaching overhead resistance zones, the market still carrying unfinished repair work on the weekly chart, and geopolitical uncertainty still hovering. The best approach would be to stay selective, remain disciplined on profits, and keep a stock-specific stance through the truncated week.
Sector Analysis for the Coming Week
In our look at Relative Rotation Graphs®, we compared various sectors against the CNX500 (NIFTY 500 Index), representing over 95% of the free-float market cap of all the listed stocks.
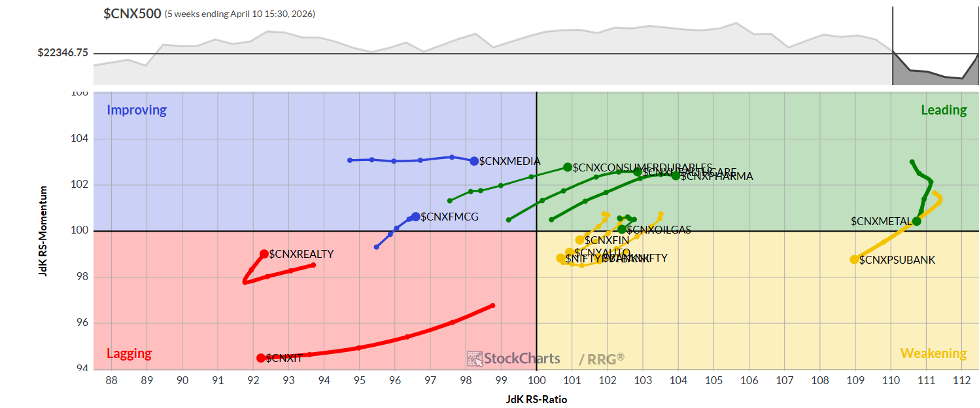
The Relative Rotation Graph (RRG) shows Nifty Energy, Midcap 100, Pharma, PSE, Metal, and Infrastructure Indices inside the leading quadrant. Groups like Metal and PSE are seeing a slowdown in their relative momentum, though collectively these groups are set to relatively outperform the broader markets.
The Nifty PSU bank, Banknifty, and Financial Services sector Indices are inside the weakening quadrant. They may see a deceleration in their relative performance. The Nifty Auto Index is also inside this quadrant, but it is showing good improvement in its relative momentum against the broader markets.
The IT Index continues to languish inside the lagging quadrant. The Services and the Realty Index are also inside this quadrant; however, the Realty space is seen improving its relative momentum.
The Nifty Media and FMCG Indices are inside the improving quadrant.
Important Note: RRG™ charts show the relative strength and momentum of a group of stocks. In the above Chart, they show relative performance against the NIFTY500 Index (Broader Markets) and should not be used directly as buy or sell signals.
Milan Vaishnav, CMT, MSTA
Consulting Technical Analyst
www.EquityResearch.asia | www.ChartWizard.ae