Week Ahead: NIFTY Sits at Important Supports; Scarcity of Leadership Remains a Concern
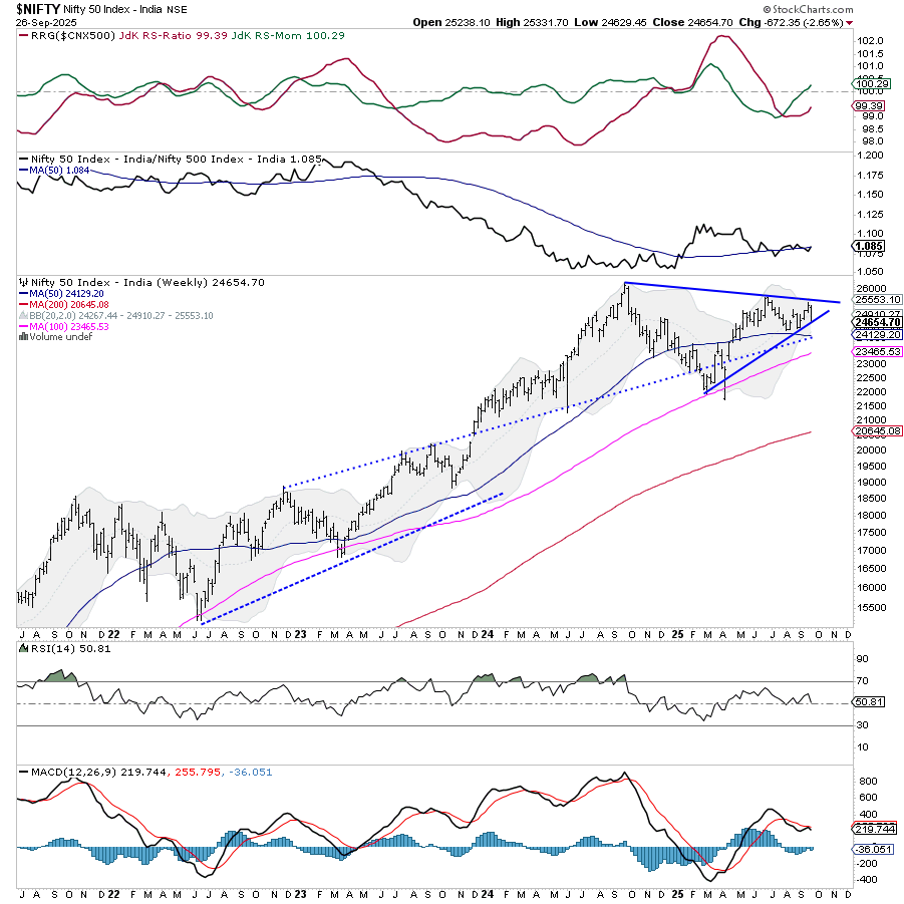
The markets exhibited a negative bias throughout the week as the Nifty remained under pressure, declining in all sessions and remaining largely range-bound. It failed to post any meaningful rebound and eventually ended the week on a negative note. The benchmark index traded in a range of 702 points, between 25,331.70 on the higher end and 24,629.45 on the lower end. India VIX surged sharply by 14.62% on a weekly basis, closing at 11.43, indicating a rise in hedging activity. The Nifty ended with a net weekly loss of 672.35 points, or -2.65%.
The broader structure continues to remain within a large symmetrical triangle pattern on the weekly timeframe. Nifty has faced consistent resistance from the falling trendline drawn from the all-time high, and has once again failed to break out of this zone. The index also finds itself trading just above the lower rising trendline support of the triangle. This contraction suggests continued non-directional behavior, unless a breakout or breakdown is confirmed. Markets are not currently trending and are in a phase of time-wise consolidation. A decisive move beyond the 25,300-25,400 zone will be essential to signal any resumption of an uptrend, while a breakdown below 24,600 may trigger a broader corrective phase.
Given the recent weakness and inability to reclaim key resistance levels, the coming week may see a cautious start. Resistance is expected near 24,910 and 25,250, while support exists at the 24,250 and 24,000 levels. The trading range is likely to stay wider than usual.
The weekly RSI stands at 50.81 and remains neutral, showing no divergence against the price. It reflects a lack of momentum in either direction. The weekly MACD remains below its signal line, maintaining a bearish crossover. A large black candle emerged, indicating a strongly bearish behavior that the markets exhibited.
From a pattern analysis perspective, Nifty continues to trade within the previously mentioned large symmetrical triangle that has been forming for over a year now. Such formations typically precede sharp directional moves once a breakout or breakdown occurs. Currently, the price is oscillating within the apex of the pattern, which implies a likely breakout attempt in the coming weeks. The index is hovering around the midline of the Bollinger Bands and, while the 20-week MA near 24,910 offers resistance, the rising 50-week MA near 24,130 serves as immediate support.
In light of the current technical setup, it is advised that traders adopt a cautiously selective approach in the coming week. While volatility remains low, the spike in India VIX suggests a potential pickup in price movement. Fresh aggressive positions should be avoided until Nifty moves out of the current consolidation zone. Traders would be better served by protecting gains, remaining highly stock-specific, and keeping strict stop losses in place. The methodical approach should be to wait for a confirmed breakout or breakdown from the triangle pattern before increasing market exposure.
Sector Analysis for the Coming Week
In our look at Relative Rotation Graphs®, we compared various sectors against the CNX500 (NIFTY 500 Index), representing over 95% of the free-float market cap of all the listed stocks.
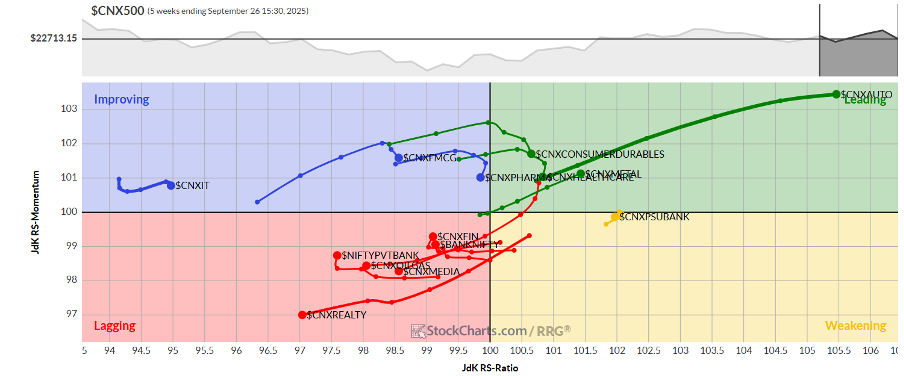
Relative Rotation Graphs (RRG) continue to reflect the scarcity of leadership. The Metal and Auto Indices are the only sector Indices that are located in the leading quadrant. We will continue to see these groups relatively outperforming the broader markets.
The PSU Bank and Midcap 100 Indices are inside the weakening quadrant. While individual performance may persist, relative performance may slow down over the coming days.
The Commodities Index has rolled inside the weakening quadrant. The Consumption, Energy, Infrastructure, PSE, Media, and Realty Index are also languishing within the weakening quadrant. The Nifty Financial Services, Services Sector, and Nifty Bank are showing improvement in their relative momentum against the broader Nifty 500 Index.
The Nifty Pharma, IT, and FMCG Indices are within the improving quadrant; however, they are seen weakening in their relative momentum against the broader markets.
Important Note: RRG™ charts show the relative strength and momentum of a group of stocks. In the above chart, they show relative performance against NIFTY500 Index (Broader Markets) and should not be used directly as buy or sell signals.
Milan Vaishnav, CMT, MSTA
Consulting Technical Analyst
www.EquityResearch.asia | www.ChartWizard.ae


