Week Ahead: NIFTY Snaps 6-Week Losing Streak; Trend Intact as Long as This Level Stays Protected
Key Takeaways
- The market broke a six-week losing streak, posting modest gains and showing heightened but still low risk.
- Nifty's current setup suggests a slow start next week, and upside may be capped.
- The Auto Index has entered the leading quadrant on RRG, while many other sectors show strengthening relative momentum.
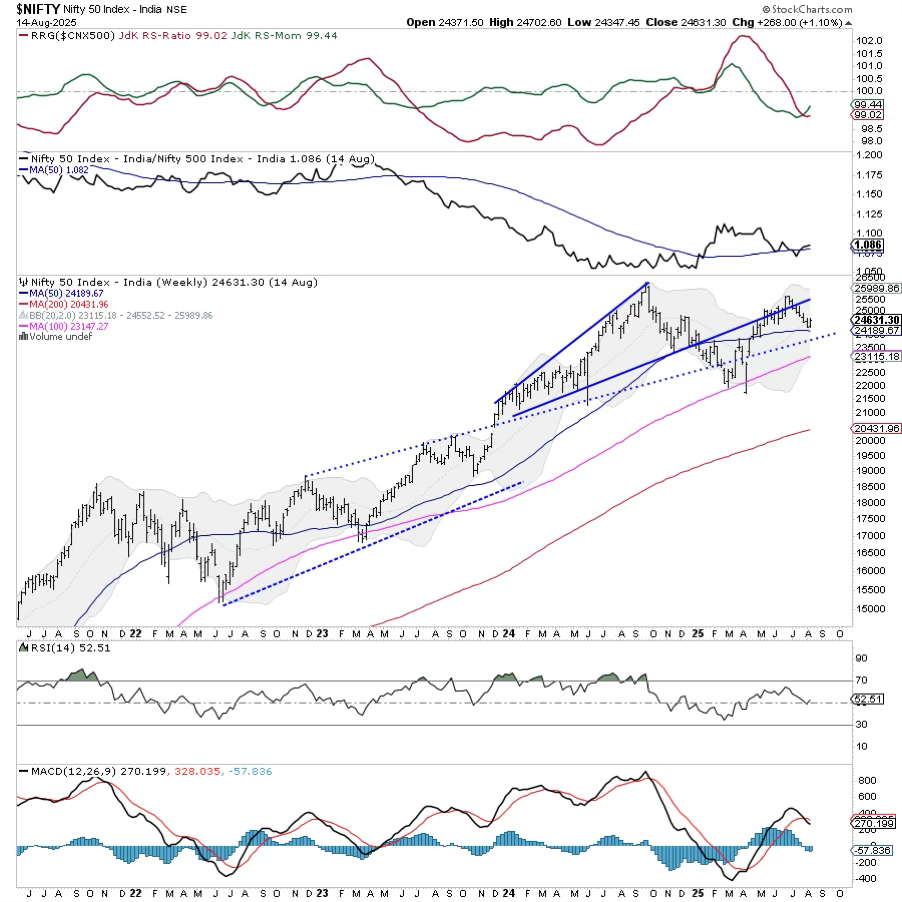
The market showed a firm undertone in the truncated trading week, ending on a positive note after snapping a six-week losing streak. Nifty remained within a relatively narrow range, oscillating between 24,347 and 24,702 and showing a weekly trading range of just 355 points. Despite a shortened week due to the Independence Day holiday on Friday, the Index posted a gain of 268 points, or 1.10%. India VIX, which gauges volatility, rose modestly by 2.68% to 12.35, indicating a slightly heightened risk perception but still remaining comfortably low.
The broader structure suggests that Nifty is currently moving in a range-bound fashion, facing overhead pressure from the falling trendline resistance that extends from the all-time highs. While the Index has managed to stay above its key short-term moving averages, the overall structure remains that of a non-trending market for now. The ongoing consolidation just below the resistance zone of 24,800–25,000 reflects a cautious, yet resilient undertone. A decisive move above this zone may reignite upward momentum, while any drift below 24,200 could intensify selling pressure.
Given the current setup, Nifty may see a tepid start to the coming week. The immediate support is placed at 24,200, followed by stronger support near 23,880. On the higher side, resistance exists at 24,800, and then at 25000. Unless the Index breaks above this resistance zone with strong volumes, any upside may remain capped.
The weekly RSI stands at 52.50; it remains neutral and does not show any divergence against the price. The RSI suggests the market is neither overbought nor oversold. The weekly MACD remains below its signal line, reflecting continued lack of positive momentum.
From a pattern analysis standpoint, the Nifty remains below a falling trendline drawn from recent highs, which is acting as stiff resistance. While the Index is still trading above its 50-week and 100-week moving averages (24,191 and 23,148, respectively), the lack of strength to challenge the falling trendline indicates a pause in bullish momentum. The broader uptrend remains intact as long as the Index holds above its 50-week average, but, for now, the absence of a fresh breakout keeps the trend vulnerable to consolidation.
In the coming week, a cautious and stock-specific approach is advised. With the Index still consolidating below key resistance levels and no breakout confirmation, aggressive buying should be avoided. Traders would do well to protect gains and closely monitor the 24,200 level as a key support. A measured and vigilant approach with strict stop losses would be the best way to navigate the week ahead.
Sector Analysis for the Coming Week
In our look at Relative Rotation Graphs®, we compared various sectors against the CNX500 (NIFTY 500 Index), representing over 95% of the free-float market cap of all the listed stocks.
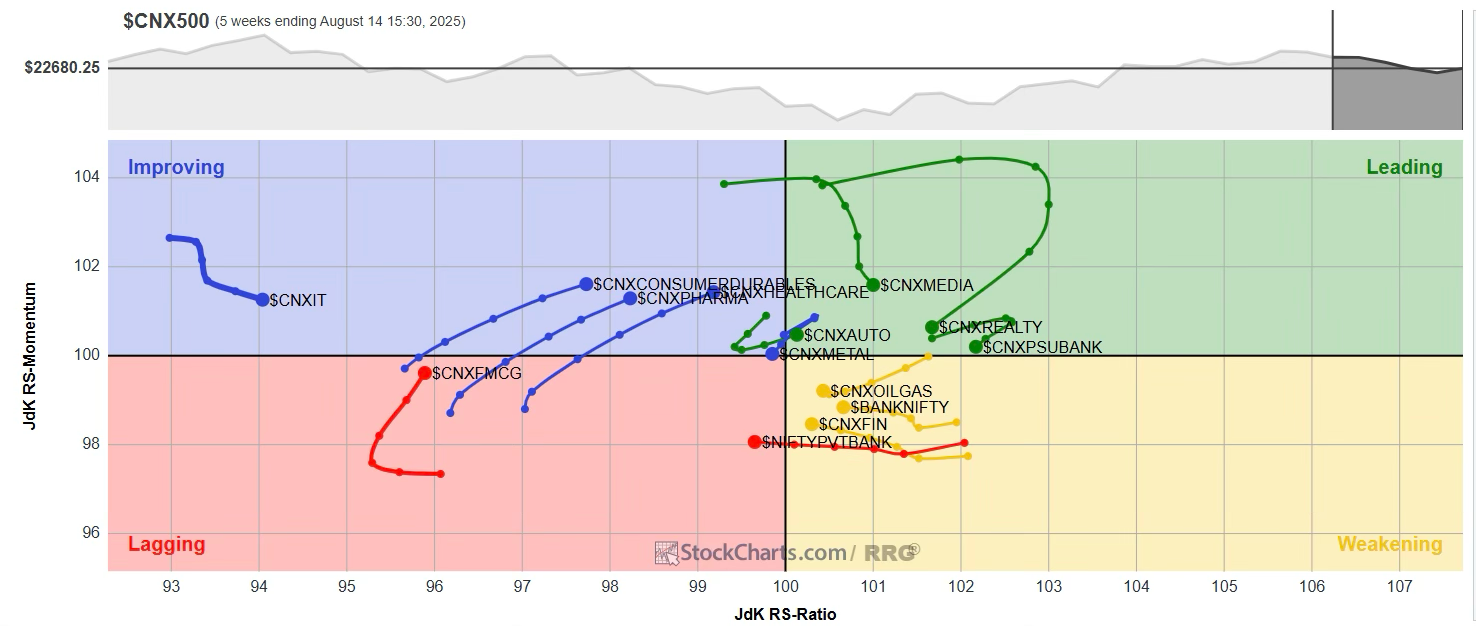
Relative Rotation Graphs (RRG) show that the Auto Index has rolled inside the leading quadrant and is showing improved relative momentum along with the Infrastructure Index, which is also placed in this quadrant. The Nifty Media, Realty, Metal, PSE, PSU Bank, Midcap 100, and Energy Indices are also inside the leading quadrant. All these indices are showing sharp paring of relative momentum against the broader markets. Their relative performance may slightly diminish because of this.
The Nifty Financial Services and Nifty Bank Index show improving relative momentum while staying inside the weakening quadrant.
The Nifty Services Sector Index continues to show sharp improvement in its relative momentum, along with the FMCG Index, while being inside the lagging quadrant. Besides this, the Consumption and the Commodities Indices continue to languish inside the lagging quadrant.
The Nifty Pharma and the IT Index are placed inside the improving quadrant. Given their trajectory of rotation, they are expected to continue to improve their relative performance against the broader markets.
Important Note: RRG™ charts show the relative strength and momentum of a group of stocks. In the above chart, they show relative performance against NIFTY500 Index (Broader Markets) and should not be used directly as buy or sell signals.
Milan Vaishnav, CMT, MSTA
Consulting Technical Analyst
www.EquityResearch.asia | www.ChartWizard.ae


