Week Ahead: NIFTY Stays Above Crucial Supports; Prolonged Complacency in the Markets Remains a Concern

The markets traded in a ranged-but-positive manner over the past week, ending with modest gains. Nifty oscillated in a narrow intra-week range of 317 points, between a high of 24,904.80 and a low of 24,587.70; they eventually closed near the upper end at 24,894.25 with a net weekly gain of 239.55 points, or 0.97%. India VIX declined sharply by 11.96% over the week to close at 10.06, approaching its lowest historical levels and raising concerns over complacency in the market.
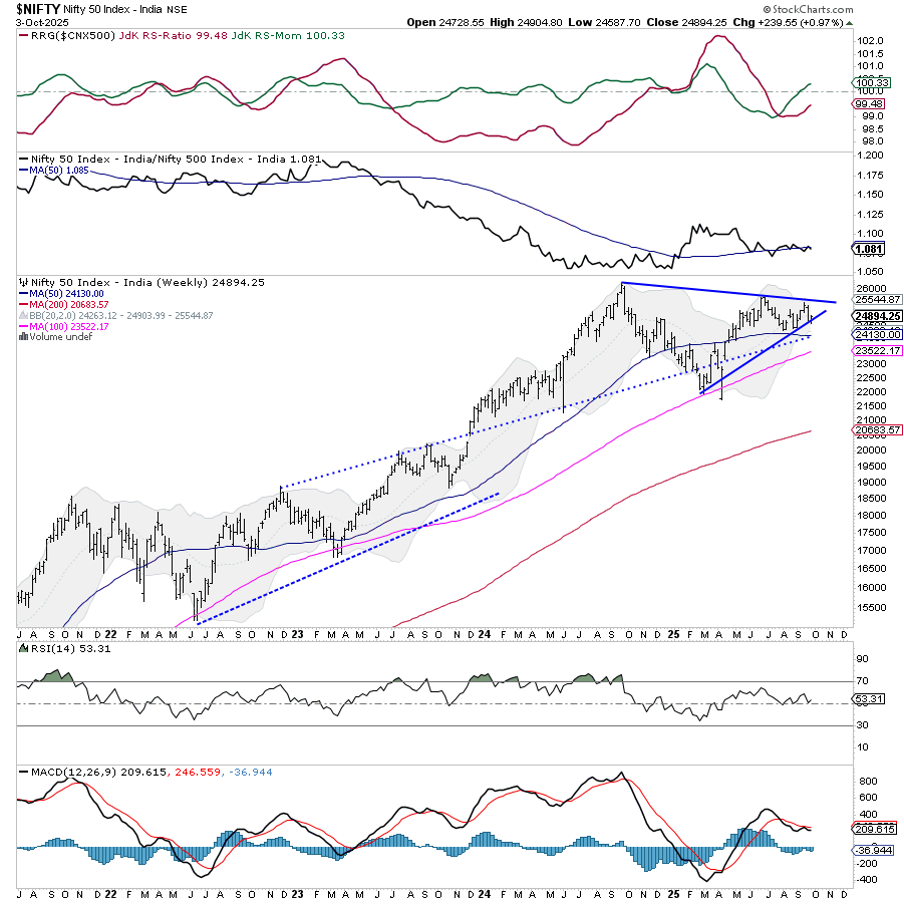
The current structure reflects a market that is consolidating with a slightly positive bias. Nifty continues to stay within a broad symmetrical triangle formation, with prices now inching toward the apex. The index is holding above its key moving averages. However, it is yet to decisively clear the falling trendline resistance drawn from the all-time highs.
Despite the RBI’s decision to keep the repo rate unchanged at 5.50%, a move largely priced in, the market’s lack of a strong directional thrust points toward an indecisive undertone. Sustained movement above 24,950–25,000 levels could lead to a breakout, while any slip below 24,250 may increase downside vulnerability.
The coming week may see a cautious but mildly positive start; however, lack of volatility and sluggish participation could cap momentum. On the upside, resistance is expected at 25,100 and 25,460 levels. Supports exist at the 24,650 and 24,300 zones.
The weekly RSI stands at 53.31 and remains neutral, showing no divergence against the price. It continues to mark a mild bullish range shift. The MACD remains below the signal line, indicating the trend momentum has not fully turned in favor of the bulls yet. No strong candlestick pattern is visible on the weekly chart, signaling continued consolidation with upward bias.
From a pattern perspective, the symmetrical triangle formation remains the dominant technical setup. The narrowing price action toward the apex of this triangle suggests that a directional breakout may be imminent over the coming weeks. Nifty is trading above all key moving averages, including the 50-week (24131), 100-week (23523), and 200-week (20684) MAs, indicating the medium- to long-term trend remains intact. However, it remains below the 20-week MA placed at 24,903.
Given the extremely low India VIX, which suggests an unusually high level of complacency among market participants, the current environment warrants caution. Traders should stay vigilant and avoid aggressive long positions until a clear directional breakout is seen. A stock-specific approach with a focus on protecting profits is recommended. The best way to navigate the coming week is by staying highly selective, trailing stop losses, and preparing for a possible rise in volatility as the index approaches critical technical thresholds.
Sector Analysis for the Coming Week
In our look at Relative Rotation Graphs®, we compared various sectors against the CNX500 (NIFTY 500 Index), representing over 95% of the free-float market cap of all the listed stocks.
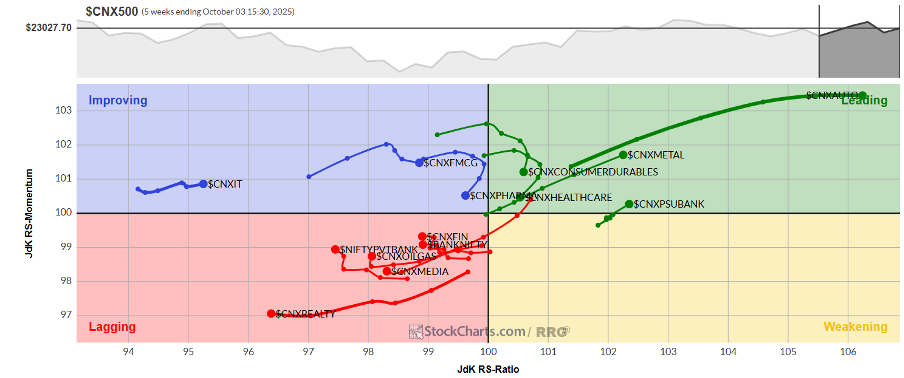
Relative Rotation Graphs (RRG) continue to reflect narrow leadership in the markets. While the Metal and the Auto Indices continue to roll strongly inside the leading quadrant, the PSU Bank Index has also rolled back inside the leading quadrant from the weakening quadrant following a strong shift in its relative momentum. These groups are likely to relatively outperform the broader Nifty 500 Index.
The Nifty Midcap 100 is the only one inside the weakening quadrant.
The Nifty Commodities Index has rolled inside the lagging quadrant. The Consumption, Financial Services, Energy, Banknifty, Services Sector, PSE Media, and the Realty Indices are inside the lagging quadrant. A few among this group are seeing good improvement in their relative momentum, while others continue to languish.
The IT, FMCG, and Pharma Indices are inside the improving quadrant.
Important Note: RRG™ charts show the relative strength and momentum of a group of stocks. In the above chart, they show relative performance against NIFTY500 Index (Broader Markets) and should not be used directly as buy or sell signals.
Milan Vaishnav, CMT, MSTA
Consulting Technical Analyst
www.EquityResearch.asia | www.ChartWizard.ae


