What Is The Crypto Selloff Telling Us About Stocks?

Cryptocurrencies are widely considered risk assets, investments whose underlying value can fluctuate significantly. While they offer the potential for much higher growth than safer assets like government bonds, they also potentially carry the risk of significant losses. As a result, the way cryptocurrencies such as Bitcoin ($BTCUSD) trade can help us raise or lower our expectations for U.S. stocks, which are also considered risk assets.
To begin, let's use the Correlation Coefficient indicator at StockCharts.com to assess how closely (positively) cryptos trade relative to the S&P 500.
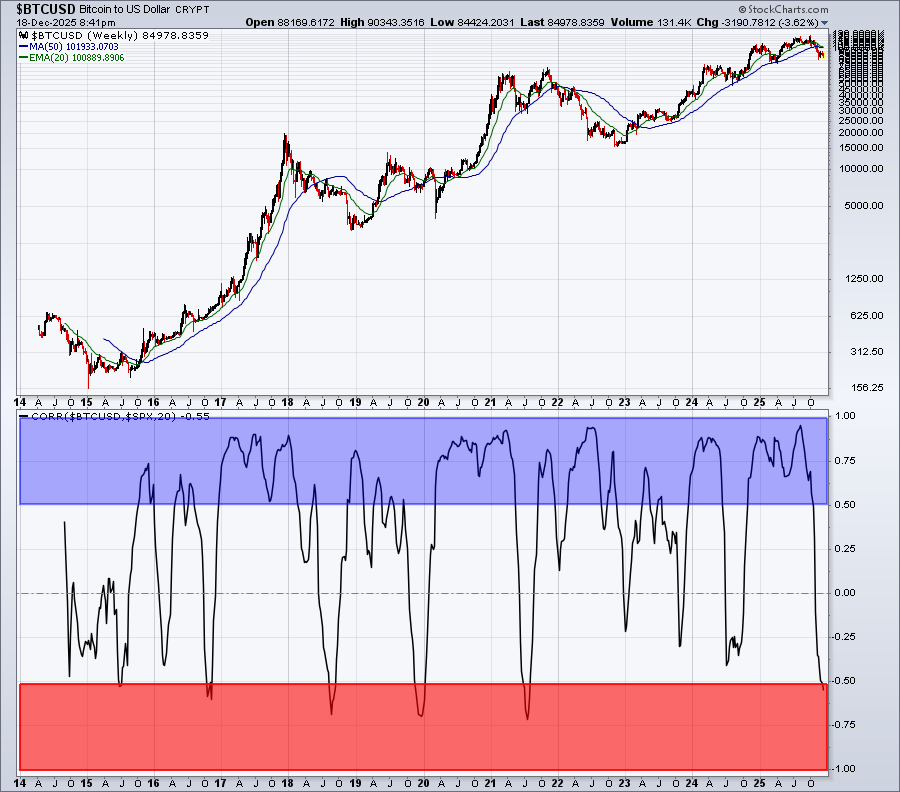
I've used blue-shading to highlight the strong positive correlation periods and red-shading to highlight the strong inverse (or negative) correlation periods. It's rather obvious to me that these two separate asset classes do tend to move mostly in the same direction. From this analysis, I think we can draw a conclusion that, if one of these asset classes is struggling, we can expect the other might do the same – right?
Well, as I reviewed this corelation a bit closer, I realized that Bitcoin had a tendency to top before the S&P 500, sort of providing us an advanced signal for the S&P 500. Check out the following chart:
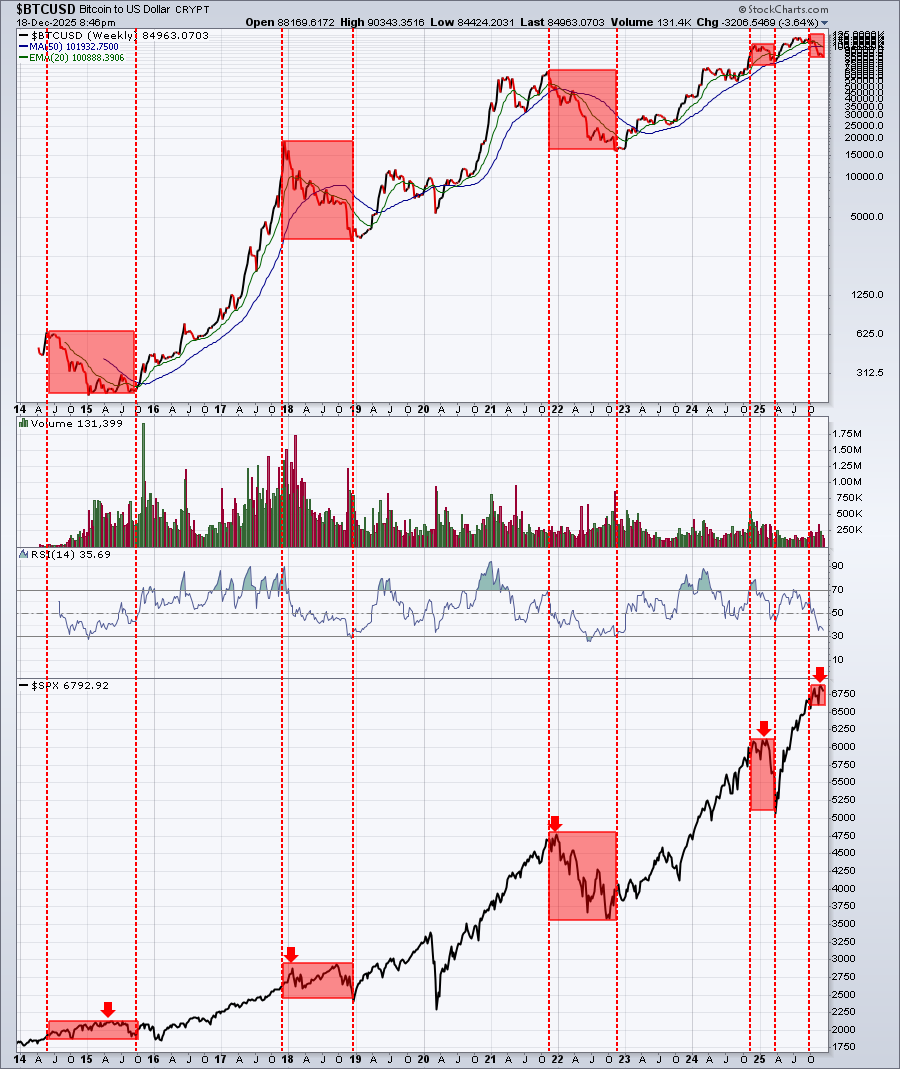
First of all, I skipped the pandemic period as I don't believe Bitcoin performance or any other signal was responsible for the S&P 500 decline in March 2020. In my opinion, the pandemic weakness came on quickly and really shouldn't be attributable to any signal other than the COVID virus itself.
Next, I highlighted significant periods of bitcoin weakness, noting that tops in Bitcoin occurred just prior to S&P 500 tops. Those later S&P 500 tops generally printed within a month or less of the Bitcoin top (with 2014–2015 the only exception) and are highlighted with a red arrow.
This certainly is no guarantee of S&P 500 weakness ahead but, should Bitcoin continue trending lower, we should all be aware of this positive correlation and what it could mean for potential S&P 500 downside as we enter 2026. Remember, the most bullish historical period of the year ends in mid-January.
Free Saturday Event
I'm growing more and more concerned about the current health of the stock market. I don't try to call tops very often and tops generally form over time. Unlike bottoms, there isn't usually a capitulatory-type candlestick that coincides with a top. Instead, we typically see a series of signals that begin to add up, which is where we're at now.
On Saturday, December 20th, at 10:00am ET, I'll be hosting a FREE event, "Correction Watch: The Hidden Signals Pointing to Trouble." If you're concerned about protecting capital and managing risk, then this event is for you! Simply CLICK HERE to register for the event. Even if you cannot attend the event live, please register so that you'll receive a copy of the recording.
Happy trading!
Tom


