What Lies Ahead for Nifty? A Look at the Week Ahead
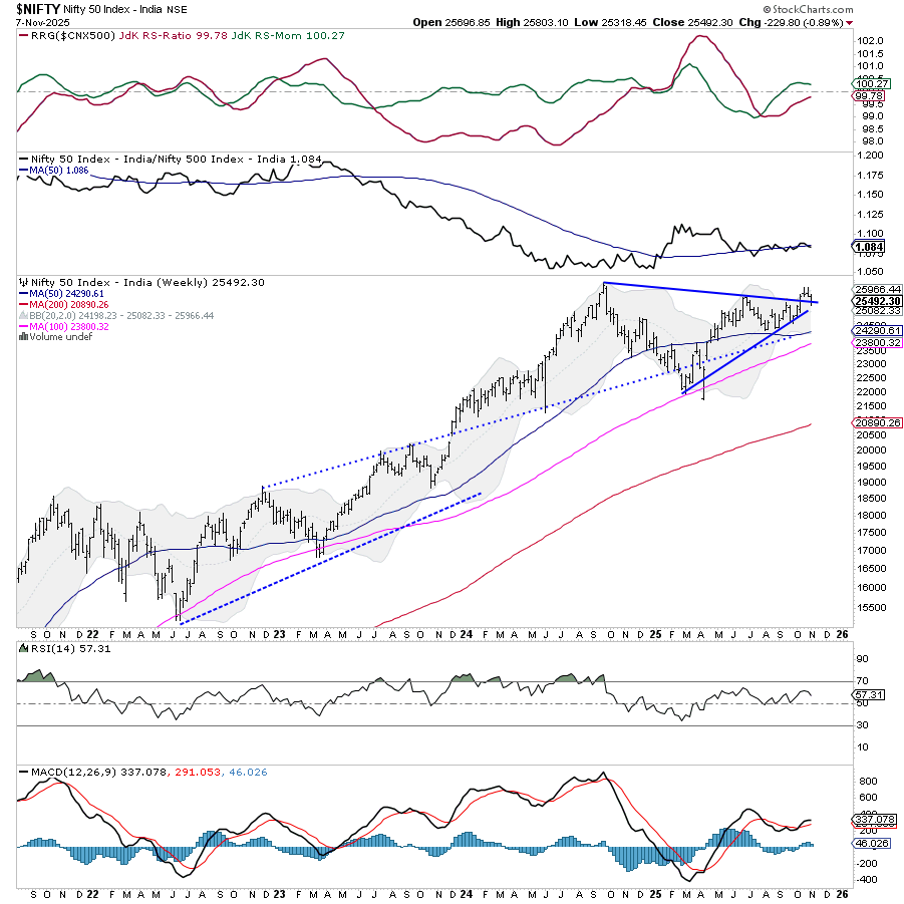
The markets traded in a broadly consolidative manner over the past week, staying within a defined range while witnessing some volatile intraday swings. Despite a strong intraday rebound of over 200 points from the lows on Friday, the Nifty closed the week on a negative note. All throughout, the index oscillated in a range of 484.65 points, finding support at 25,318.45 and marking a high at 25,803.10. The volatility gauge, India VIX, inched higher by 3.33% on a weekly basis and closed at 12.56, indicating a mild rise in hedging activity and trader caution. The Nifty ultimately ended the week with a net loss of 229.80 points or -0.89%.
The broader technical structure reveals that the Nifty is in a state of flux, currently contending with a critical resistance zone just above 25,700. The index continues to test the upper rising trendline of a broad symmetrical triangle pattern. While no decisive breakout or breakdown has occurred, this zone continues to act as a strong overhead barrier. The markets are not trending decisively for now; the price action remains range-bound and reactive. A move above 25,800-25,950 may trigger a fresh leg of uptrend, while any slip below 25,300 could open up incremental downside towards 25,000 and below.
Given the previous week ended with a sharp intraday recovery, we could see a potentially stable start to the coming week. However, follow-through strength will be essential to confirm any bullish intent. On the higher side, resistance is expected to be encountered at 25,700 and 25,850 levels. Supports are expected near the 25,300 and 25,100 zones.
The weekly RSI stands at 57.30; it remains neutral and does not show any divergence against the price. It continues to maintain its bullish range, which reflects continued underlying strength. The weekly MACD is still above its signal line, maintaining a positive crossover, which suggests that the momentum still favors bulls in the larger context. No major candlestick reversal pattern has emerged on the weekly chart.
From a pattern perspective, the Nifty remains just above the breakout point of the broad symmetrical triangle formation, and the price action is hovering just above the upper boundary of this formation. The index has managed to stay above its key moving averages (20-week, 50-week, and 100-week), which have now started to flatten and turn upward, lending underlying support. However, failure to decisively break out of the triangle resistance keeps the current setup vulnerable to profit-taking at higher levels.
In the week ahead, it is expected that markets will remain highly stock-specific. Traders should avoid aggressive positioning until a clear breakout above 25,750 is seen. Protecting profits at higher levels and adopting a measured approach will be essential. Caution is advised in fresh long exposure; instead, a selective approach towards relatively stronger sectors and stocks should be preferred. The best way to navigate the coming week would be to stay light, trail stop losses diligently, and await directional confirmation.
Sector Analysis for the Coming Week
In our look at Relative Rotation Graphs®, we compared various sectors against the CNX500 (NIFTY 500 Index), representing over 95% of the free-float market cap of all the listed stocks.
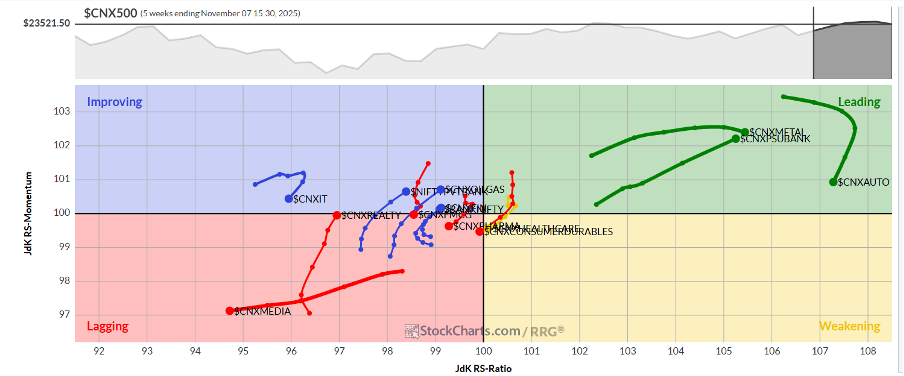
Relative Rotation Graphs (RRG) show NIFTY Auto, Metal, and PSU Bank Indices inside the leading quadrant. The Auto group is slightly slowing down on its relative momentum; however, all three of these groups are likely to continue relatively outperforming the broader Nifty 500 Index.
The Nifty Midcap 100 Index again remains inside the weakening quadrant; it may stay sluggish in terms of relative performance.
The Nifty Energy, Financial Services, Realty, Banknifty, and Infrastructure Indices are inside the lagging quadrant. However, these sectors are showing good improvement in their relative momentum and can be expected to lag the broader markets, as well as improve on their relative momentum. The Media, Services Sector, Pharma, FMCG, Commodities, and Consumption Indices are also inside the lagging quadrant; these groups are set to underperform the broader markets.
The Nifty IT and the PSE Indices are inside the improving quadrant but struggling to keep up their relative momentum.
Important Note: RRG™ charts show the relative strength and momentum of a group of stocks. In the above chart, they show relative performance against NIFTY500 Index (Broader Markets) and should not be used directly as buy or sell signals.
Milan Vaishnav, CMT, MSTA
Consulting Technical Analyst
www.EquityResearch.asia | www.ChartWizard.ae


