What Staples, Silver, and Semis Are Telling Us Now

Key Takeaways
- XLP's largest five-day gain since the COVID lows and Silver's 21% surge in just four days are rare events.
- The surge in Consumer Staples and Silver highlights a growing appetite for defensive and inflation-sensitive areas, while software continues to lag with a clearly bearish structure.
- Relative strength within sectors matters more than ever.
With so much recent attention on Energy, it would be easy to miss what’s been happening in the Consumer Staples Select Sector SPDR Fund (XLP). Quietly, however, this corner of the market has started to stand out. Through Wednesday, XLP is up more than 7% over the past five trading days. This may not sound particularly dramatic in absolute terms, but it is extremely significant for XLP.
As the chart highlights, this marks the largest five-day advance for XLP since the COVID lows. Before that, you’d have to go all the way back to March 2009, or even earlier during the heart of the 2008 bear market, to find a move of a comparable size.
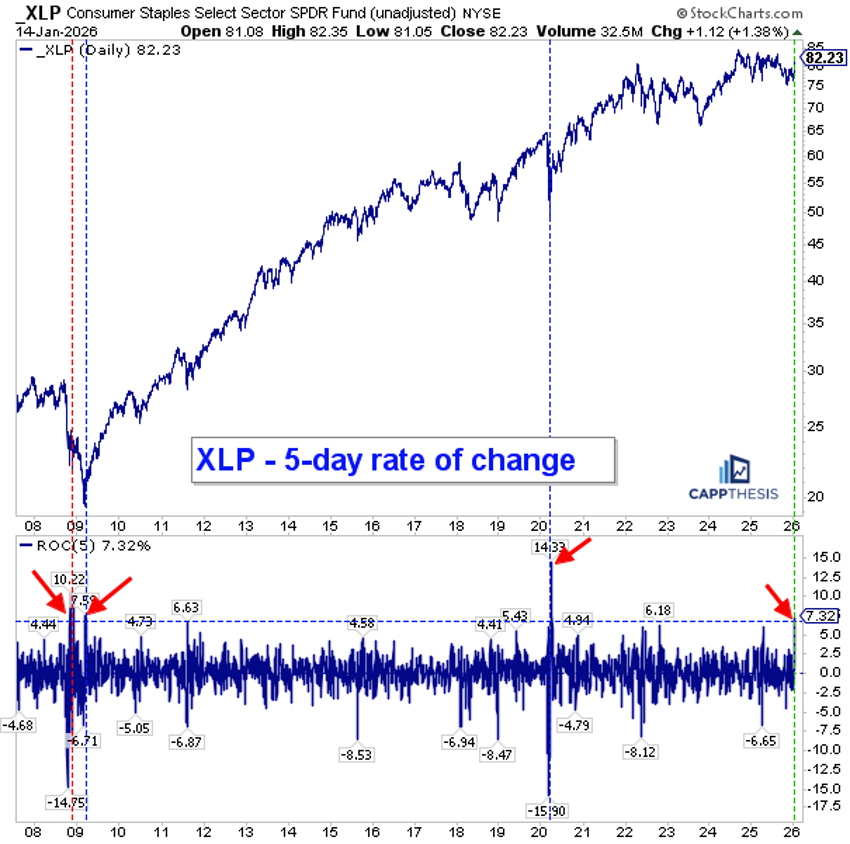
In other words, moves of this size are not something we typically see near highs, which is where XLP is currently trading. It underscores a meaningful shift to buying defensive, safe-haven sectors. Whether this surge develops into something more durable remains to be seen, but it is a clear outlier move for what is usually a relatively quiet part of the market.
Silver Up 21% in Four Days
Sticking with the theme of outsized multi-day moves, Silver has been on a tear, up roughly 21% over the last four trading days. This is an extraordinary move, even for an area that has already been rallying for some time.
Looking back over the past 20 years, four-day gains of 20% or more have occurred only three other times. Two occurred in 2020 — one near the COVID lows and another a few months later — while the third came at the tail end of 2008.
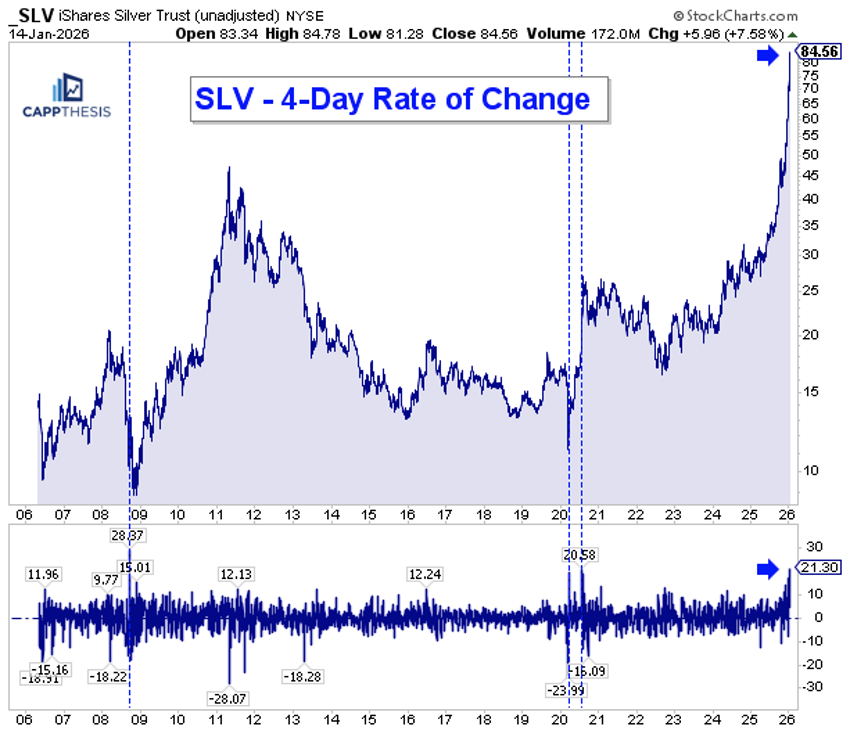
The 2020 surge marked a key top, whereas the late-2008 move occurred close to a major bottom. In other words, these extreme advances have historically coincided with important inflection points. Regardless, even though Silver has been performing exceptionally well on a longer-term basis, a move of this magnitude is not sustainable. The key question now is how price responds once the next round of profit-taking begins.
SLV: Overbought but Not Extreme
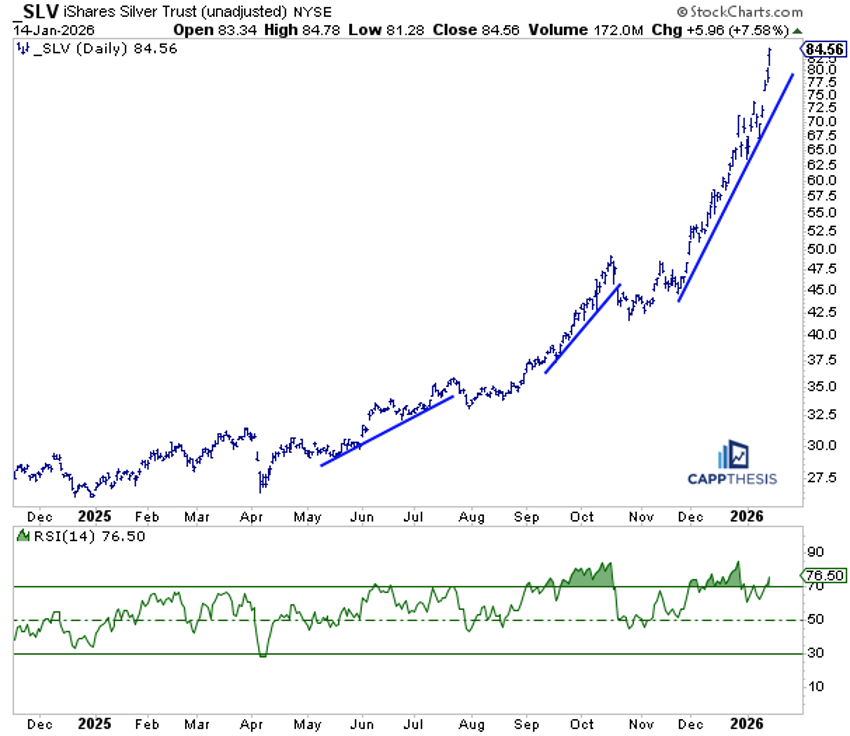
Ironically, even after the massive four-day advance, Silver’s 14-day Relative Strength Index (RSI) has not yet returned to the highest levels seen over the past few months.
While an RSI reading near 76 is elevated, it remains below the 80+ readings hit just weeks ago, and below those seen in October ahead of the prior pullback. At the same time, the already-steep uptrend line that began in November has accelerated further over the last four days, underscoring just how sharp this recent move has been.
IGV: A Bearish Pattern
The iShares Expanded Tech-Software Sector ETF (IGV) has been struggling for a while, having shifted from a position of relative strength to one of clear relative laggard status after topping back in early September.
Recent rally attempts have amounted to little more than short-term bounces, and as a result, a clear bearish head-and-shoulders pattern has developed with a downward-sloping neckline. This represents one of the most bearish structural setups possible, particularly given the lack of meaningful near-term support at current levels.
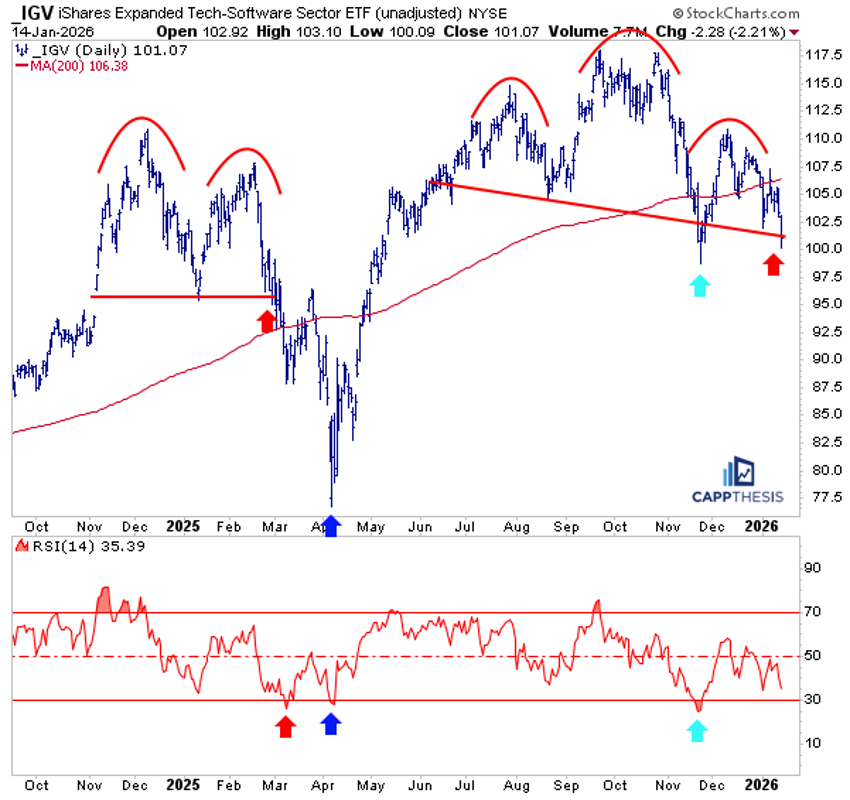
We saw a similar pattern play out in late February during the tariff tantrum, which produced a sharp downside move. The current setup bears a notable resemblance. At a minimum, it’s a risk that deserves close attention.
Semis: Strength Where It Counts
The VanEck Semiconductor ETF (SMH), on the other hand, continues to behave differently, and in a good way. As is clear on the chart, since breaking out in late December, SMH has yet to revisit its breakout zone, which sits near the 370 area. That level is important, as it represents the prior highs that repeatedly capped upside attempts in both October and early December. Taken together, that price action has formed a well-defined bullish Cup-With-Handle pattern. With the pattern fully activated, the resulting upside objective points toward the 435 area.
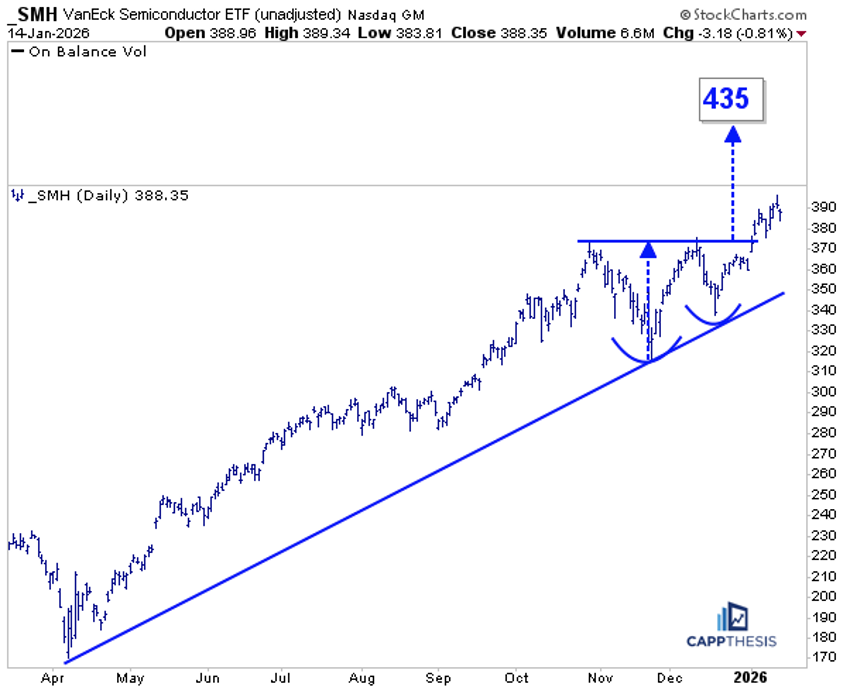
Instead of pulling back to test former resistance, SMH has continued to extend above the breakout this time. All of this has occurred above a key rising trendline drawn from the April lows, reinforcing the strength of the broader uptrend.
There has been plenty of discussion around sector rotation as a necessary ingredient for the market to move higher, and rightly so. However, what receives far less attention is intra-sector rotation. The stark contrast between the price structure of SMH and IGV highlights this dynamic clearly.
Once again, this reinforces a recurring theme: Aligning with relative strength matters. SMH’s ability to break out, hold above former resistance, and continue higher underscores how positioning within the strongest areas of the market has paid off, even as rotation occurs beneath the surface.


