When Market Leaders Falter: What Recent Moves in the Magnificent 7 Mean for Investors

Due to the severe overconcentration in our major equity benchmarks, where the Magnificent 7 stocks wield an outsized impact on the performance of the S&P 500, it has become essential for investors to understand and appreciate their technical configurations. To paraphrase as a common political saying, “As goes the Mag7, so goes the market!”
Today, we’ll consider four of these leading growth names from a technical perspective, focusing on their performance around recent earnings reports and highlighting key takeaways for the coming weeks.
The Biggest Winners Experienced Post-Gap Selling
Nvidia (NVDA) is really the only Magnificent 7 stock that has not reported earnings yet, as they are scheduled for November 19th. But the stock rallied in the first half of the week along with the rest of the semiconductor group. But after gapping higher on Wednesday, we noted NVDA closed near the lows of the day on both Thursday and Friday.
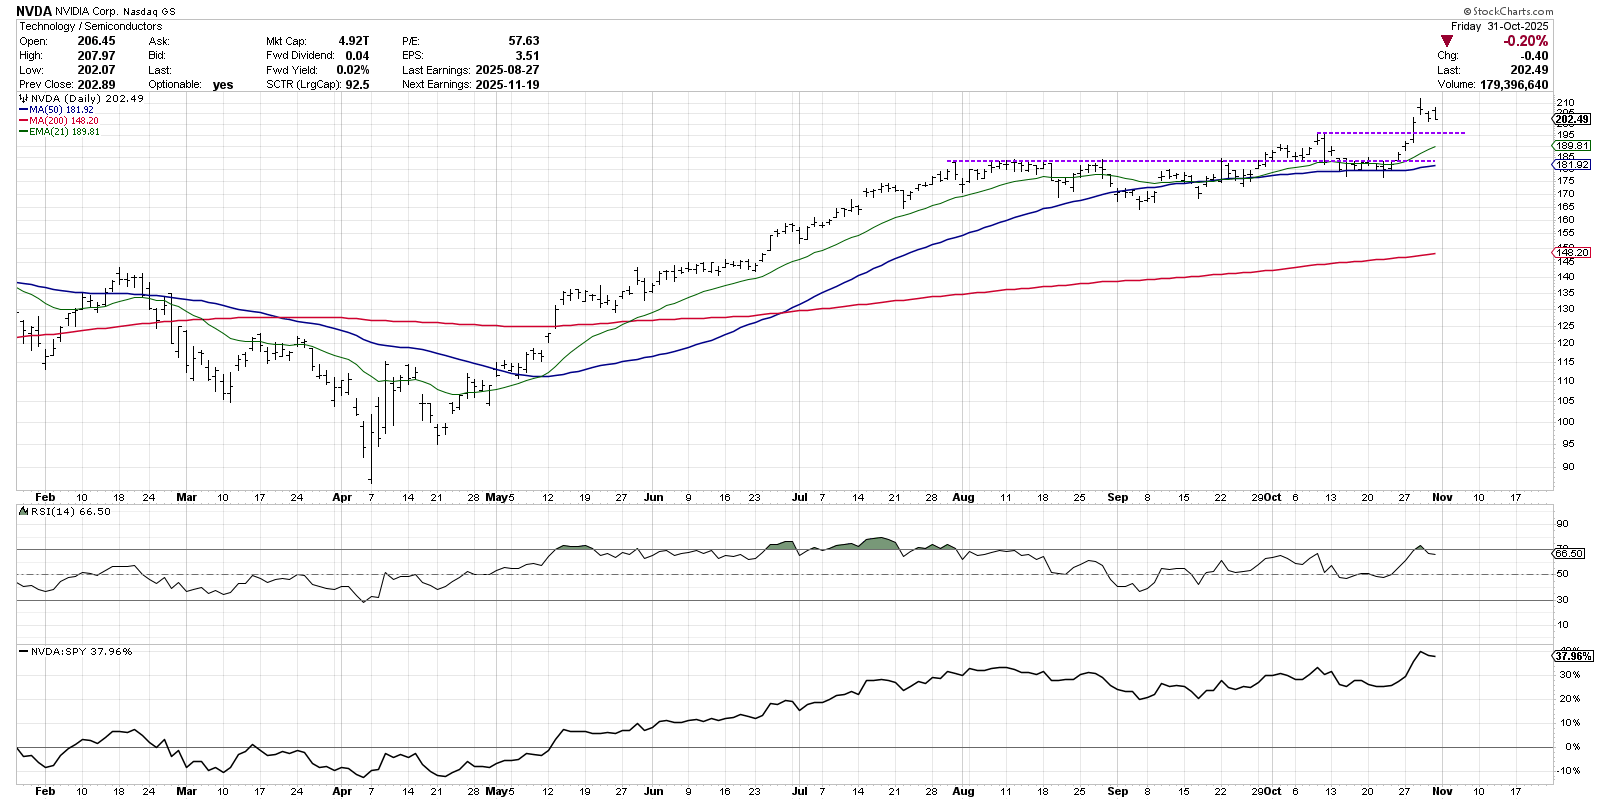
When a stock like Nvidia gaps higher, we’re looking for a “gap and run” pattern. When investors are motivated to buy more of a stock even after a gap higher, this upward momentum can drive the next big rally phase. Going into the weekend, however, NVDA featured more of a “gap and fail” pattern, where the gap higher was met with plenty of selling pressure.
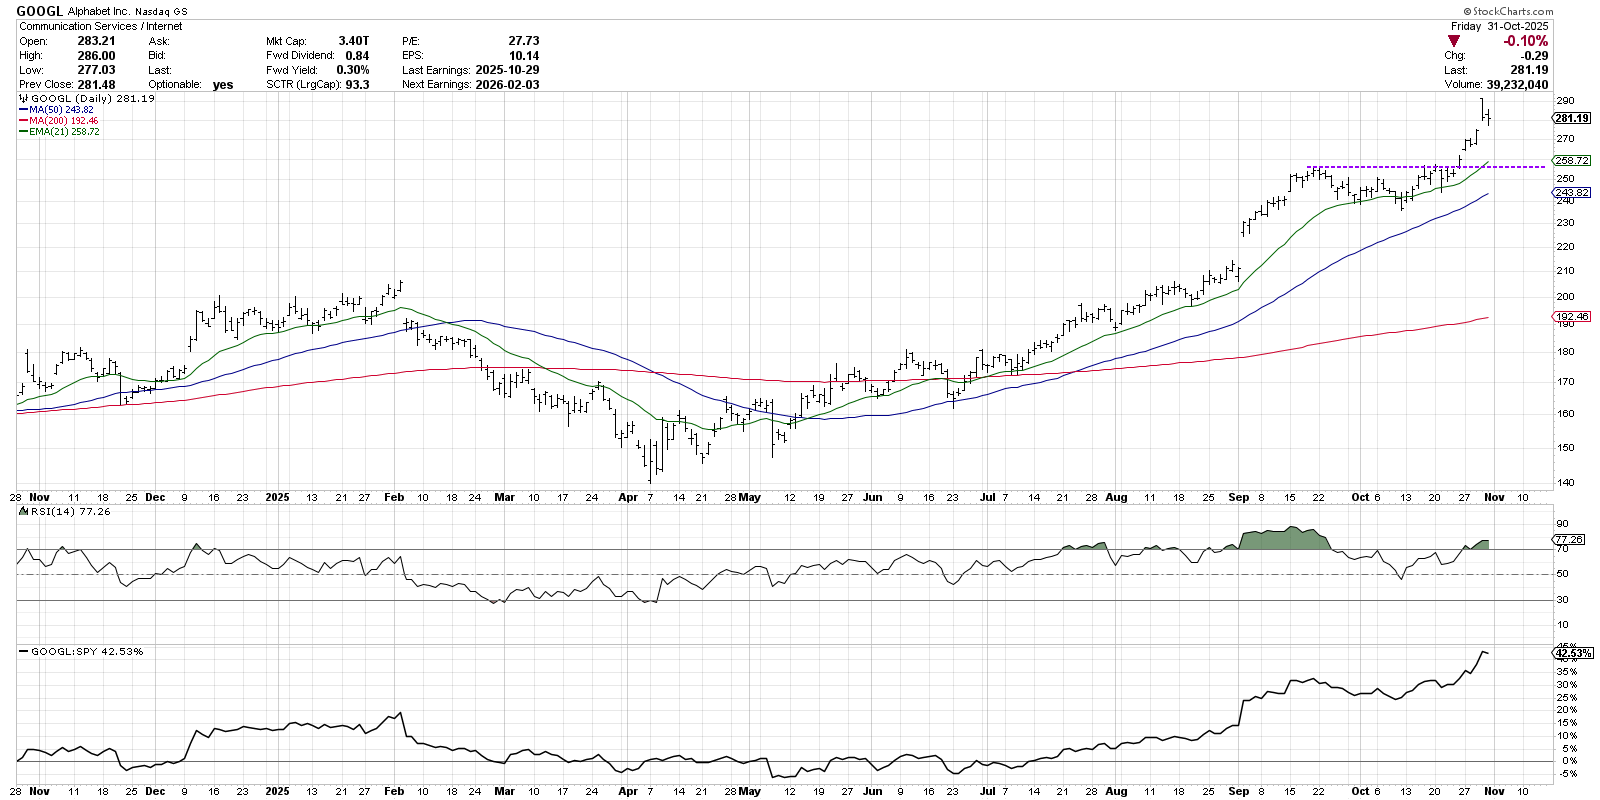
Shares of Alphabet (GOOGL) had already established a new all-time high the previous week, with a break above the September high of around $255. After a strong earnings report this week, GOOGL gapped up to open Thursday above $290. Then the stock closed near the lows of the day on both Thursday and Friday, indicating a lack of buying power going into the weekend.
The 21-day exponential moving average can serve as a fantastic initial warning sign of a trend reversal. If stocks like Nvidia and Alphabet can hold their recent breakout levels, and also remain above the 21-day EMA, then they will still be in a primary uptrend despite the weaker action into the end of October.
Trend Channels Can Help Identify Potential Resistance
Apple (AAPL) opened higher on Friday after an encouraging earnings report, but closed out near the lows of the day. What’s interesting about this particular chart is that AAPL features a clear uptrend channel of higher highs and higher lows.
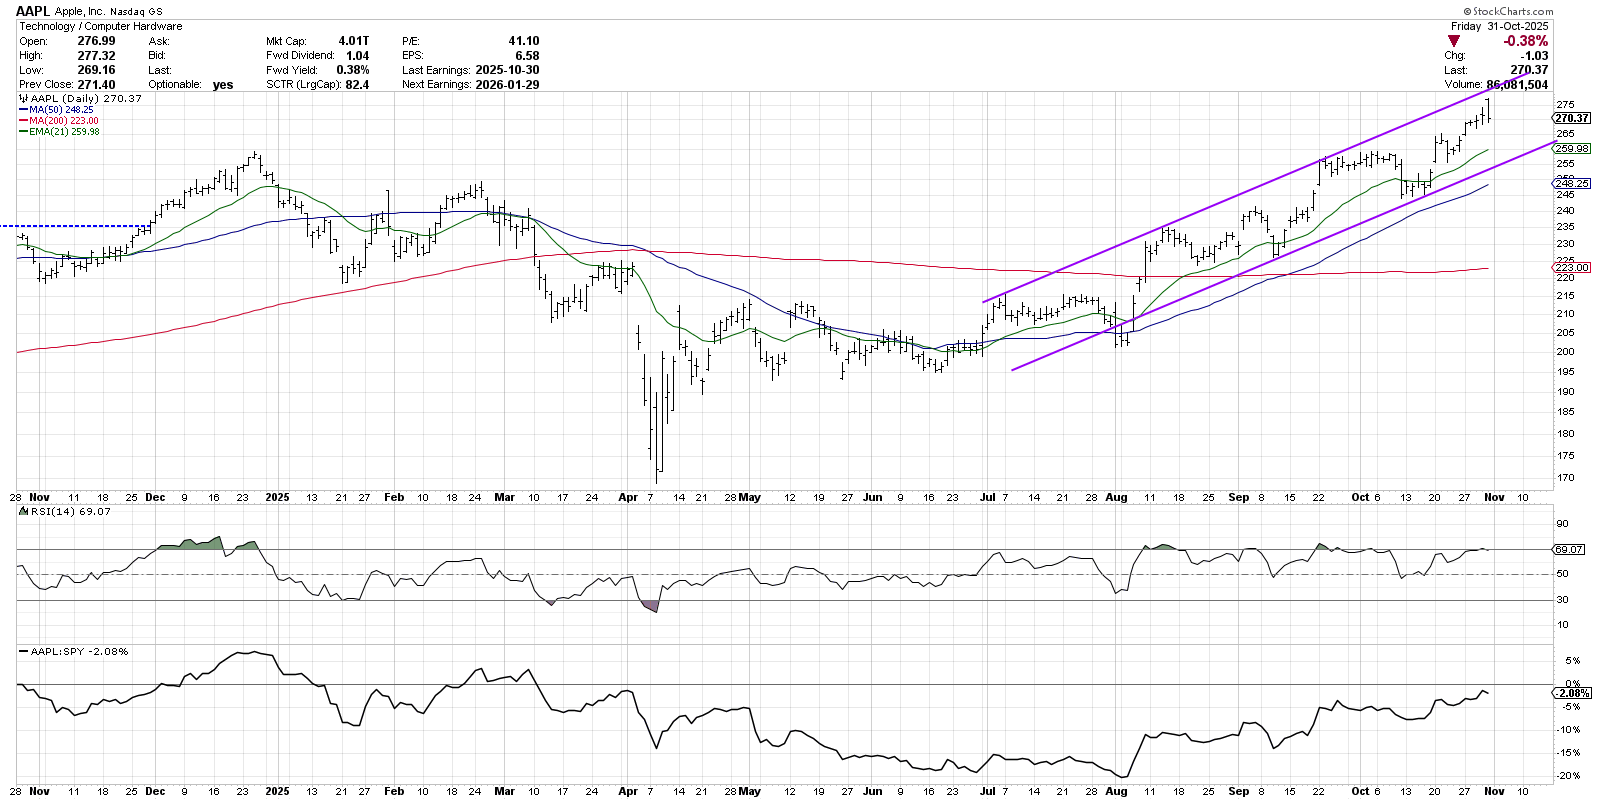
By connecting the swing highs in July and August, we can see that the trendline resistance lines up quite well with the late September peak around $257. Extending that channel further, we can see that this week’s rally on earnings expectations took AAPL right up to the upper boundary of this four-month trend.
Similar to the previous charts, we’ll be monitoring the 21-day EMA as a potential short-term support level. But on the chart of Apple, we also have trendline support based on the trend channel, which comes in around $260. We would consider the primary trend for AAPL to remain bullish as long as it can remain within this bullish trend channel structure.
Sometimes Support Levels Just Do Not Hold
While a number of the Magnificent 7 stocks remain firmly in bullish trends, we also have names like Meta Platforms (META) that digested an earnings miss this week. META has arguably already been in a downtrend since the August peak, with a clear pattern of lower highs and lower lows going into this week.
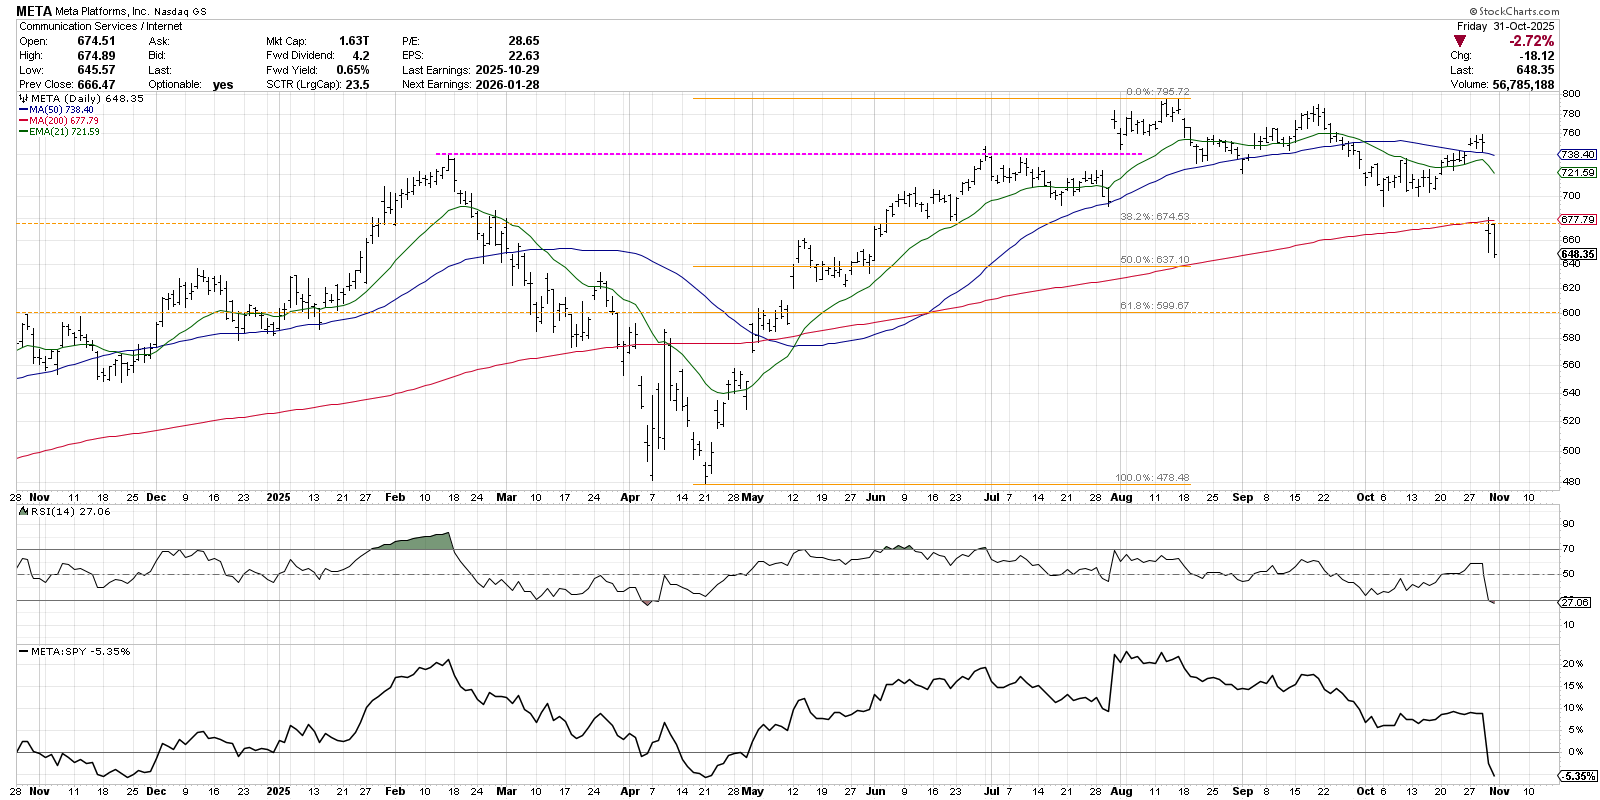
After regaining the 50-day moving average on Monday and holding that level going into the Wednesday earnings release, META gapped below the 200-day moving average on Thursday. Friday saw even further selling, with the stock finishing the week below the 200-day MA and a 38.2% retracement level based on the April to August uptrend.
With a chart like META, I’m inclined to consider this chart “guilty until proven innocent” based on the weaker price action and meager momentum readings. Note that on that rally earlier this week, the RSI never reached above the 60 level. With limited upside momentum, that set the stage for a strong drop after an earnings disappointment. Our next downside objective around $600 is based on a 61.8% retracement using the same uptrend as above.
With mixed results on earnings this week, it appears that there is plenty of diversification within the Magnificent 7 stocks. With a consistent process of reviewing the charts and a disciplined application of trend-following concepts, investors can manage risk in case these previous leaders start to really deteriorate into November!
RR#6,
Dave
P.S. Ready to upgrade your investment process? Check out my free behavioral investing course!
David Keller, CMT
President and Chief Strategist
Sierra Alpha Research
marketmisbehavior.com
Disclaimer: This blog is for educational purposes only and should not be construed as financial advice. The ideas and strategies should never be used without first assessing your own personal and financial situation, or without consulting a financial professional.
The author does not have a position in mentioned securities at the time of publication. Any opinions expressed herein are solely those of the author and do not in any way represent the views or opinions of any other person or entity.


