Will Santa Keep on Giving? Or Will the Grinch Finally Come to Wall Street?
The last few years have seen stock prices rocket to stratospheric levels, to the extent that when we hear comments on bubbles, we have a natural tendency to be justifiably concerned. Indeed, we would be foolish to ignore the unprecedented speculation and excessive valuations that form part of the current investment environment.
In my view, it’s unquestionably a bubble. The good news though, is that bubbles rarely burst when there is widespread concern about them, as is currently the case. Bubbles generally unravel under a background of deceptive and unrealistic forecasts, where buyers run out of money or are forced to meet margin calls. Common triggers emanate from rising interest rates or a curtailment of credit from elsewhere in the system. The last time I checked, credit was relatively abundant, and rates were in a downward trajectory – more like a bubble blowing, rather than a bursting, environment. So, what is the market saying?
Chart 1 shows that two of the major averages have been moving sideways since September. The S&P, in the upper window, looks as if it may be forming a head -and-shoulders top. However, if it moves much higher, the pattern will be cancelled. Since patterns that do not “work” are typically followed by an above-average move, the implication would be for a significant extension to the recent rally.
The NYSE, on the other hand, touched a very marginal record, closing high on Friday. If we see an early December rally that turns this tentative penetration into a decisive one, it would mean the normally sluggish NYSE Composite had completed a right-angled broadening formation. This is alternatively known as a broadening formation with a flat top.
Regardless of what you call them, such formations are typically followed by very powerful price moves relative to their size. They are really bullish inverse head-and-shoulders patterns that are so positive there is no time to form the right shoulder.
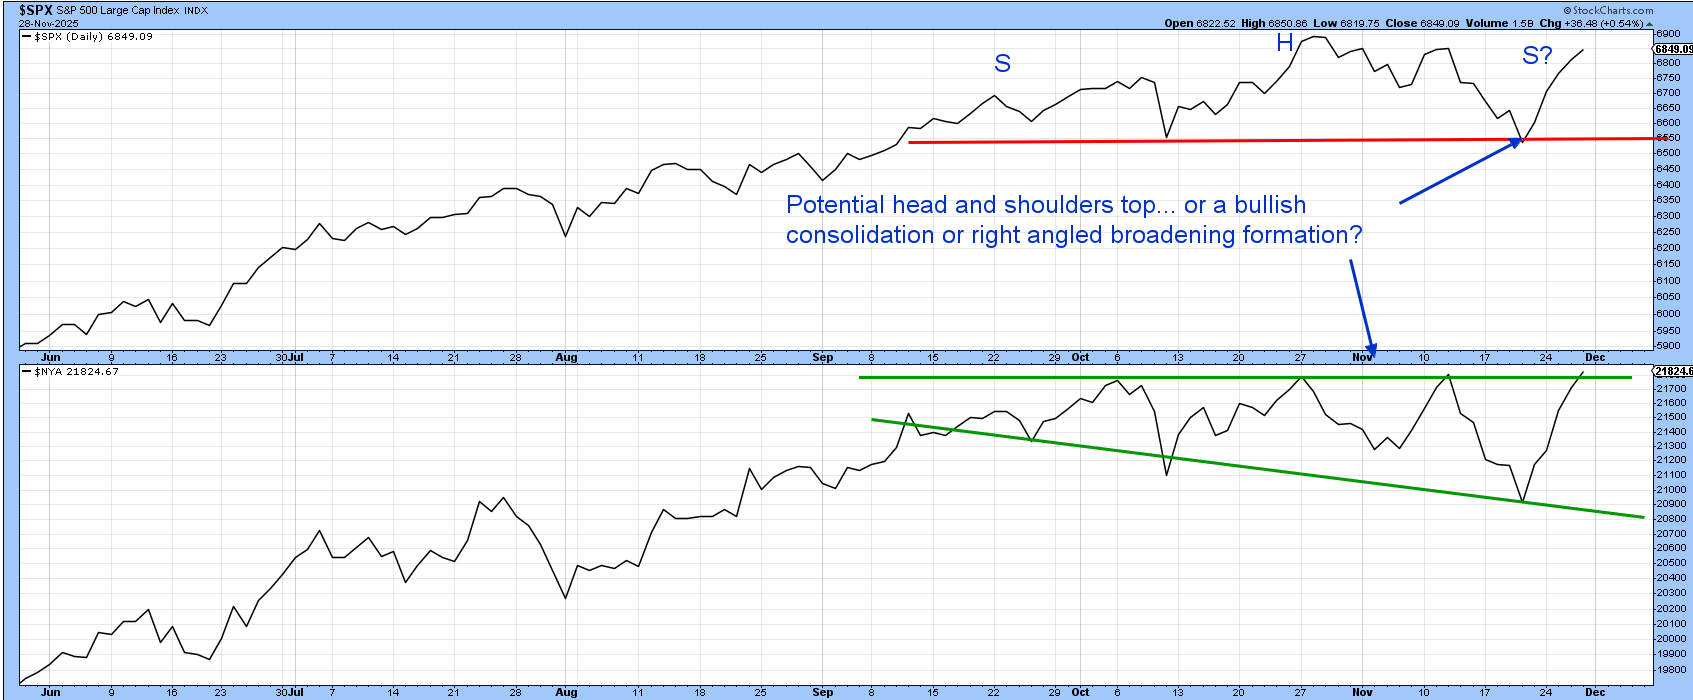
Chart 2 compares the S&P to an A/D Line constructed from common stocks, as well as the regular NYSE A/D Line. The common stock version experienced a false downside break in November below both its up trendline and 200-day MA; it has since rebounded above its post-September down trendline. For its part, the regular A/D Line is poised to complete a broadening formation of its own. If so, that would be a very positive development. What, then, are the chances that will happen?
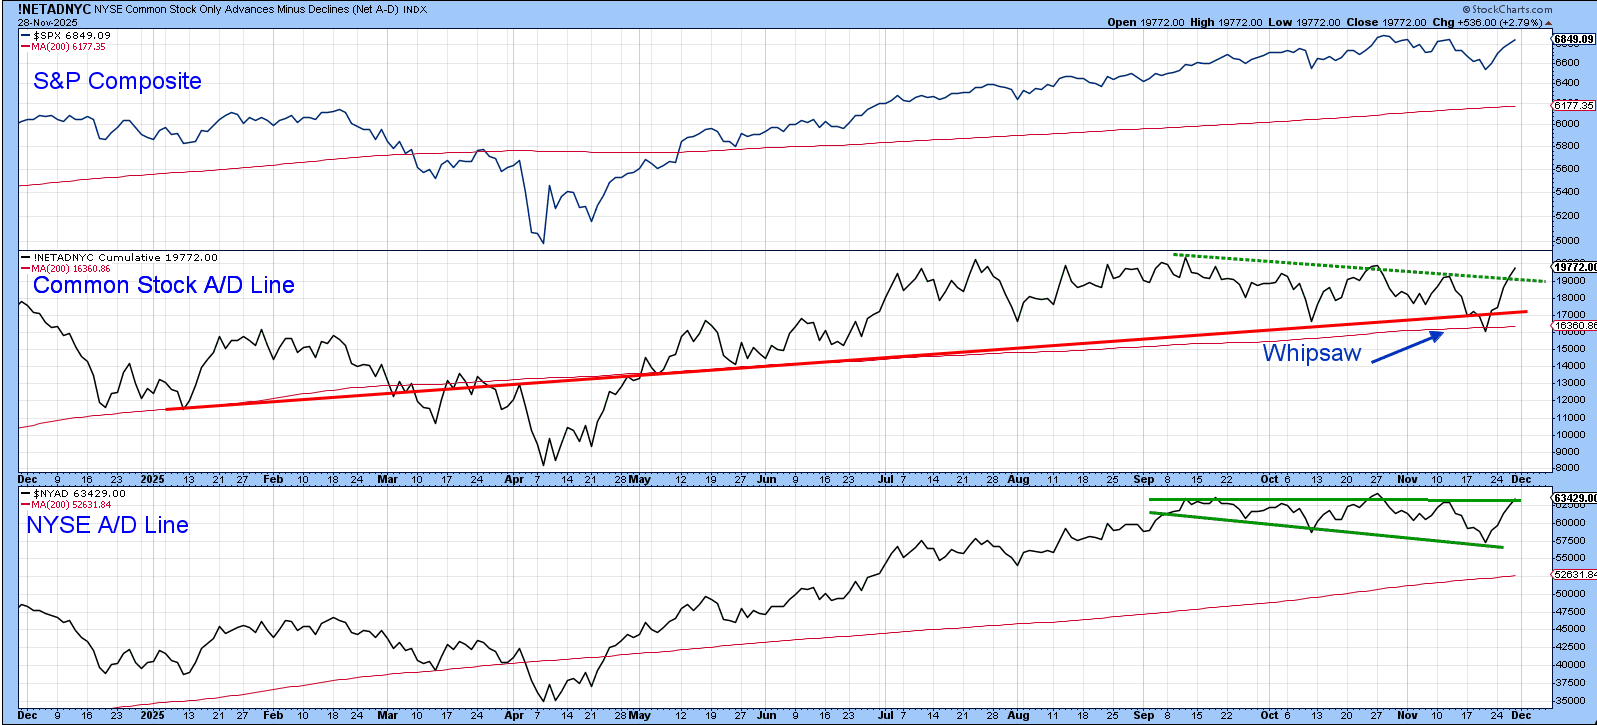
Chart 3 tells us that when the major averages were moving sideways earlier in the fall, the raw percentage of NYSE stocks trading above their 50-day MA fell from 80% to a recent low of 30%. A 10-day MA version of this indicator has been plotted in Chart 2. That deterioration tells us that most stocks have already undergone a significant correction and should be ready to renew their uptrends. The indicator itself has just crossed above its MA for a tenth bullish signal since 2022. One caveat; if the S&P fails to respond to the bullish primary trend indicators discussed above and completes the head-and-shoulders top, that would confirm a huge negative divergence, thereby signaling a nasty decline.
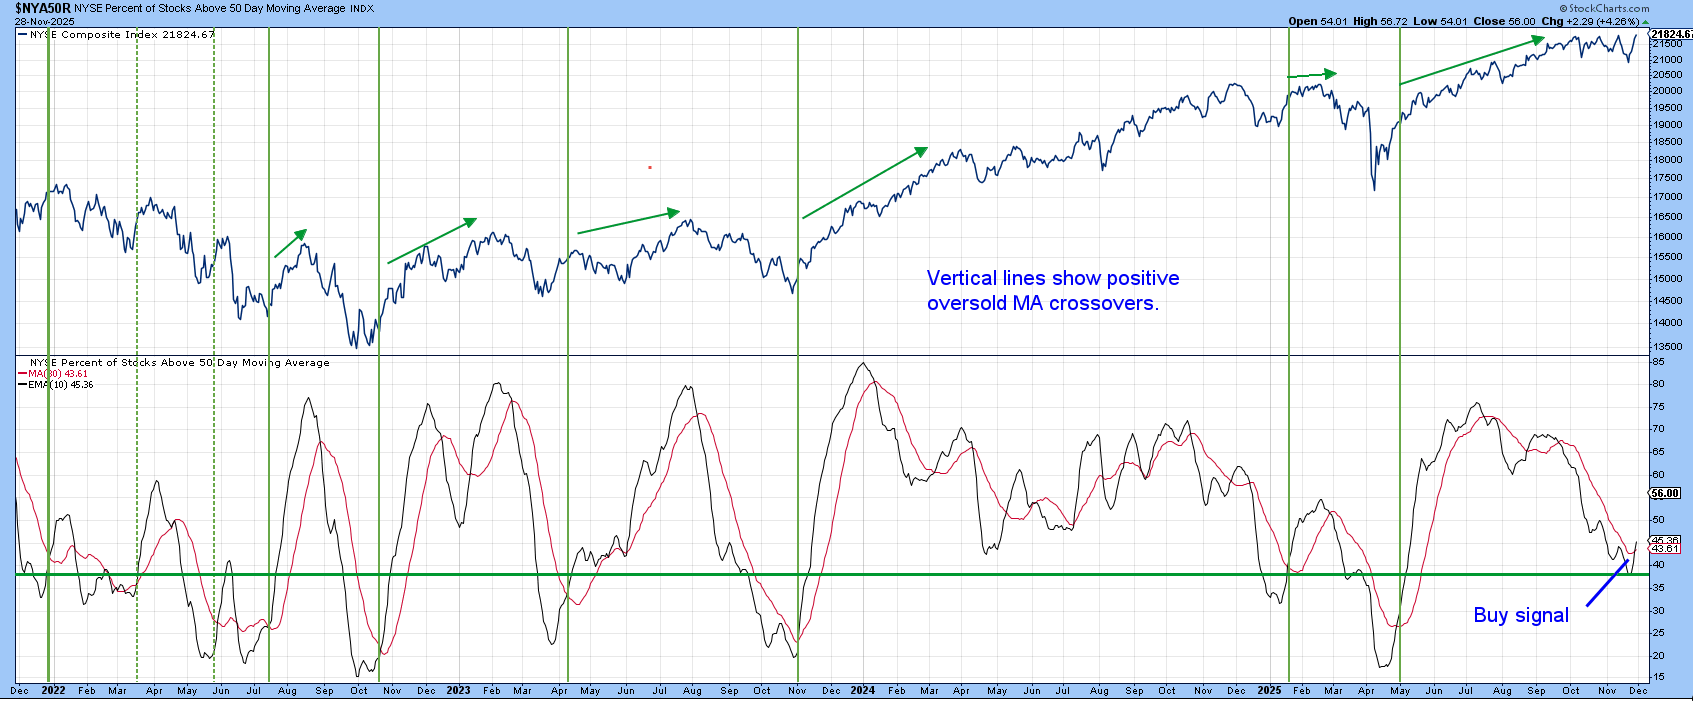
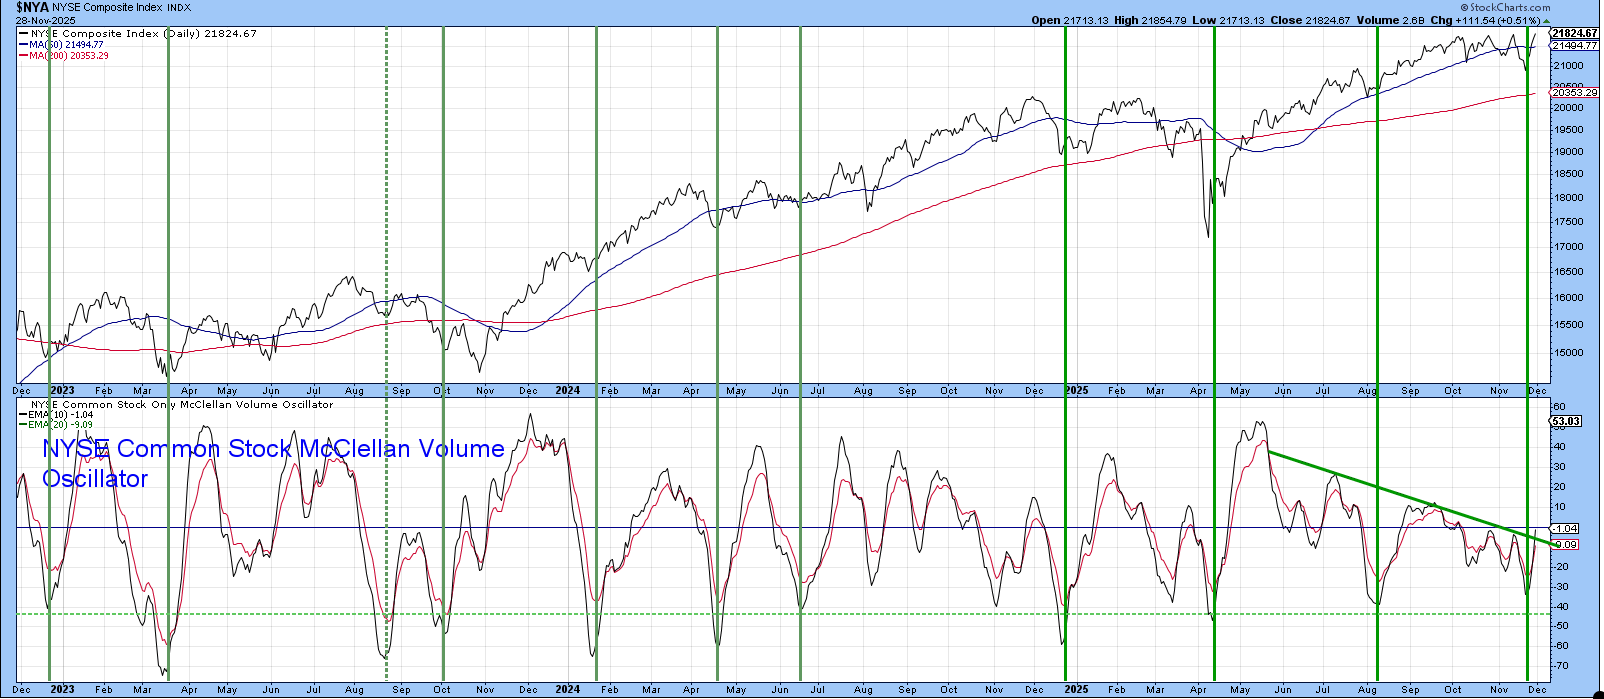
Chart 4 features a 10-day MA of the NYSE McClellan Volume Oscillator. It generally has a shorter-term time horizon, but, even so, the vertical lines indicate that oversold upside reversals have consistently been followed by an advance lasting above 2 weeks. The indicator did not quite reach overstretched territory in November, but has rallied back above a 7-month down trendline, which suggests that it is headed higher.
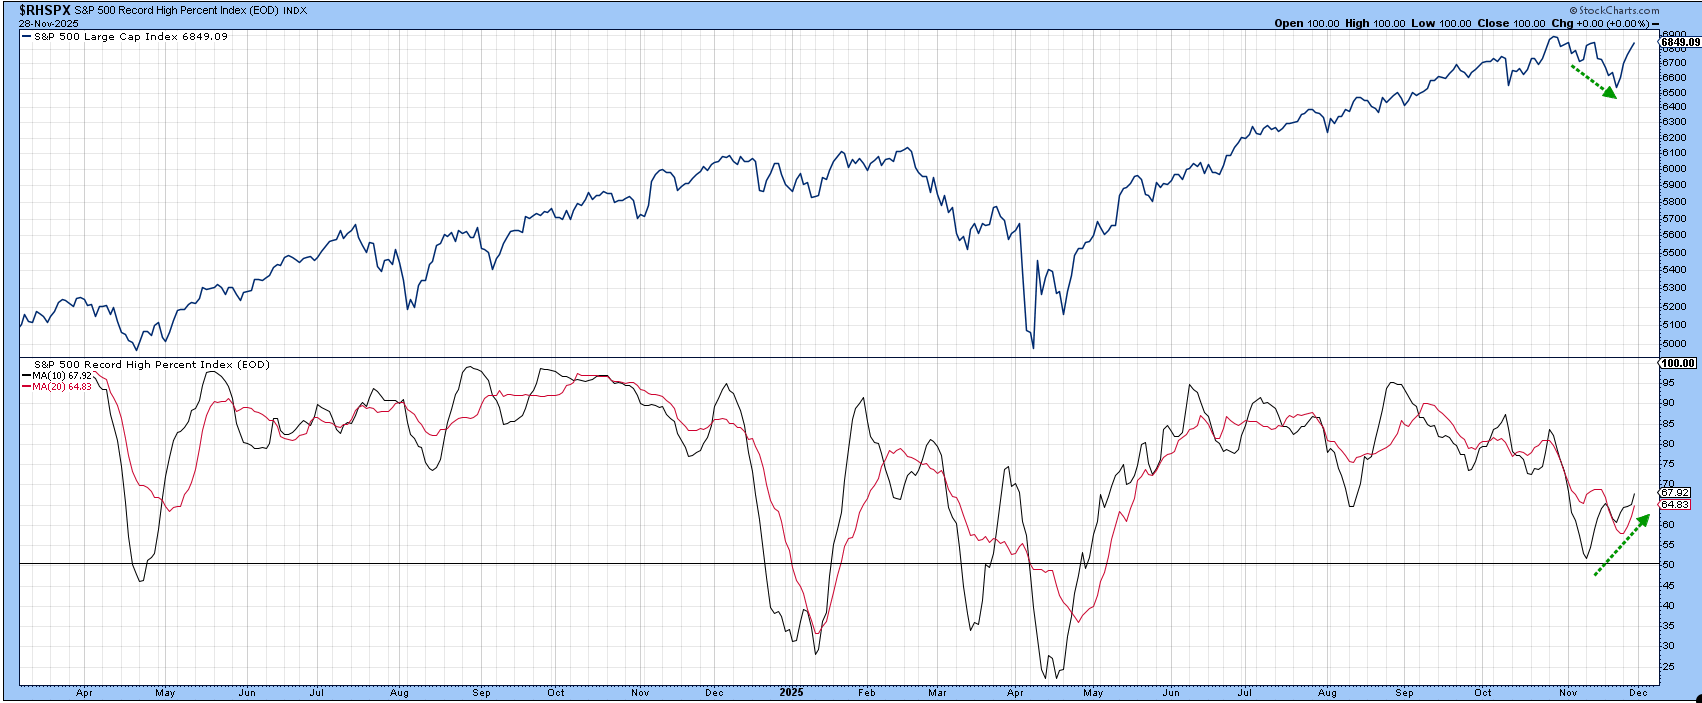
Finally, the NYSE Record High Percent Indicator, seen in Chart 5, experienced an unusual positive divergence with the S&P as it fell to its late November correction low. The indicator itself has decisively crossed above its MA and looks headed higher.
Conclusion
The S&P and NYSE Composites have reached resistance. That may cause them to back off a little, but the position of three internal breadth indicators suggest they will soon push through resistance and barrel ahead.
Good luck and good charting,
Martin J. Pring
The views expressed in this article are those of the author and do not necessarily reflect the position or opinion of Pring Turner Capital Group of Walnut Creek or its affiliates.


