Will These Broken Charts Overcome Bearish Divergences?

Toward the end of a bullish phase, a bearish momentum divergence can often provide a prescient sign of an impending top. While the price action continues to drift higher, the weaker momentum readings fail to confirm the new price high. This lack of momentum support suggests an exhaustion of buyers, providing low confidence that the uptrend phase will continue.
We recently highlighted three stocks demonstrating bearish momentum divergences, including a game plan for confirming the potential breakdown. Today, we’ll check in on how these charts have evolved and focus on how we can identify potential entry points for the next rally phase.
Watch For a Price Breakdown After the Divergence
The chart of Genuine Parts Co. (GPC) provides an almost textbook example of the bearish momentum divergence. Note how new highs in July and August saw the RSI at or near the overbought threshold, but the new high in September saw the RSI fail to reach the 70 level.
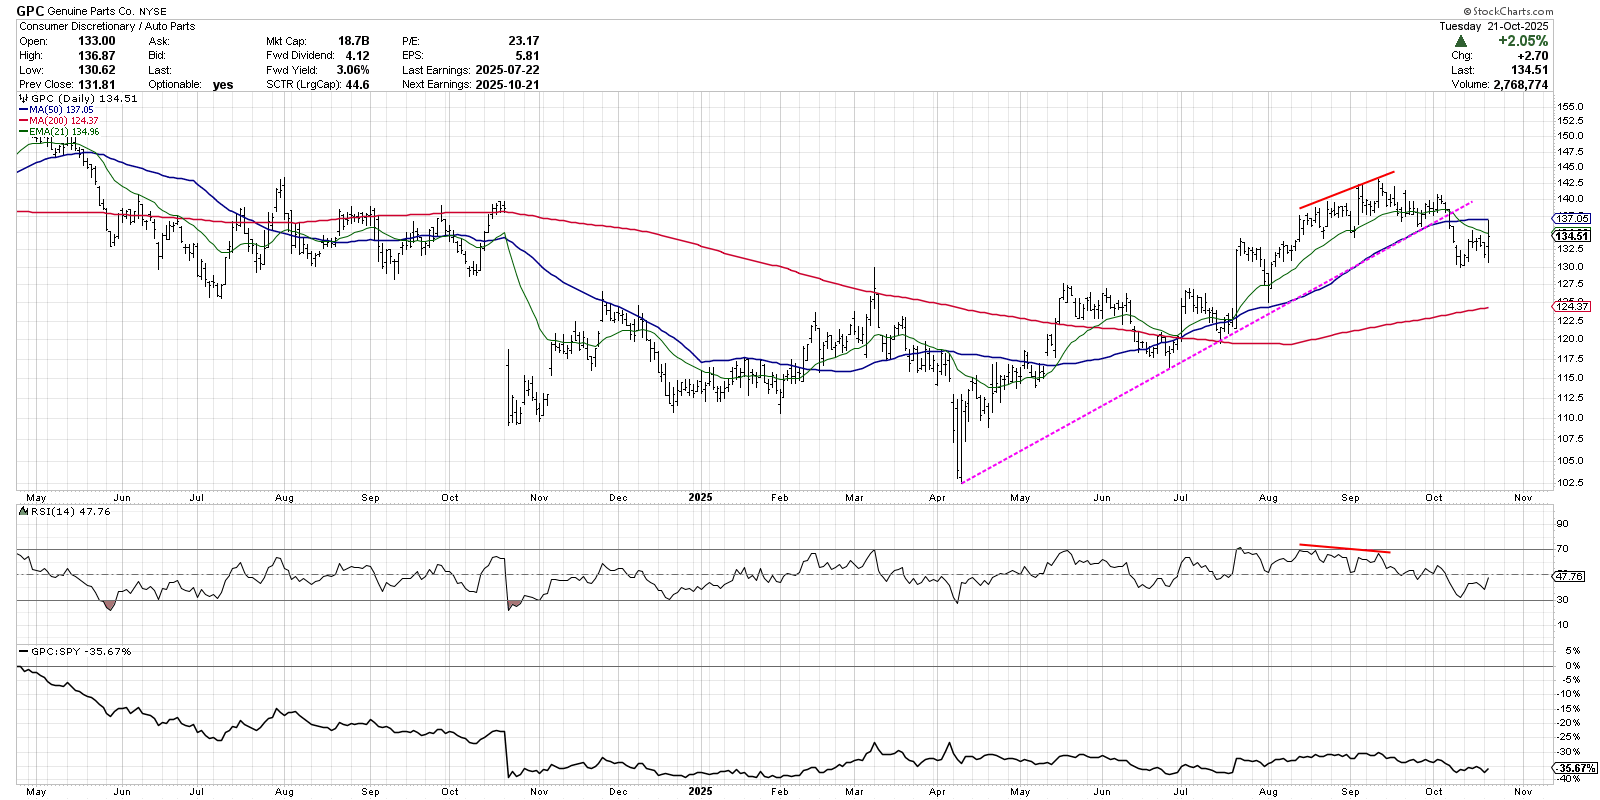
Soon after the divergence, GPC failed to hold the 21-day exponential moving average on the next pullback. For me, the 21-day EMA provides an excellent initial trailing stop, and the breakdown at this level after a failure to achieve a new swing high served to confirm at least a short-term top.
Genuine Parts later broke below the 50-day moving average, as well as a trendline based on the major lows in April, June, and July. The RSI also broke below the 40 level, indicating that momentum had rotated to a more bearish tilt. If GPC can recover back above the 50-day moving average, currently around $137, that could indicate enough of a recovery to regain the September high.
The Chandelier Exit System Can Help Confirm a Breakdown
I’ve also used the Chandelier Exit system to validate a breakdown after a bearish momentum divergence. Similar to how we’d use the 21-day EMA, the Chandelier Exit is based on Average True Range. This means the indicator can provide a more dynamic stop, as it adjusts based on the stock's normal trading range.
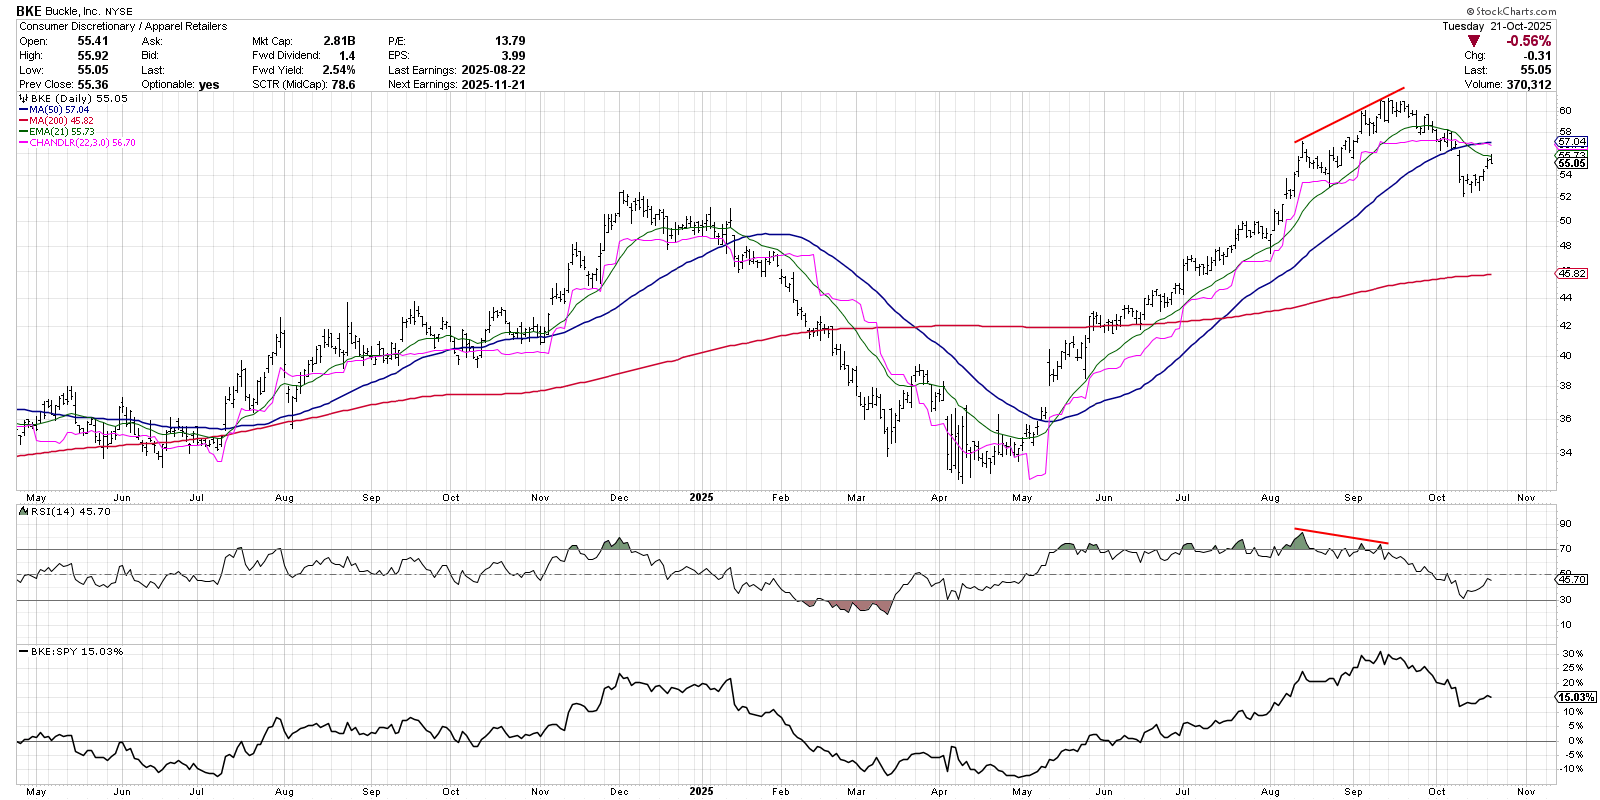
After the April 2025 low, Buckle (BKE) pounded out a consistent pattern of higher highs and higher lows. All along the uptrend phase, there were a number of pullbacks that all remained safely above the Chandelier Exit. Soon after the bearish momentum divergence in September, BKE finally broke below the Chandelier Exit as well as the 21-day EMA. As the RSI pushed below 40, we had a new confirmed bearish trend for this apparel retailer.
While Buckle has experienced a brief bounce off the $52 level, the price is still below the 50-day moving average. The RSI has turned higher, but still sits below 50, which indicates negative momentum. Until and unless BKE can push above the 50-day moving average on stronger momentum readings, I’m inclined to consider the chart “guilty until proven innocent.”
Trend Channels Can Help Provide Structure to Trend Analysis
Outfront Media Inc. (OUT) displayed a classic trend channel off its April low, with parallel trendlines tracking the swing highs and lows into September. After the bearish momentum divergence into the August high, the stock traded down to the lower channel line. But a breakdown of this trendline support confirmed that the uptrend channel was no longer valid.
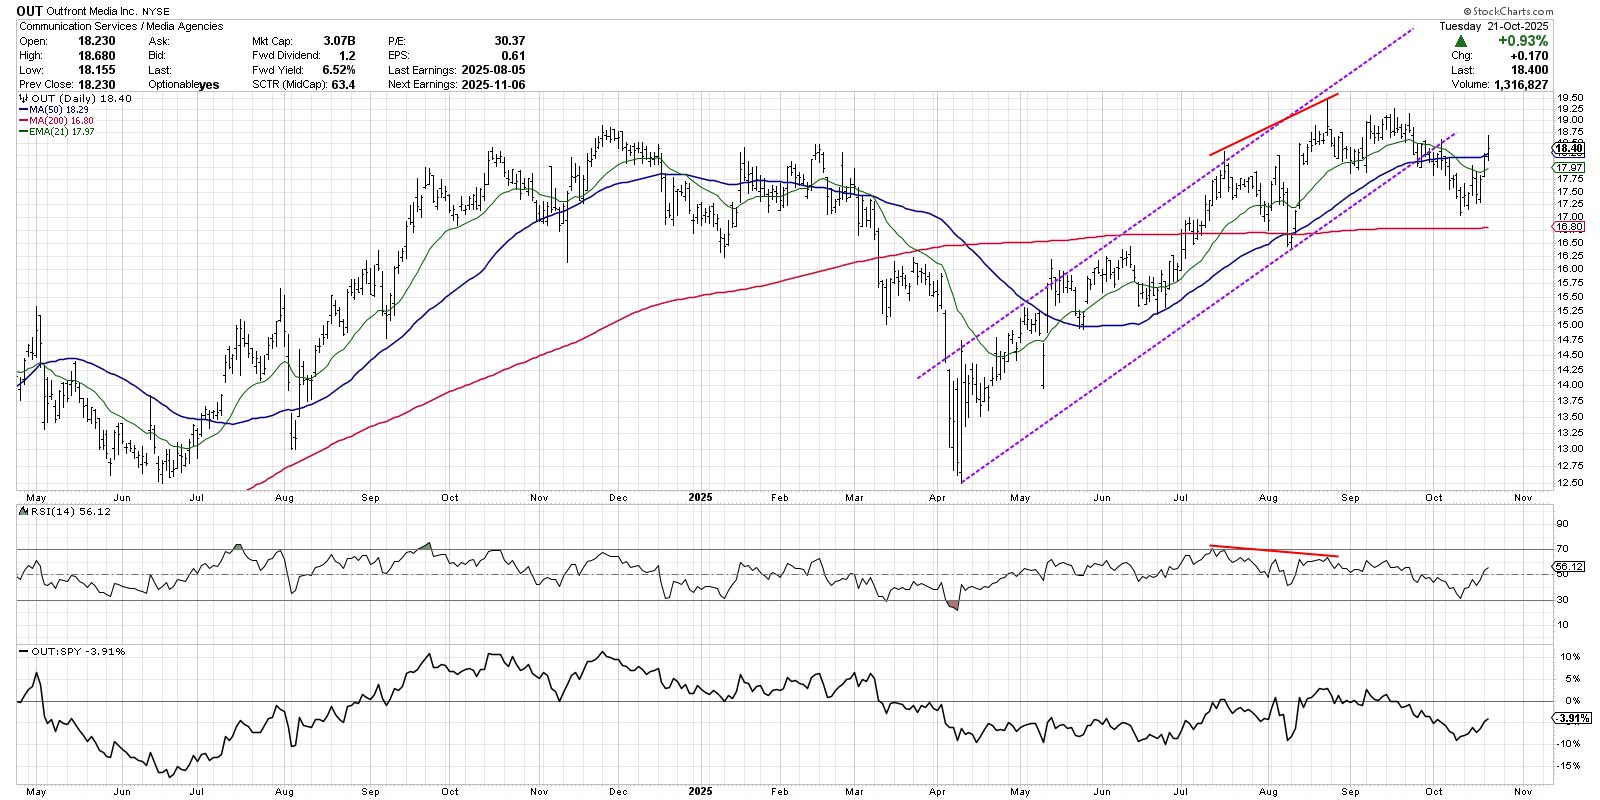
This is the only chart of the three that has now broken back above the 50-day moving average. We can see that the RSI is now above 50, but has yet to push above the 60 threshold. For a recovery to be confirmed, I would need to see stronger price action supported by improved momentum. An upside follow-through day for OUT, accompanied by an RSI moving above 60, would create a bullish configuration for this communication services stock.
Bearish momentum divergences are designed to help us identify stocks that are still in uptrends but demonstrating weaker momentum characteristics. After a breakdown occurs, it’s all about stronger price action, breakouts above moving average resistance, and supportive momentum readings. And if the chart is able to accomplish those three technical factors, then perhaps the stock deserves another look!
RR#6,
Dave
PS- Ready to upgrade your investment process? Check out my free behavioral investing course!
David Keller, CMT
President and Chief Strategist
Sierra Alpha Research LLC
marketmisbehavior.com
https://www.youtube.com/c/MarketMisbehavior
Disclaimer: This blog is for educational purposes only and should not be construed as financial advice. The ideas and strategies should never be used without first assessing your own personal and financial situation, or without consulting a financial professional.
The author does not have a position in mentioned securities at the time of publication. Any opinions expressed herein are solely those of the author and do not in any way represent the views or opinions of any other person or entity.


