The Year-End Macro Marathon: Why Every Data Point Matters & Where to Look

Key Takeaways
- A wave of delayed economic reports hits in December, with JOLTS, CPI, and the jobs report taking on outsized importance — one StockCharts resource charts it all
- Market volatility appears unusually subdued, even as key labor and inflation data could reshape expectations for 2026 policy
- Bond and mortgage markets show a curious sense of calm, with falling long-term rates offering a potential tailwind for buyers heading into the new year
The holiday season is in full swing, and the government is back open. There’s a sense of optimism for a year-end rally and even some normalcy on the data front. Maybe not surprisingly, the Cboe Volatility Index (VIX) has eased back under 17, while smaller day-to-day gyrations are discounted into the S&P 500. What’s more, traders are now locked in for a quarter-point Fed rate cut to be announced precisely a week from today.
It might take until the middle of Q1 for economic data to normalize, though. Between now and then, each official data point will carry significant weight. Timely data begins rolling in over the coming days.
For that, traders should monitor one helpful resource: Stockcharts’ Economic Indicators hub. You’ll find it in the Sample Chart Gallery, a treasure trove of graphical gems if you find the macro enlightening.
All Eyes on Jobs: The First Domino
So, what’s on the still-dis-shelved docket? The first key official data point will be the October Job Openings and Labor Turnover (JOLTS) report. The U.S. Bureau of Labor Statistics (BLS) canceled the September read, so the release due out on Tuesday, December 9, will be all the more critical. Always put out two months in arrears, we’ll find out if it backs up today’s ADP Private Payrolls takeaways.
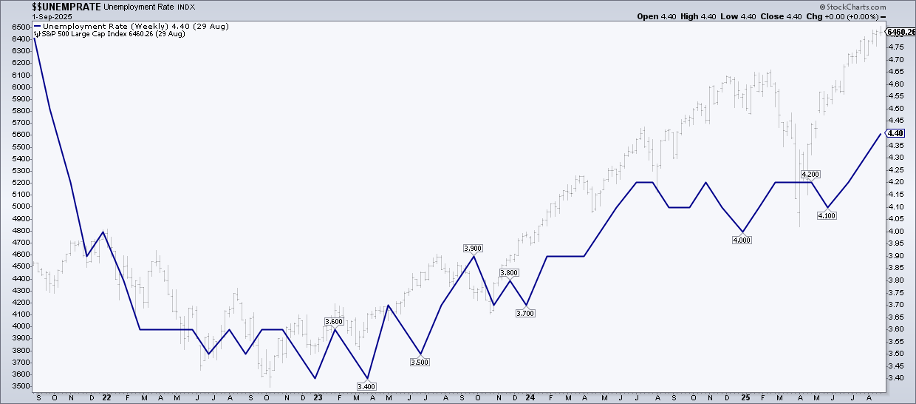
JOLTS, along with ADP Private Payrolls, Initial and Continuing Claims, Challenger Job Cuts, PMI Employment readings, and other private-sector labor market clues, all lead into the November Employment Situation report’s release on Tuesday, December 16. Recall that the now-stale September nonfarm payrolls report revealed the highest unemployment rate since October 2021.
On the Economic Indicators page, the “US Unemployment Rate” chart illustrates that a rising jobless rate has not been a headwind for the S&P 500. Both lines have trekked higher over the past three years.
US Unemployment Rate: Highest Since October 2021 (Stocks Also Up)
A Reheated Inflation Story?
Next on tap is the November Consumer Price Index (CPI). It publishes on Thursday, December 18. Considering that the FOMC gathers before the payrolls report and CPI update, the often-quiet mid-December stretch will be unusually impactful for upcoming interest-rate policy (namely, the January Fed meeting).
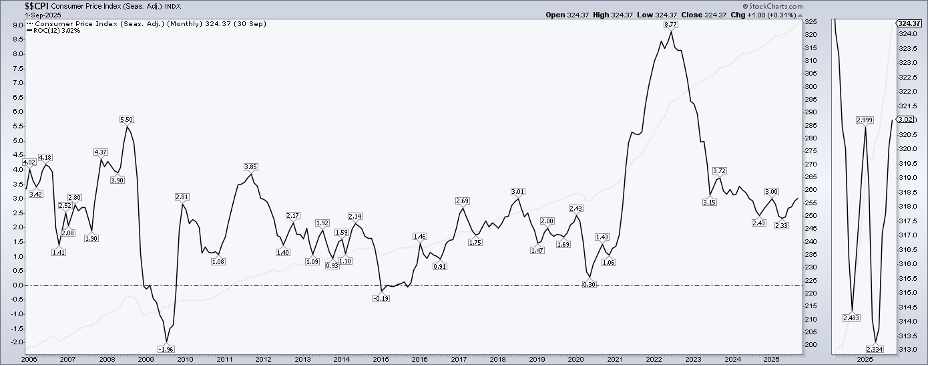
Over on the Economic Indicators page, the “Consumer Price Index (CPI)” chart displays the benchmark inflation barometer to two decimal places. The more telling line is the “ROC,” or “rate of change,” dataset. The 12-month CPI ROC peaked at 8.77% in June 2022.
Today, the inflation rate is the highest since the middle of last year. I like to apply the Zoom Thumbnail under the Attributes section of the page to focus on the more recent right side of the chart. Troubling the 12 Fed voting members is undoubtedly the nearly 70-basis-point jump in the YoY CPI rate since April.
CPI Rate Ticks Up to 3.02% YoY, Up from April
The Fed Meets—But Without the Full Picture
The jobs report and CPI make up the one-two macro punch during this earnings-light month. Some pundits argue the FOMC should push back its December meeting so that it can capture and analyze the very latest employment and inflation reports. Alas, they are still on for next week’s Tuesday–Wednesday monetary policy gathering. For investors, that means the potential for increased volatility leading into Christmas.
Other key data include November Producer Price Index (PPI) data due on Thursday, December 11; the December S&P Global Manufacturing and Services PMI (flash) on Tuesday, December 16; and the first estimate of Q3 GDP, possibly on Tuesday, December 23.
The Retail Sales Wildcard
Unknown at this time is the release of the November Retail Sales report. The U.S. Census Bureau publishes that one, and it will provide official color on just how strong consumer spending was over four of the “Big Five” holiday shopping days from Thanksgiving through Cyber Monday.
The Odd Calm in Bonds & The Case for 5% Mortgage Rates
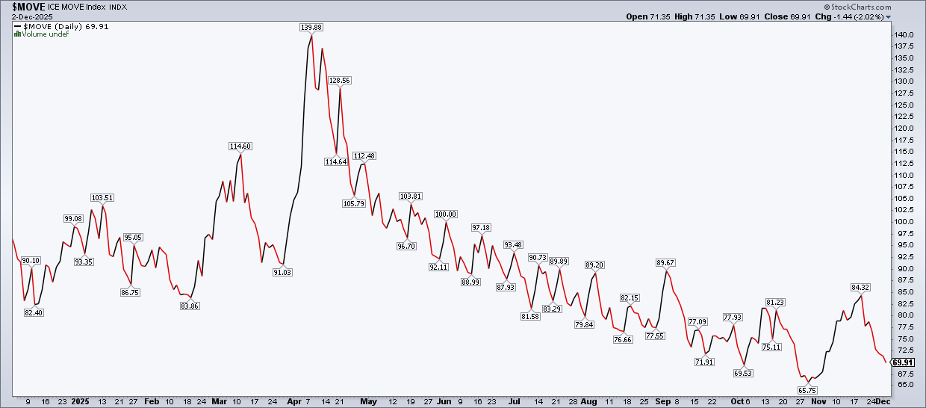
As for price action, the bond market continues to try to suss out the signal from the noise. Ironically, Treasurys appear quite stable. The ICE BofA MOVE Index (MOVE) of interest-rate volatility is near four-year lows, while the benchmark 10-year Treasury yield straddles the 4% mark — pretty much the average of the past three years.
MOVE Index: Now Sub-70
A curious sense of calm in bonds is good news for the mortgage market. And that brings us to the last Economic Indicator chart we’ll inspect.
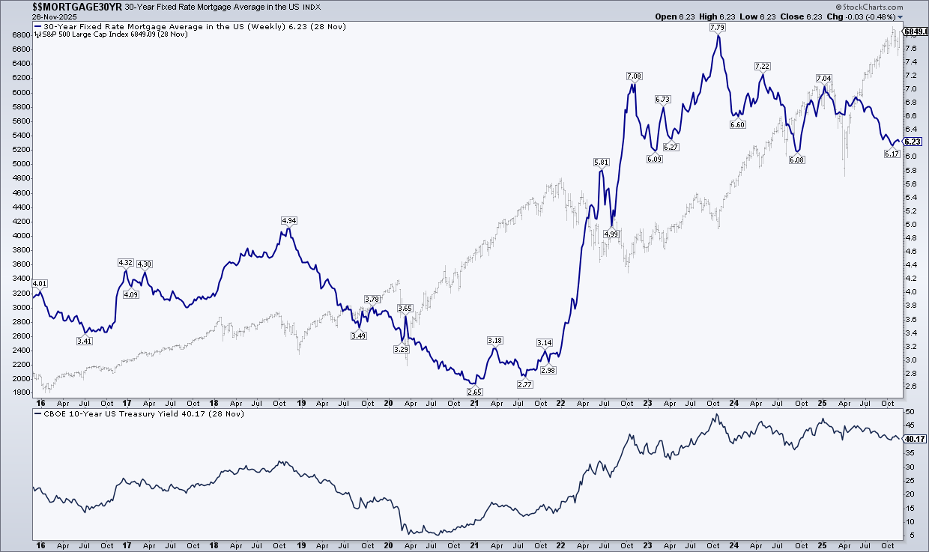
The 30-Year Fixed Rate Mortgage Rate (US Average) is close to cycle lows at 6.23% (as of the November 28 print). Going back a decade, the conventional mortgage rate notched an all-time low of 2.65% in early 2021, but then soared to 7.79% in October 2023. A 1.5-percentage-point decline to today’s level is nothing to sneeze at, and there’s hope a 5-handle will be seen at some time in 2026.
Technically, if the 10-year yield breaks into the 3s (perhaps tagging the Q3 2024 low of 3.62%), that hope might turn into reality for first-time buyers.
Mortgage Rates Gradually Easing, 10-Year Yield Steady Near 4%
The Bottom Line
I keep a close eye on the macro calendar, and to be honest, I’m still confused about which official data are set to hit the tape and which have been canceled. I’m watching the BLS page for updates and paying attention to what market price action tells us.
The StockCharts’ Economic Indicators page is a resource to lean on as jobs reports, CPI data, and other major macro clues are published.
Disclaimer: This blog is for educational purposes only and should not be construed as financial advice. The ideas and strategies should never be used without first assessing your own personal and financial situation, or without consulting a financial professional.


