Your Midweek Market Checklist: What to Watch Before the Next Breakout

Key Takeaways
- Dip buyers jumped back in on Wednesday, a sign that the market's "risk-on" sentiment is still alive.
- The S&P 500 and XLK bounced off their 21-day EMAs, keeping the uptrend intact.
- Watch the S&P 500's channel, market breadth, and alternative assets like gold and Bitcoin for the next clue on direction.
Tuesday’s stock market action gave investors a bit of a scare. Stocks and cryptocurrencies took a dive, while bonds and the U.S. dollar moved higher. These are classic signs of a “risk-off” mood. Yet just a day later, on Wednesday, the mood shifted and buyers came back, suggesting that investors aren’t ready to give up on risk just yet. The “buy the dip” mindset that’s been driving this market for most of the year is clearly alive and well.
What’s Driving the Buying?
Lower interest rates, optimism of U.S.–China trade deal, and strong corporate earnings seem to be behind investor optimism. A better-than-expected ADP jobs report and solid ISM Services data didn’t hurt either.
A Look at the Charts
From a technical standpoint, the price action is looking pretty interesting. Even though Tuesday’s selloff hit tech stocks the hardest, the major indexes held above their 21-day exponential moving average (EMA).
Take a look at the chart of the S&P 500 ($SPX) below.
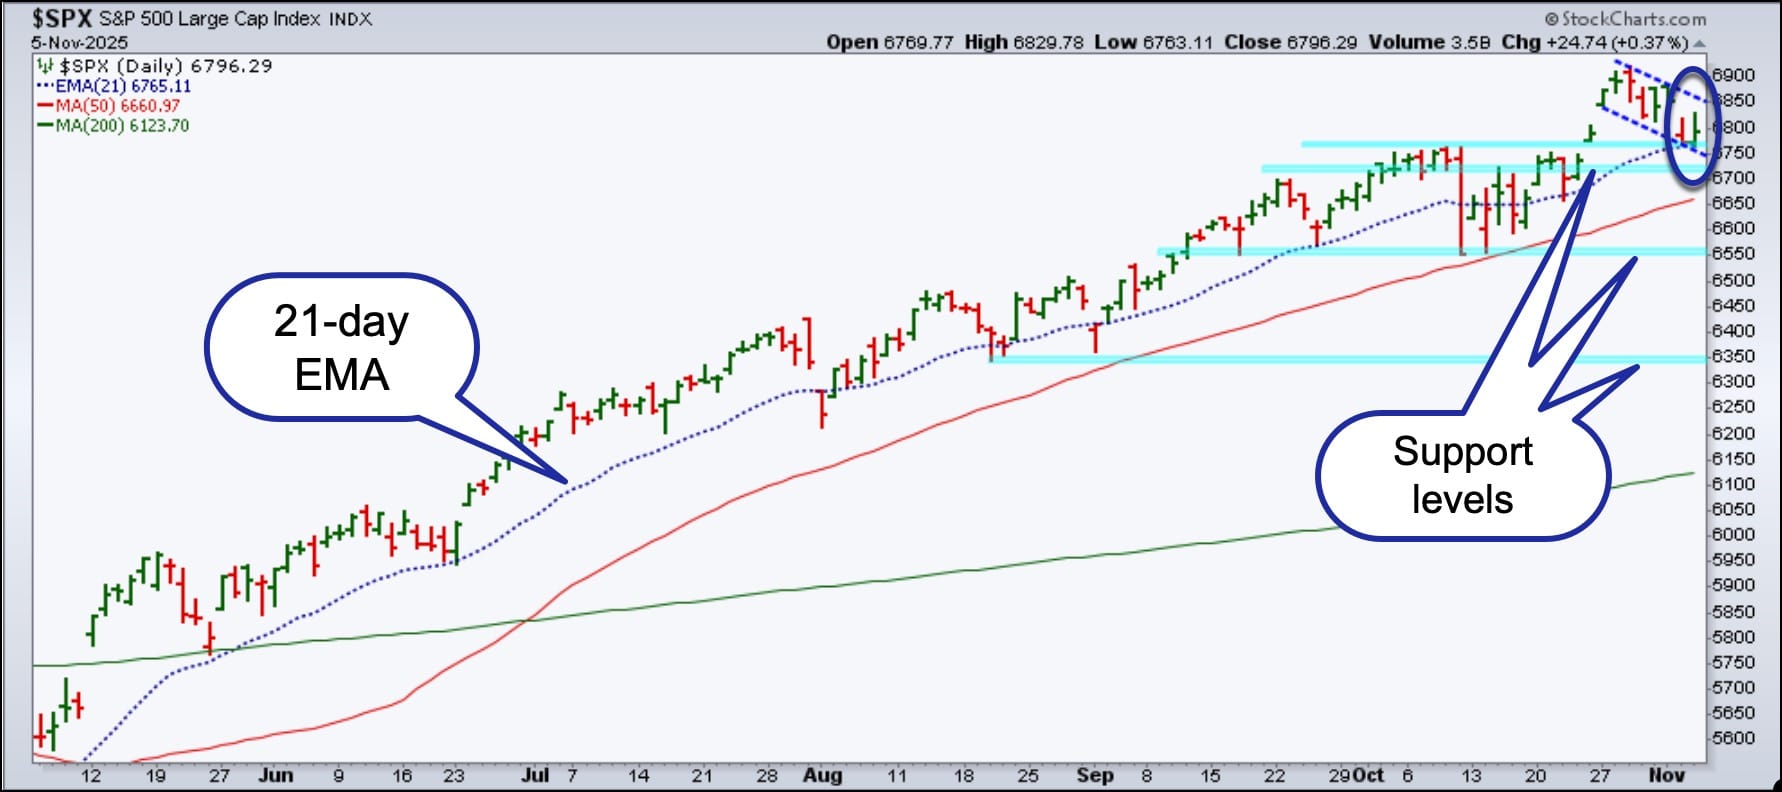
Notice how the index bounced right near the 21-day EMA, which also lines up with the highs from early October, around the time of the October 10 selloff.
If the S&P 500 can hold above the 21-day EMA level and break out of what looks like a bull flag pattern, the index could run towards new all-time highs. On the flip side, a move to the downside could take the S&P 500 close to the 6550 level.
Tech Stocks Lead the Way
If there’s one sector likely to drive the market higher, it’s technology. Let’s zoom in on the Technology Select Sector SPDR ETF (XLK).
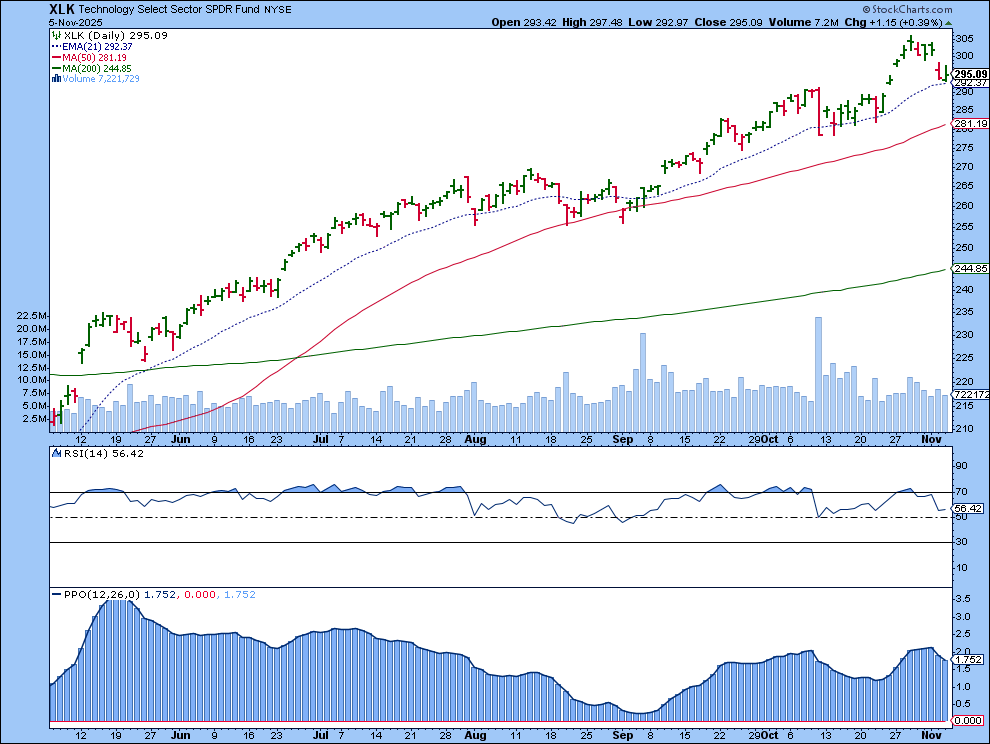
Similar to the broader market, XLK bounced off its 21-day EMA and looks ready to make a move higher. Momentum indicators such as the Relative Strength Index (RSI) and Percentage Price Oscillator (PPO) are still showing strength, even after Tuesday’s drop. In other words, tech stocks aren’t out of steam yet.
Gold and Bitcoin Tag Along
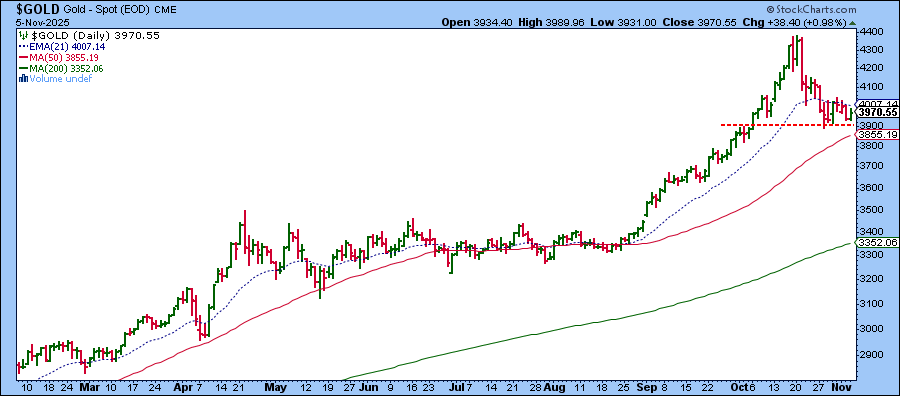
Even gold is showing some signs of recovery. After dipping below the 21-day EMA and nearly touching $4400 an ounce, it managed to stay above $3900 level. That’s a show of resilience.
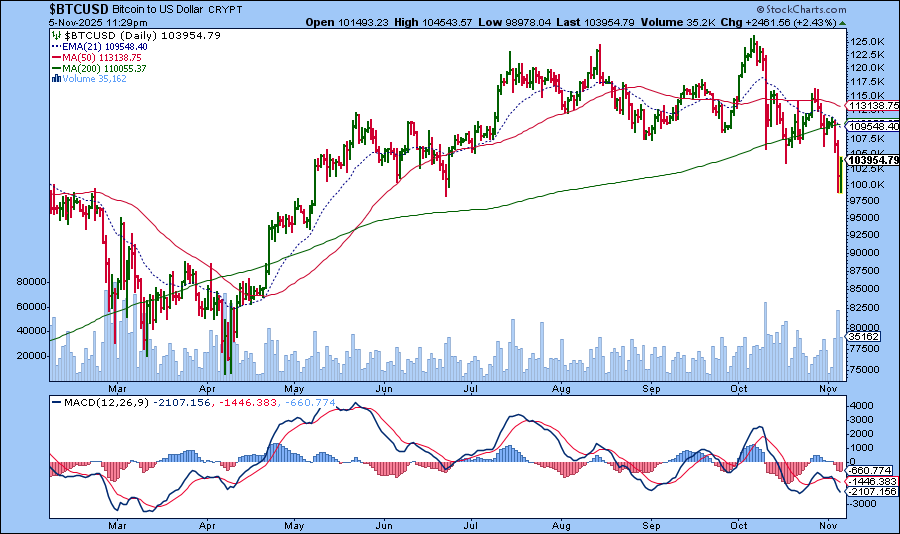
Bitcoin, on the other hand, is trying hard to stay above 100,000. The Moving Average Convergence/Divergence (MACD) shows weak momentum, and the 21-day EMA has crossed below the 50-day SMA. This could mean more short-term downside in the crypto world.
Meanwhile, the Cboe Volatility Index ($VIX) remains below 20, a sign that investors are still relatively calm and aren’t rushing for cover just yet.
How’s Market Breadth Holding Up?
Market breadth isn’t sending a clear signal either way right now. The NYSE Advance-Decline Line has bounced off a key level. It'll be interesting to see if it continues higher in the next few days. Which way it moves could tip the scales; a break below the horizontal dashed line could send the S&P 500 lower.
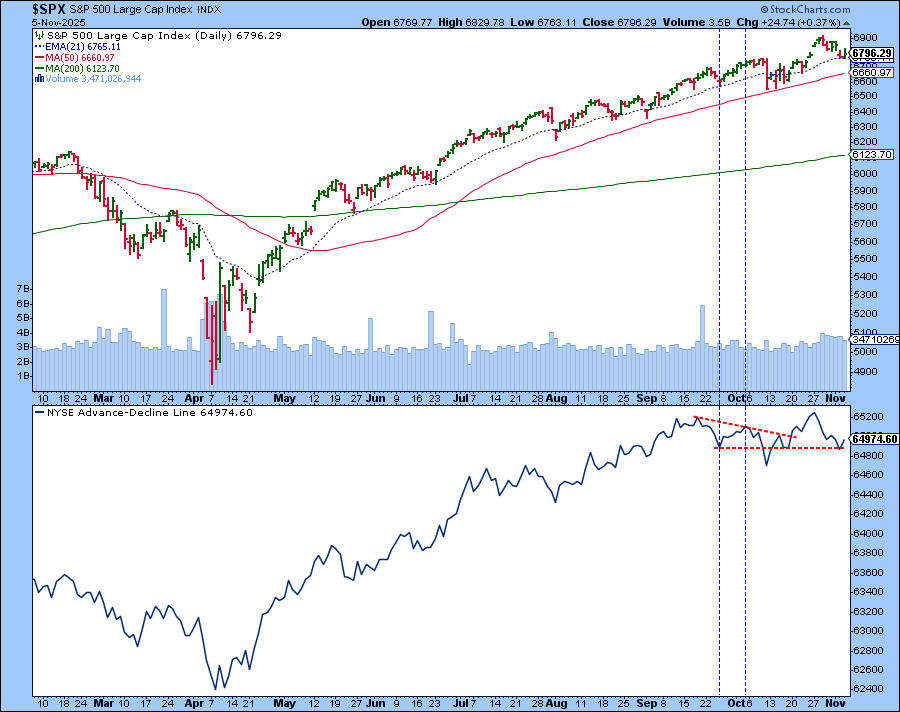
Keep an eye on this one over the next few days.
The Bottom Line
Wednesday’s rebound was a nice relief after Tuesday’s selloff, but it wasn’t a strong enough move to confirm a full-fledged breakout. The S&P 500 is still stuck in its channel, waiting for a decisive move in either direction.
For now, we’re not seeing a convincing move in either direction. Keep a close eye on tech stocks and market breadth to get a sense of which direction equities are likely to move. If the move is to the downside, watch how gold, Bitcoin, and other alternative assets react. They could over some clues about where money is flowing next.
Disclaimer: This blog is for educational purposes only and should not be construed as financial advice. The ideas and strategies should never be used without first assessing your own personal and financial situation, or without consulting a financial professional.


