Zweig Breadth Thrust Sets Up; How to Identify a Stampede in Upside Participation
Key Takeaways
- Zweig Breadth Thrust setting up with an oversold reading.
- The indicator can be used to identify strong upside participation.
- ZBT can be a valuable tool for market timing.
Stocks firmed an oversold reading on March 20th, and now have one day to produce the classic Zweig Breadth Thrust (ZBT) that appears to be setting up. Note that the ZBT is best known for its bullish signals, and traders can also use the "setup" period to identify oversold conditions. Today's report will explain the indicator, show the setup, and set the thrust signal requirements.
A Sudden Stampede in Upside Participation
The Zweig Breadth Thrust is the 10-day EMA of NYSE Advances divided by NYSE Advances plus NYSE Declines. This formula comes from Greg Morris' book, the Encyclopedia of Breadth Indicators. This indicator triggers bullish when it moves below 0.40 and then surges above 0.615 within 10 days.
The move below 0.40 shows strong downside participation (very few advancing stocks and many declining stocks). After a strong push lower, the thrust occurs with a sudden reversal and sharp increase in upside participation. The number of advancing stocks explodes as money moves into the market in a big way. This stampede reflects broad participation and the start of a bull run.
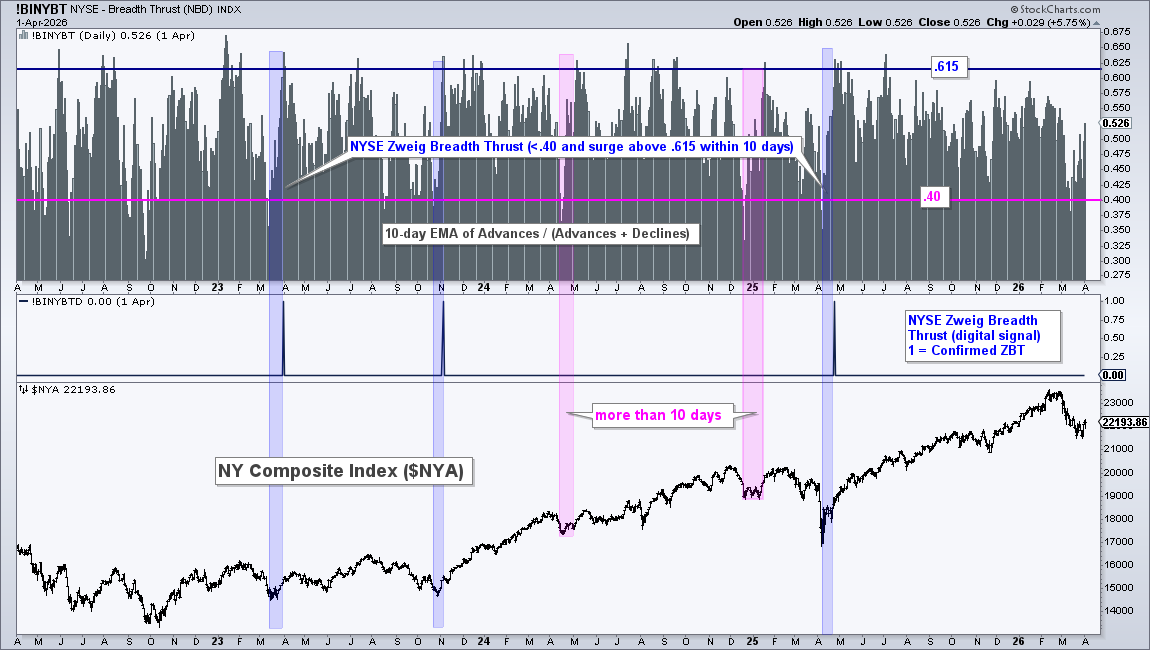
The chart below shows the Zweig Breadth Thrust (!BINYBT) in the top window, the Digital Signal in the middle, and the NY Composite in the lower window. The blue shading marks periods when the indicator surged from below 0.40 to above 0.615 within the 10-day window. These signals are confirmed with the Digital Signal hitting 1. The pink shadings show two periods that just missed the 10-day cutoff.
Recent Reports and Videos on TrendInvestorPro
- Testing the Zweig Breadth Thrust with an Exit Strategy
- Oil and Agriculture Lead as Uranium Sets Up
- Breadth Deteriorates, but Short of Bear Market Signal
- Safety is Relative (Healthcare, Utilities, Infrastructure)
- Trend Trio150 Signals for Dow 30 Stocks and SPDRs
Click here to take a trial and gain immediate access.
ZBT Sets Up with Oversold Reading
The next chart shows the ZBT indicator dipping below 0.40 twice in March. This is the setup. The last dip was on March 20th, which means nine days have passed. A move above 0.615 on Monday would trigger a Zweig Breadth Thrust.
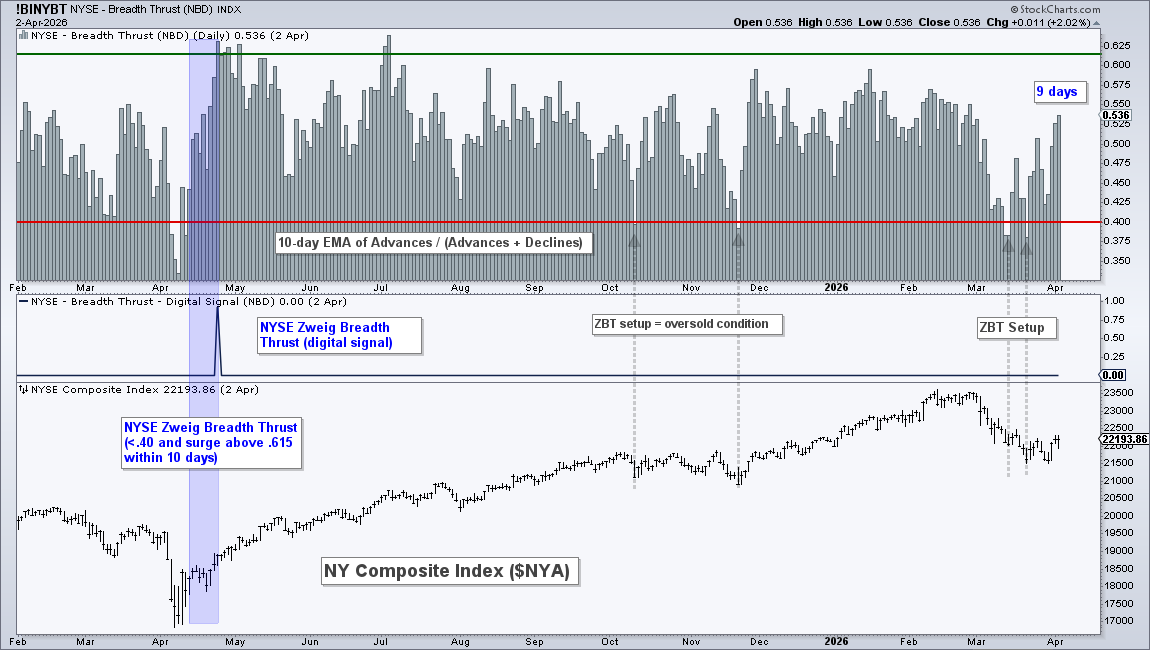
A ZBT setup also reflects an oversold condition. Being the 10-day EMA of Advances/(Advances - Declines), a move below 0.40 means very few stocks advanced over the last 10 days. This is an extreme that can give way to an oversold bounce. Notice how the NY Composite ($NYA) bounced after oversold conditions on October 10th and November 20th (gray arrow lines).
A Valuable Tool for Market Timing
Trading is all about the odds, and the ZBT indicator can improve your odds of success. An oversold condition signals a downside extreme that improves the odds for a bounce. A confirmed Zweig Breadth Thrust shows exceptionally strong buying pressure that improves the odds for an extended bull run.
Something, however, is missing from the original Zweig Breadth Thrust. Those "somethings" are Nasdaq stocks. I suspect Zweig used NYSE breadth because he developed it when the big board (NYSE) dominated trading. Times have changed with the rise of the Nasdaq.
TrendInvestorPro takes the Zweig Breadth Thrust (ZBT) to the next level. First, we coded this indicator using S&P 500 and S&P 1500 stocks. Second, we quantified signals with a backtest. Entry is only half of the equation so I also added an exit condition based. Click here to access the full report at TrendInvestorPro.