MEMBERS ONLY
Charting Robust AD Lines that Truly Reflect the Broader Market
by Arthur Hill,
Chief Technical Strategist, TrendInvestorPro.com
The NYSE and Nasdaq are fine as exchanges, but their AD Lines do not tell the entire story when it comes to breadth. The major stock indexes, such as the S&P 500 and S&P Small-cap 600, contain stocks from both exchanges. As such, robust breadth indicators...
READ MORE
MEMBERS ONLY
The State of the Stock Market - Large Getting Larger
by Arthur Hill,
Chief Technical Strategist, TrendInvestorPro.com
* Large-caps Continue to Lead.
* New Highs Follow Moving Average Signals.
* Index Breadth Table Remains Bullish.
* Sector Breadth Table Remains Bullish.
* Tech-Related ETFs Continue to Lead.
* Biotech ETFs Stutter after Breakouts.
* Art's Charts ChartList Update.
... Large-caps Continue to Lead
The week so far is mixed for stocks with small-caps...
READ MORE
MEMBERS ONLY
This Cannabis Stock is Higher than the Rest
by Arthur Hill,
Chief Technical Strategist, TrendInvestorPro.com
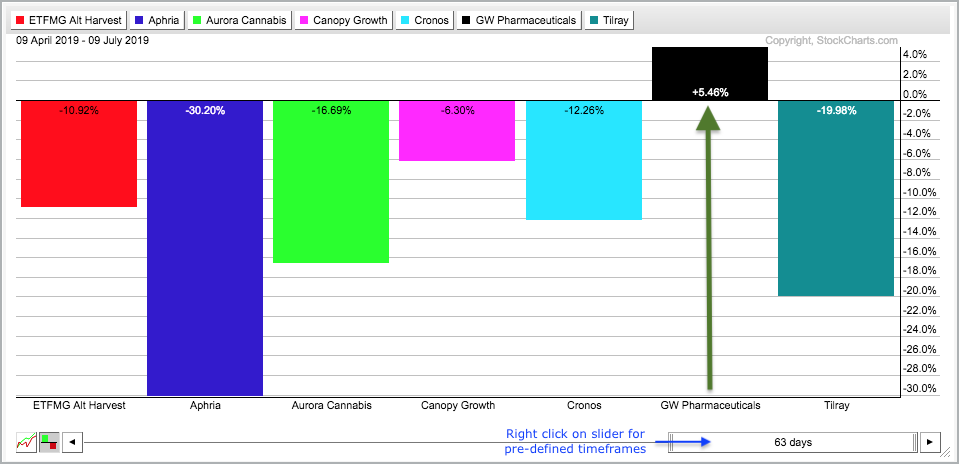
Sorry, I could not resist the pun in that head line. Relative and absolute strength is often dependent on timeframe. One stock may show upside leadership on a one month timeframe, but be lagging on the three and six month timeframes. For example, Tilray (TLRY) is up 16.37% over...
READ MORE
MEMBERS ONLY
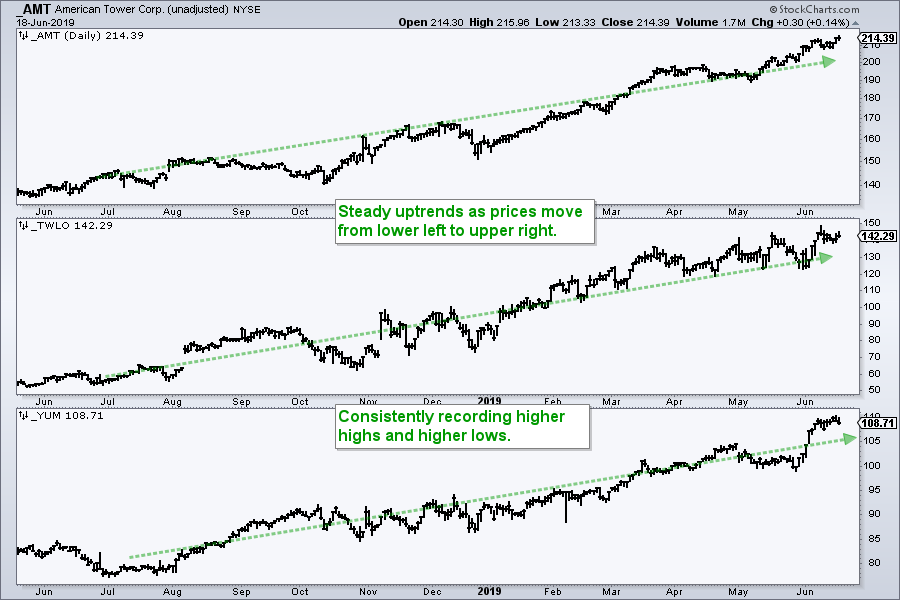
Four Growth Stocks with Bullish Chart Setups
by Arthur Hill,
Chief Technical Strategist, TrendInvestorPro.com
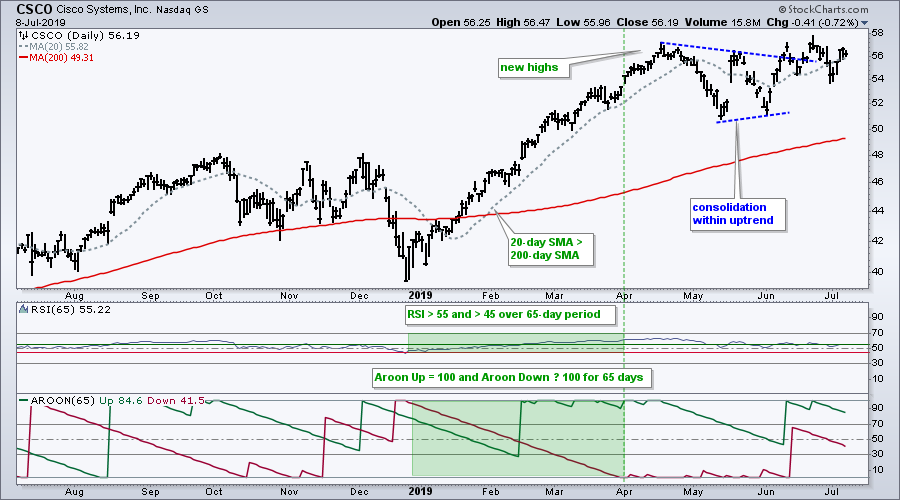
Finding stocks with strong uptrends is the first step to stock selection during bull markets, and we are in a bull market. The S&P 500 hit a new all time high just last week, the largest sector (technology) is leading with XLK also hitting a new high last...
READ MORE
MEMBERS ONLY
This Stock has a New High in its Sights
by Arthur Hill,
Chief Technical Strategist, TrendInvestorPro.com
Stocks that hit new highs are in clear uptrends and show upside leadership. A new high does not have to be within a few days or even a few weeks. Sometimes stocks hit new highs and then correct for a few months to digest prior gains. It is all part...
READ MORE
MEMBERS ONLY
This is the Strongest Industry Group ETF within the Strongest Sector
by Arthur Hill,
Chief Technical Strategist, TrendInvestorPro.com
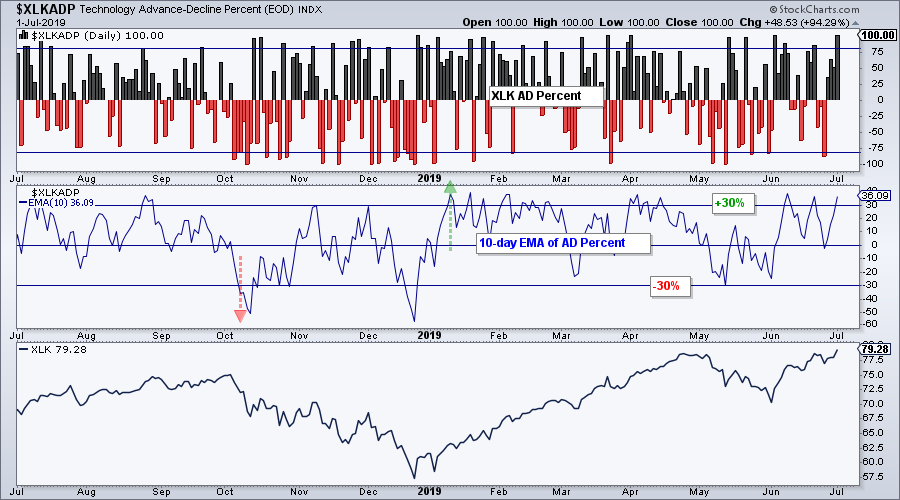
On a closing basis, only one sector hit a new high on Tuesday and that sector just happens to be the biggest sector in the S&P 500. According to SPDRs.com, the Technology SPDR (XLK) accounts for 21.63% of the S&P 500 and is by...
READ MORE
MEMBERS ONLY
XLE and Oil Hit Reversal Alert Zones - On Trend Video
by Arthur Hill,
Chief Technical Strategist, TrendInvestorPro.com
There is much more to a sector than its price chart and StockCharts has the data to take your sector analysis to the next level. Yes, I am talking about the unique breadth indicators that our crack data team calculates and publishes every day. These indicators include AD Percent, High-Low...
READ MORE
MEMBERS ONLY
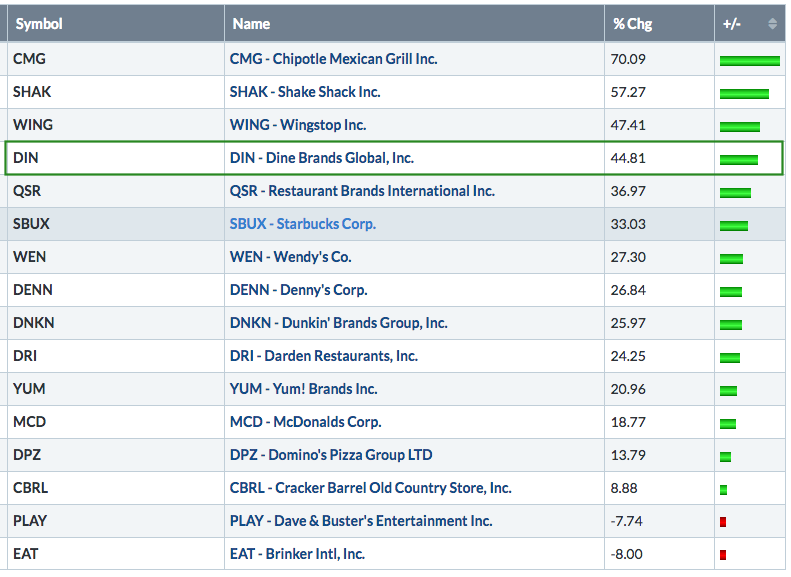
Dine Brands Serves up Some Tasty Technicals
by Arthur Hill,
Chief Technical Strategist, TrendInvestorPro.com
Dine Brands (DIN) is the parent company for the Applebees and iHop restaurant chains. Regardless of what you think of the restaurants or food, business must be good because DIN is one of the best performing restaurant stocks this year (+44%). It is clearly leading on the price charts and...
READ MORE
MEMBERS ONLY
How to Spot Reversal Alert Zones and Get the Jump on Breakouts
by Arthur Hill,
Chief Technical Strategist, TrendInvestorPro.com
Breakouts are bullish and often look great, but they do not always offer the best reward-to-risk ratio when taking a trade. As with so many aspects of technical analysis and trading, we must often walk the fine line between anticipation and confirmation. The first step to anticipating a breakout is...
READ MORE
MEMBERS ONLY
The State of the Stock Market - Bullish Until You Know What
by Arthur Hill,
Chief Technical Strategist, TrendInvestorPro.com
* When Higher Highs are Expected.
* Small-cap Breadth Comes Alive.
* Sector Table Remains Firmly Bullish.
* ETF Leaders and Setups.
* Art's Charts ChartList Update.
... When Higher Highs are Expected
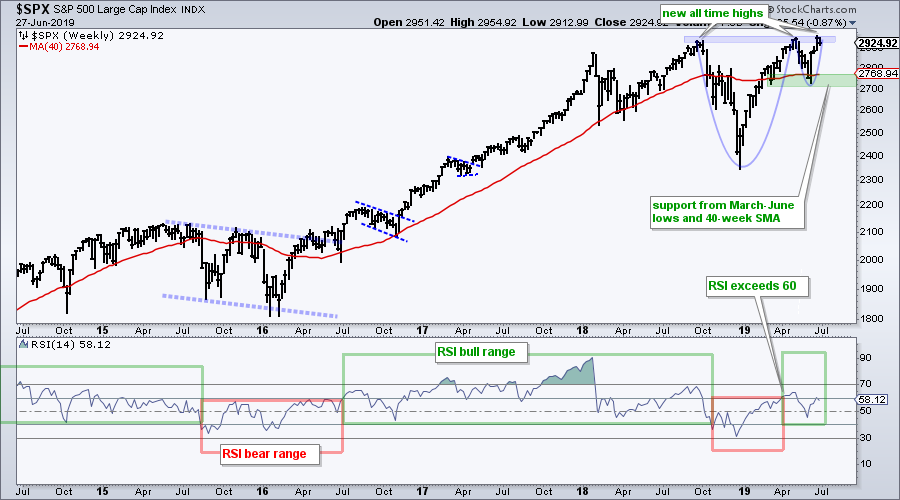
... Let's review the weekly chart for the S&P 500 first. The index surged some 26% from late...
READ MORE
MEMBERS ONLY
SystemTrader - Setting Expectations and Finding Setups within the Aroon/RSI Strategy
by Arthur Hill,
Chief Technical Strategist, TrendInvestorPro.com
* Strategy Recap.
* RSI Signal Examples.
* Aroon Signal Examples.
* Testing the Individual Signals.
* Selecting from Scan Results.
... Last week I showed a scan using RSI(65) and Aroon(65) to find stocks showing steady and consistent uptrends. Today I will backtest this scan on stocks in the S&P 500...
READ MORE
MEMBERS ONLY
Here's a Food Stock with Performance Written All Over It
by Arthur Hill,
Chief Technical Strategist, TrendInvestorPro.com
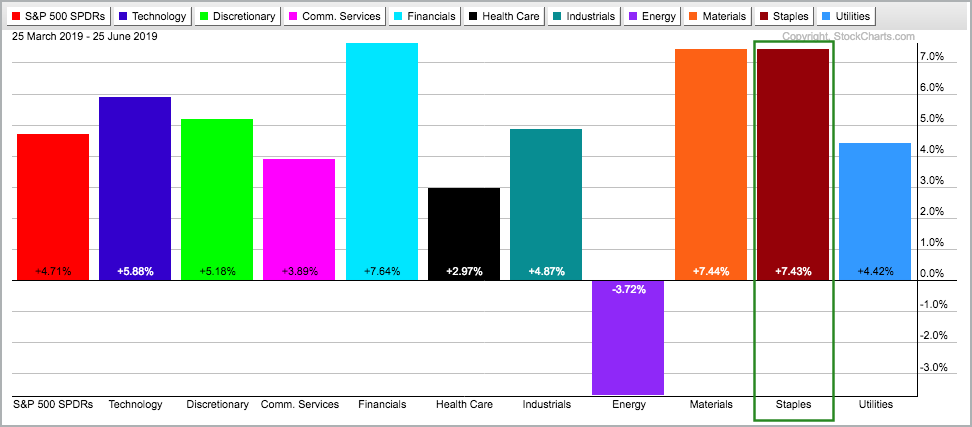
The Consumer Staples SPDR (XLP) is the third best performing sector over the last three months and one of only three sector SPDRs to record a new high here in June (along with XLU and XLRE). In addition, the S&P 500 is trading comfortably above its 200-day SMA....
READ MORE
MEMBERS ONLY
Pfizer Hits a Milestone for 2019
by Arthur Hill,
Chief Technical Strategist, TrendInvestorPro.com
The S&P 500 hit a new high last week and the Health Care SPDR (XLV) broke out of a large symmetrical triangle with a big surge in June. The stock market is in bull mode and healthcare is coming alive. XLV was the worst performing sector from January...
READ MORE
MEMBERS ONLY
The State of the Stock Market - Healthcare and Tech Lead New High List
by Arthur Hill,
Chief Technical Strategist, TrendInvestorPro.com
* S&P 500 Affirms Weight of the Evidence.
* New Highs Expand Yet Again.
* Sector Table Improves with Two Bullish Signals.
* Healthcare and Technology Lead New High List.
* What if you already Knew....?
* Art's Charts ChartList Update.
... All Time High Means only One Thing
... The S&P...
READ MORE
MEMBERS ONLY
GE Takes the Lead with a 3-month High
by Arthur Hill,
Chief Technical Strategist, TrendInvestorPro.com
I featured GE in mid-May as it attempted to break out of a falling wedge (DITC on May 15th). The breakout failed as the stock fell back in May, but a higher low formed and a triangle evolved. Overall, some sort of bullish consolidation formed from February to June and...
READ MORE
MEMBERS ONLY
SystemTrader - Scanning for Consistent Uptrends with Limited Pullbacks
by Arthur Hill,
Chief Technical Strategist, TrendInvestorPro.com
... As a trend-momentum kind of guy, my first task is to find stocks with strong uptrends and this starts with a scan. Chartists looking for scan ideas should first find several visually appealing price charts and then study these charts carefully. Stocks like Autozone (AZO), Gallagher (AJG), Abbot Labs (ABT)...
READ MORE
MEMBERS ONLY
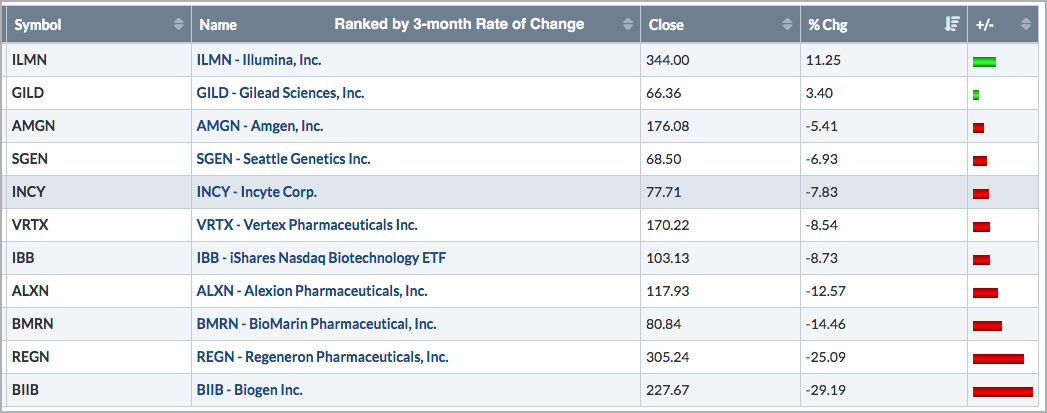
Illumina Rises above the Biotech Crowd
by Arthur Hill,
Chief Technical Strategist, TrendInvestorPro.com
It has been a rough three months for many biotechs and the Biotech iShares (IBB), but Illumina (ILMN) rose above the crowd with a big gain and three month high. The long-term chart also looks bullish.
The table below shows the Biotech iShares and the top ten stocks (sans Celgene)...
READ MORE
MEMBERS ONLY
Are Small-caps Really the Canaries in the Coal Mine?
by Arthur Hill,
Chief Technical Strategist, TrendInvestorPro.com
Many a pundit considers small-caps as the canaries in the coal mine and this implies that relative weakness in small-caps is negative for the broader market. As Missanei of Game of Thrones might say: It is known. Known, yes, but is it actually true?
In the interest of full disclosure,...
READ MORE
MEMBERS ONLY
Weekly Market Review & Outlook - The Long and Rocky Road
by Arthur Hill,
Chief Technical Strategist, TrendInvestorPro.com
* The Long and Rocky Road.
* S&P 500 Maintains Bullish Bias.
* Index Breadth Table Improves.
* MDY and IWM Break Out of Wedges.
* Sector Breadth Table Gets Four New Signals.
* Healthcare Perking Up.
* Big Six Sectors Trigger Breakouts.
* Utes, REITs and Staples Remain Strong.
* Art's Charts ChartList Update....
READ MORE
MEMBERS ONLY
SPY Holds 50-day - Biotech ETFs Set Up - Chinese ETFs Diverge - ChartList Update
by Arthur Hill,
Chief Technical Strategist, TrendInvestorPro.com
* Long-term Uptrend Still Dominates.
* SPY Holds Wedge Breakout and 50-day.
* Biotech ETFs Firm in Reversal Zones.
* Chinese ETFs Diverge.
* Art's Charts ChartList.
* On Trend on SCCTV and Youtube.
... Long-term Uptrend Still Dominates
... Let's break down the S&P 500 by starting with the bigger trend....
READ MORE
MEMBERS ONLY
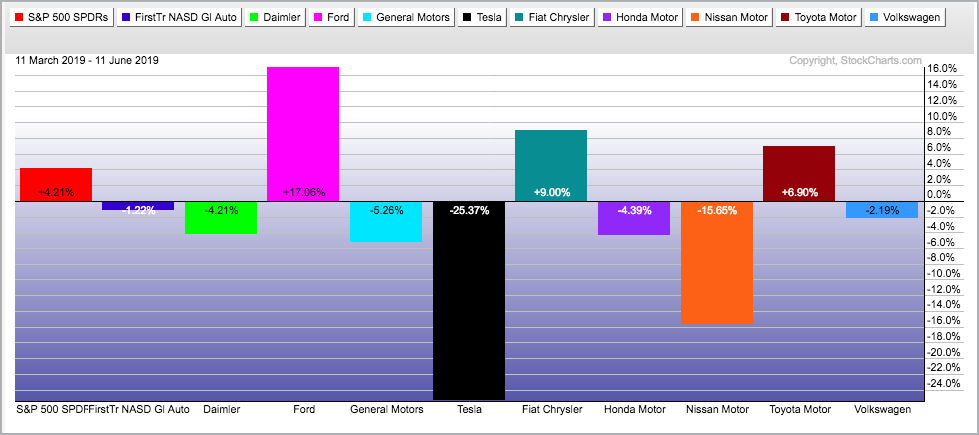
Ford Shines within a Rather Dull Auto Group
by Arthur Hill,
Chief Technical Strategist, TrendInvestorPro.com
It has been a tough three months for most auto stocks with the Global Auto ETF (CARZ) falling around 1.22%. In contrast, the S&P 500 SPDR (SPY) is up 4.21% since March 11th. Within the group, Ford (F) Daimler-Chrysler (DDAIF) and Toyota (TM) show gains during...
READ MORE
MEMBERS ONLY
Mind the Gap in JP Morgan
by Arthur Hill,
Chief Technical Strategist, TrendInvestorPro.com
Stocks moved sharply higher last week with several bouncing off broken resistance levels with gap reversals. JP Morgan is one such stock and last week's gap becomes the first area to watch going forward.
The chart shows JPM breaking out in mid April with a surge to the...
READ MORE
MEMBERS ONLY
Weekly Market Review & Outlook - Assessing the June Rebound
by Arthur Hill,
Chief Technical Strategist, TrendInvestorPro.com
* Small-caps Still Lagging.
* S&P 500 Establishes Clear Support Zone.
* Breadth Falls Short and Fades.
* $SPX Close + 200-day SMA = NOISE!
* A Mixed, but Bullish, Indicator Table.
* Sector Table Remains Firmly Bullish.
* New Highs Surge within S&P 500.
* New Highs in Finance Sector.
* Medical Devices, Defense and Solar...
READ MORE
MEMBERS ONLY
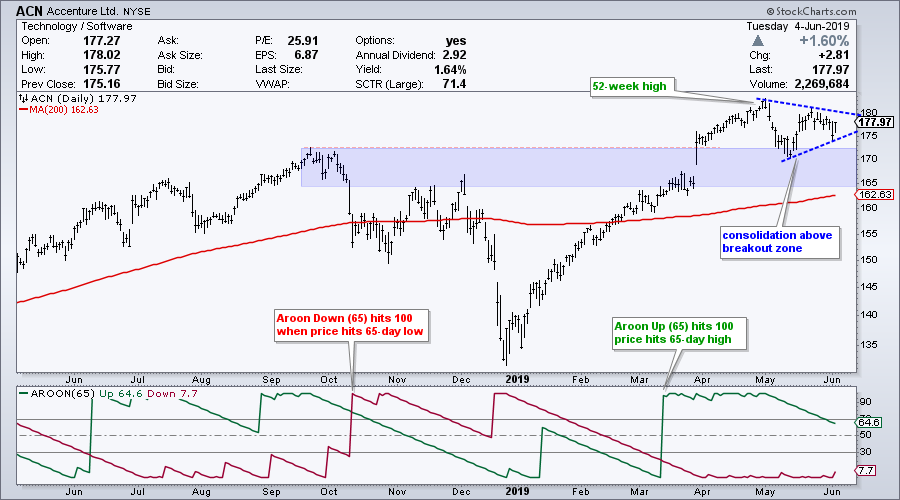
A Bullish Continuation Pattern Evolves for Accenture
by Arthur Hill,
Chief Technical Strategist, TrendInvestorPro.com
Semiconductor stocks fell hard in May, but many software names held up quite well in May and simply consolidated. Accenture is one such name as the stock held above the breakout zone and simply consolidated the last five weeks.
First and foremost, the long-term trend is up because Accenture (ACN)...
READ MORE
MEMBERS ONLY
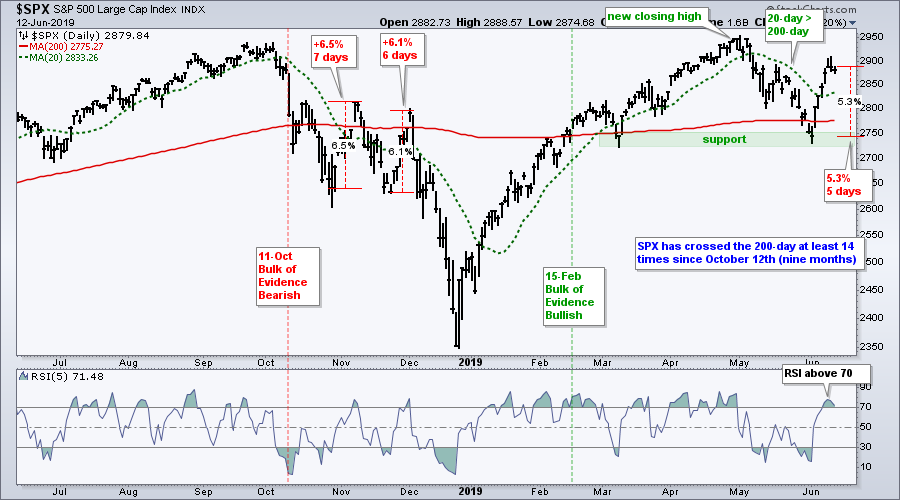
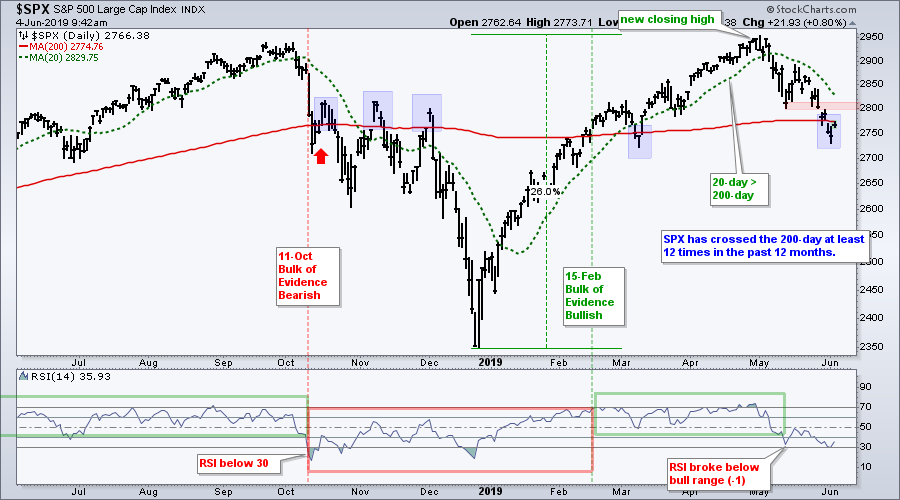
S&P 500 Toys with 200-day - Two Emerging Market ETFs To Watch
by Arthur Hill,
Chief Technical Strategist, TrendInvestorPro.com
* S&P 500 Crosses 200-day for Umpteenth Time.
* The S&P 500 versus a Slew of Negative Charts.
* Vietnam ETF Tests Breakout Zone.
* Frontier Markets ETF Nears Breakout.
... There sure is a lot of negativity out there as the S&P 500 toys with its 200-day SMA....
READ MORE
MEMBERS ONLY
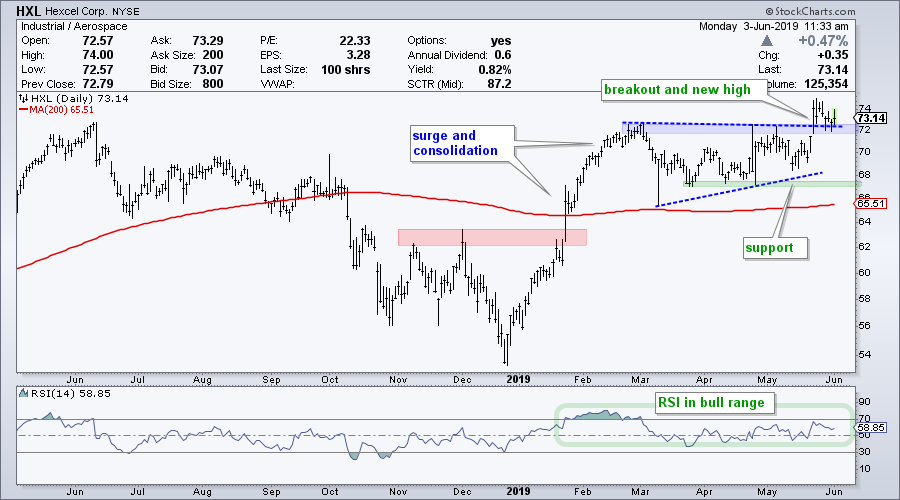
Hexcel Bucks the Selling and Holds the Break Zone
by Arthur Hill,
Chief Technical Strategist, TrendInvestorPro.com
May was a tough month for the broad market indexes and nine of the eleven sectors. Only the Utilities SPDR and Real Estate SPDR advanced in May as the other nine sectors fell. Stocks that closed higher in May bucked some serious selling pressure and could be worth a second...
READ MORE
MEMBERS ONLY
Key Moving Average Rolls Over for S&P 500
by Arthur Hill,
Chief Technical Strategist, TrendInvestorPro.com
The 200-day moving averages for the S&P Mid-Cap 400 and the S&P Small-Cap 600 are already trending lower and this key moving average for the S&P 500 turned lower over the past week. This puts all three indexes below their falling 200-day SMAs and...
READ MORE
MEMBERS ONLY
Weekly Market Review & Outlook - Bearish Evidence Proliferates
by Arthur Hill,
Chief Technical Strategist, TrendInvestorPro.com
* Key Moving Average Turns Lower.
* Mid-caps Trigger Bearish Breadth Signal.
* Small-caps Lead New Low Expansion.
* Four New Signals on Sector Table.
* Risk Aversion Indicators Surge.
* Treasury Bonds Extend Surge.
* Consumer Discretionary Sector Breaks Down.
* Oil Extends Decline.
* Gold Forms a Bull Wedge.
* Art's Charts ChartList Update.
... Stocks are...
READ MORE
MEMBERS ONLY
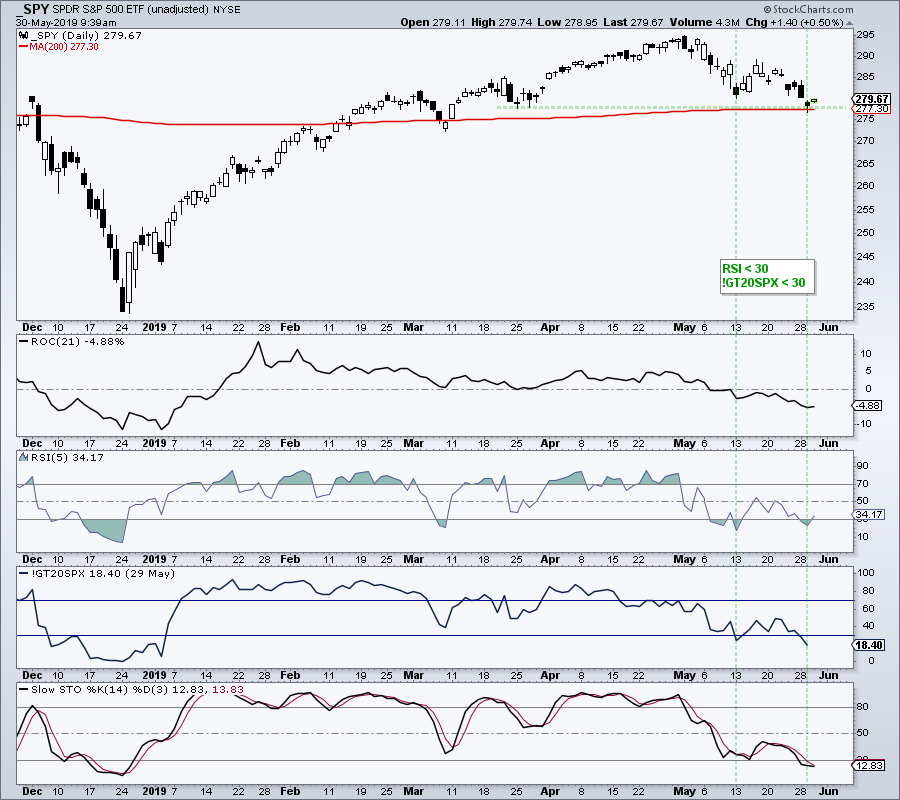
SPY and SOXX Become Oversold near Support
by Arthur Hill,
Chief Technical Strategist, TrendInvestorPro.com
* Oversold and at the 200-day.
* Pennant Evolves into Wedge.
* SOXX and Semis Hit Support.
* A Correction within Uptrend for PALL.
... Oversold and at the 200-day
... The S&P 500 and S&P 500 SPDR (SPY) are at interesting junctures because both are oversold and both are at their...
READ MORE
MEMBERS ONLY
Cardiovascular Systems Breaks from Pennant
by Arthur Hill,
Chief Technical Strategist, TrendInvestorPro.com
Cardiovascular Systems (CSII) shows bullish price action with signs of accumulation that could lead to higher prices.
First and foremost, the long-term trend is up because CSII recorded a new high in early March and is above the 200-day SMA. The 50-day SMA (green) is also above the 200-day SMA...
READ MORE
MEMBERS ONLY
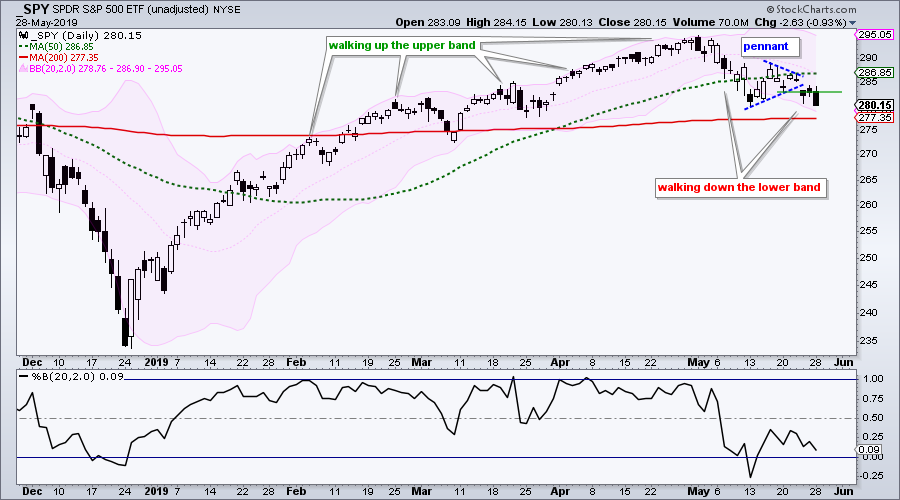
Walking Down the Lower Bollinger Band
by Arthur Hill,
Chief Technical Strategist, TrendInvestorPro.com
* Walking Down the Lower Band.
* Swings are Getting Bigger.
* Selling Pressure Expands to Defensive Sectors.
* Bearish Breadth Thrust for XLP and XLV.
* On Trend on Youtube.
...Walking Down the Lower Band
...Even though the weight of the evidence has yet to turn bearish for the S&P 500, the...
READ MORE
MEMBERS ONLY
Weekly Market Review & Outlook - Small-caps, Retail and Oil Lead Lower
by Arthur Hill,
Chief Technical Strategist, TrendInvestorPro.com
* Retail, Banks, Semis and Oil.
* S&P 500 Corrects with Bigger Uptrend.
* Index Breadth Table Remains Net Bullish.
* AD Percent Down Days Weigh in May.
* Small-caps Lead the Way Lower.
* Charts to Measure Risk On/Off.
* Sector Shift in May.
* Sector Breadth Table Remains Bullish.
* Healthcare ETFs Hold Up...
READ MORE
MEMBERS ONLY
A Medical Device Stock with Strong Volume Trends
by Arthur Hill,
Chief Technical Strategist, TrendInvestorPro.com
An existing uptrend and short-term breakout on high volume point to higher prices for Boston Scientific.
The chart below show BSX hitting a new high in early March and then falling rather sharply into mid April. A volume spike punctuates the plunge below 35 and this looks like a selling...
READ MORE
MEMBERS ONLY
A Momentum Break for Ross Stores
by Arthur Hill,
Chief Technical Strategist, TrendInvestorPro.com
Ross Stores (ROST) recently bounced off its rising 200-day SMA with a bullish candlestick pattern and short-term RSI broke to its highest level of the month. It looks like the short-term pullback is ending and the bigger uptrend is resuming.
ROST plunged in November-December with a sharp decline below the...
READ MORE
MEMBERS ONLY
A Bearish Failure Swing for the Russell 2000
by Arthur Hill,
Chief Technical Strategist, TrendInvestorPro.com
The bearish failure swing is a bearish RSI signal from Welles Wilder, creator of RSI. Note that this signal is NOT the same as a bearish divergence, even though a bearish divergence is also possible at the same time.
A bearish failure swing has four parts: RSI moves above 70...
READ MORE
MEMBERS ONLY
Weekly Market Review & Outlook - Risk Aversion in the Air
by Arthur Hill,
Chief Technical Strategist, TrendInvestorPro.com
* Defensive Sectors Have Strongest Charts.
* Offensive Sectors Have Yet to Break Down.
* S&P 500 Gets a Bounce.
* A Bearish Failure Swing for the Russell 2000.
* Large-caps Lead New High List.
* Discretionary and Communication Sectors Take Hits.
* Housing versus Retail.
* Software versus Semis.
* Treasury Bonds Extend on Breakouts.
* Measuring...
READ MORE
MEMBERS ONLY
Is GE for Real This time?
by Arthur Hill,
Chief Technical Strategist, TrendInvestorPro.com
General Electric (GE) is one of the worst performing stocks over the last two years, but the stock is perking up in 2019 and outperforming in May. The S&P 500 is down 3.8% so far this month and GE is up 1.5% after a big surge...
READ MORE
MEMBERS ONLY
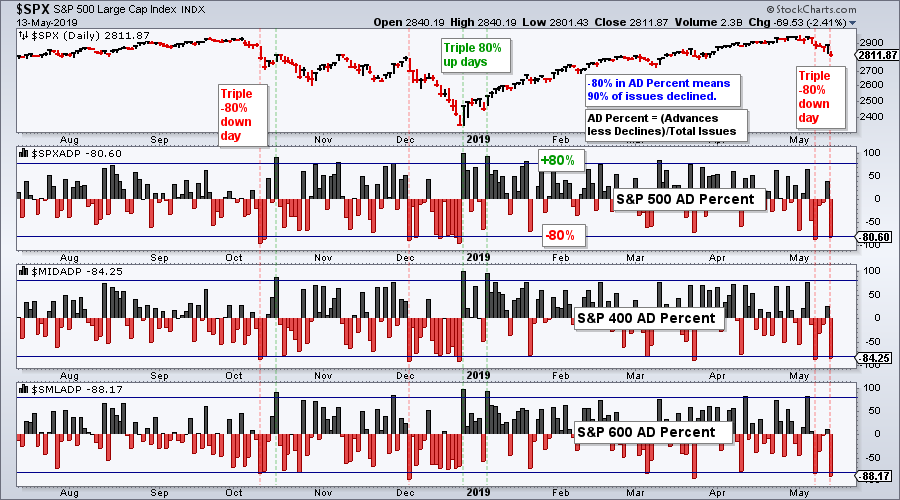
Four Steps Up and One Step Back - Another 90% Down Day - Breadth Update
by Arthur Hill,
Chief Technical Strategist, TrendInvestorPro.com
* Triple 90% Down Volume Day.
* Breadth Table Update.
* Four Steps Up and One Step Back.
* SPY Hits Support and Becomes Oversold.
* Interest in Tariffs and Fed.
Triple 90% Down Volume Day
Stocks were hit with strong selling pressure again on Monday with the S&P 500 SPDR falling 2....
READ MORE
MEMBERS ONLY
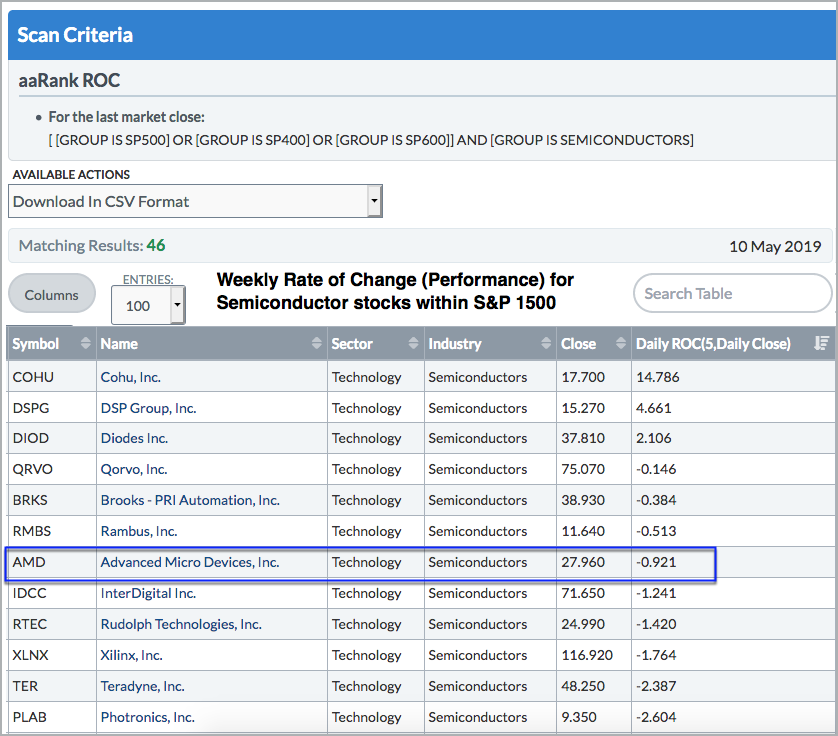
AMD Holds Up Well with Semiconductor Group
by Arthur Hill,
Chief Technical Strategist, TrendInvestorPro.com
The S&P 500 was down 2% last week and the Nasdaq fell 3%. Stocks that gained on the week showed relative and absolute strength. Stocks that fell less than 2% showed relative strength. The average semiconductor stock within the S&P 1500 was down 5% last week...
READ MORE
MEMBERS ONLY
Weekly Market Review & Outlook - Weighing the Evidence and the Nerve
by Arthur Hill,
Chief Technical Strategist, TrendInvestorPro.com
* Small-caps and 3 Sectors Weigh.
* Everywhere and Nowhere.
* Immediate Trend is Still Up.
* Another Possible Support Zone.
* Index Breadth Table Survives 90% Down Days.
* Yield Spread Remains Positive for Stocks.
* Mean-Reversion Setup Brewing.
* Art's Charts ChartList Update.
... Small-caps and 3 Sectors Weigh
Stocks came under broad pressure in...
READ MORE