MEMBERS ONLY
Staples breaks flag trendline
by Arthur Hill,
Chief Technical Strategist, TrendInvestorPro.com
After a sharp decline with a gap in early March, Staples (SPLS) retraced 50-62% with a rising flag over the last 2-3 weeks. The stock broke the lower flag trendline with a sharp decline on Wednesday, but firmed at support around 23.5 on Thursday.
Click this image for details...
READ MORE
MEMBERS ONLY
Techs, healthcare and utilities lead lower
by Arthur Hill,
Chief Technical Strategist, TrendInvestorPro.com
The Market Carpet shows the technology, healthcare and utilities sectors leading the market lower on Wednesday. The average decline for stocks in these sectors was 1.13%, 1.01% and .96%, respectively. Only financials were up with the average advance per stock running .13%.
Click this image for details...
READ MORE
MEMBERS ONLY
A new high for SPY
by Arthur Hill,
Chief Technical Strategist, TrendInvestorPro.com
There it is again. After one long red candlestick, SPY opened weak and closed strong. This intraday reversal was followed by further gains on Tuesday as the ETF moved above 117 for the first time since September 2008, which was when Lehman declared bankruptcy. The pink circle shows the prior...
READ MORE
MEMBERS ONLY
Industry leaders since early February
by Arthur Hill,
Chief Technical Strategist, TrendInvestorPro.com
The John Murphy industry group PerfChart shows banks, biotechs, retail and semis leading the market higher since early February. Oil services and pharmaceuticals are lagging the S&P 500.
Click this image for details...
READ MORE
MEMBERS ONLY
Bulls refuse to relent
by Arthur Hill,
Chief Technical Strategist, TrendInvestorPro.com
Even after a high-volume bearish engulfing on quadruple witching Friday and weak open on Monday, the bulls refused to give up the trend and pushed stocks higher immediately after the open. One day does not a trend change make. Selling pressure has been very limited since the early February low....
READ MORE
MEMBERS ONLY
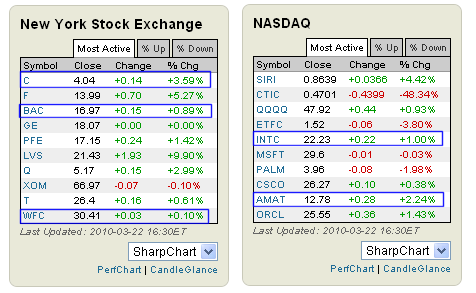
Banks and Semis Shine
by Arthur Hill,
Chief Technical Strategist, TrendInvestorPro.com
From the Free Charts page, the most active list for the NYSE shows strength in three banks (C, BAC, WFC). The most active Nasdaq list shows strength in two semis (INTC, AMAT). The CandleGlance link at the bottom of these tables shows all 10 with small candlestick charts.
Click this...
READ MORE
MEMBERS ONLY
High volume and overbought conditions
by Arthur Hill,
Chief Technical Strategist, TrendInvestorPro.com
Stocks fell on Friday with the highest volume since early February, which was the scene of the last reversal. High volume sometimes marks a turning point. Stockcharts.com provides volume figures for the S&P 500, Dow Industrials, Nasdaq 100, Nasdaq and NYSE. The first three are the most...
READ MORE
MEMBERS ONLY
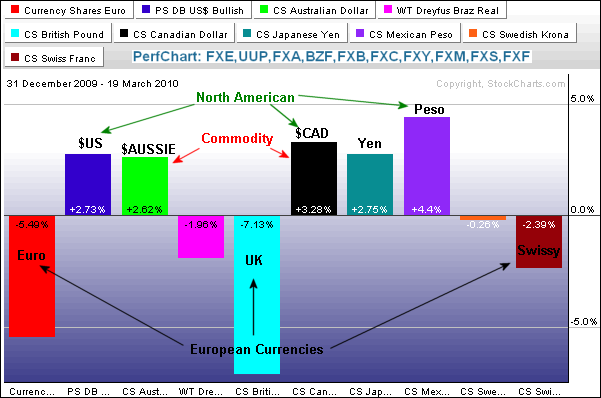
North American Currencies show strength in 2010
by Arthur Hill,
Chief Technical Strategist, TrendInvestorPro.com
The Perfchart below shows the performance trends for 10 currency ETFs in 2010. The North American and commodity currencies are strong, while the European currencies are weak. First, notice that the DB Dollar Bullish ETF (UUP), Mexican Peso ETF (FXM) and the Canadian Dollar ETF (FXC) are up. Strength in...
READ MORE
MEMBERS ONLY
A rough week for energy
by Arthur Hill,
Chief Technical Strategist, TrendInvestorPro.com
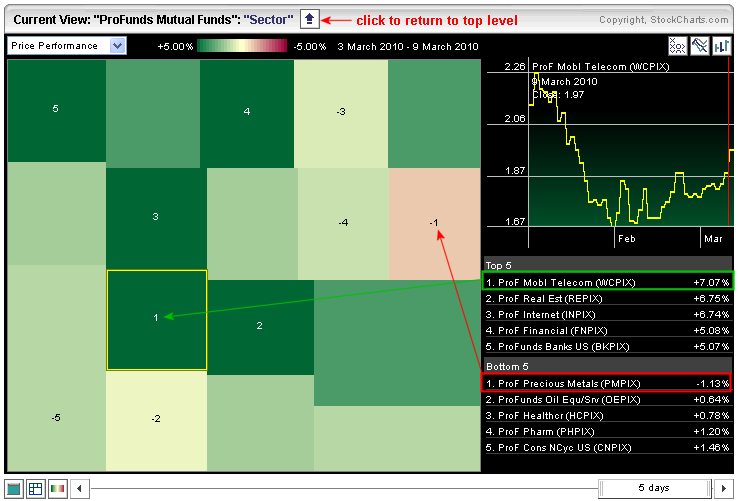
The Sector Market Carpet shows gains across eight of the nine sectors over the last four days. The energy sector is the only one not sporting a gain this week. Notice that the "bottom 5" performing stocks come from this sector as well. The finance is the strong...
READ MORE
MEMBERS ONLY
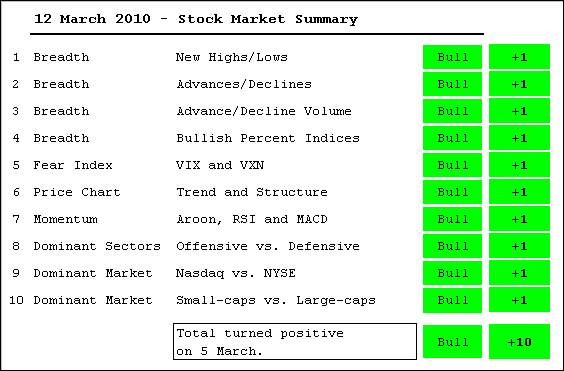
Medium-Term Evidence Remains Bullish
by Arthur Hill,
Chief Technical Strategist, TrendInvestorPro.com
There is no change in the Stock Market Summary this week. All indicators are in bull mode with no signs of weakness within the market. After a sharp advance the last three weeks, the major index ETFs are short-term overbought and ripe for a pullback or consolidation. RSI for the...
READ MORE
MEMBERS ONLY
String broken, but not uptrend
by Arthur Hill,
Chief Technical Strategist, TrendInvestorPro.com
The S&P 500 ETF (SPY) finally broke its string of advances with a small decline on Thursday. And I do mean small. DIA, QQQQ and IWM were up fractionally on the day. The sectors were mixed with five down and four up. Net Advances and Net Advancing Volume...
READ MORE
MEMBERS ONLY
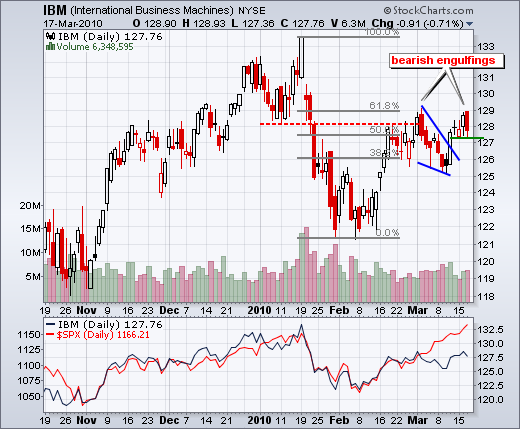
IBM forms second bearish engulfing
by Arthur Hill,
Chief Technical Strategist, TrendInvestorPro.com
For the second time in three weeks, IBM made the bearish engulfing scan and confirmed resistance at 129. The stock first hit resistance here in early March. The bearish engulfing has yet to be confirmed as the stock stays range bound the last five days. Watch 127 down and 129...
READ MORE
MEMBERS ONLY
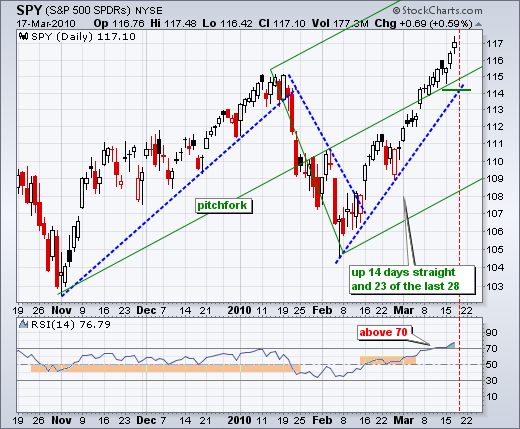
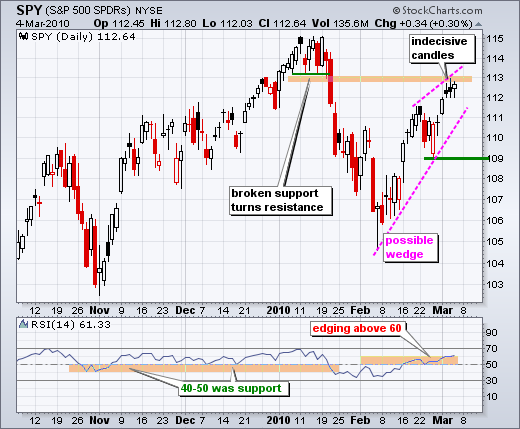
The runaway train continues
by Arthur Hill,
Chief Technical Strategist, TrendInvestorPro.com
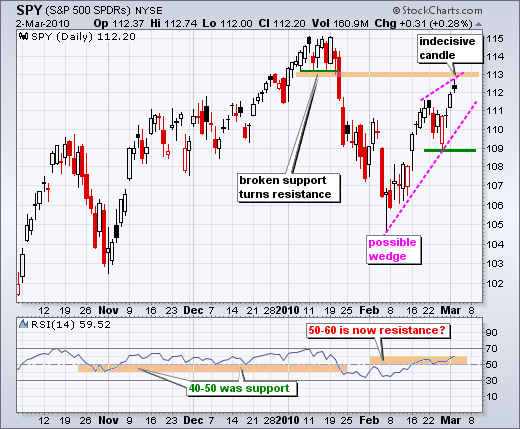
The S&P 500 ETF (SPY) continued higher with a close above 117. Even though the ETF closed up on the day, the candlestick was indecisive with a small body and relatively equal upper/lower shadows. Since the breakout at 108, I count six indecisive candlesticks. It is clear...
READ MORE
MEMBERS ONLY
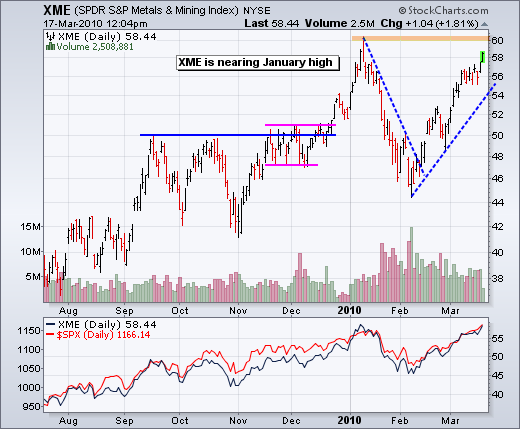
$XME nears January high
by Arthur Hill,
Chief Technical Strategist, TrendInvestorPro.com
Materials and Energy related ETFs have been lagging the broader market because many remain below their January highs. That may be changing. The chart below shows the Metals & Mining SPDR (XME) surging towards its January high with a move over the last two days.
Click this image for details...
READ MORE
MEMBERS ONLY
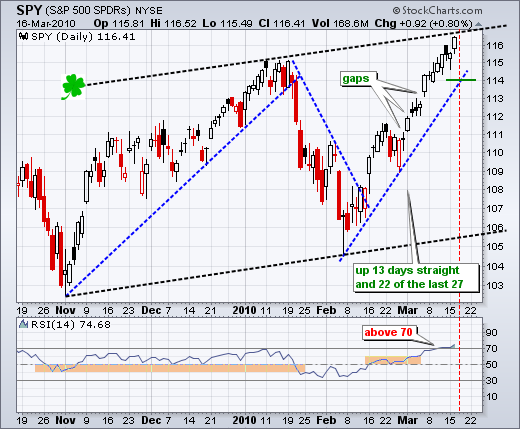
SPY makes it lucky 13
by Arthur Hill,
Chief Technical Strategist, TrendInvestorPro.com
The S&P 500 ETF (SPY) made it a lucky 13 with another advance on Tuesday. There are, hundreds, if not thousands, of indicators and drawing techniques available to the technical analyst. Chances are that one of these indicators or drawing techniques will pick the exact top. Our job...
READ MORE
MEMBERS ONLY
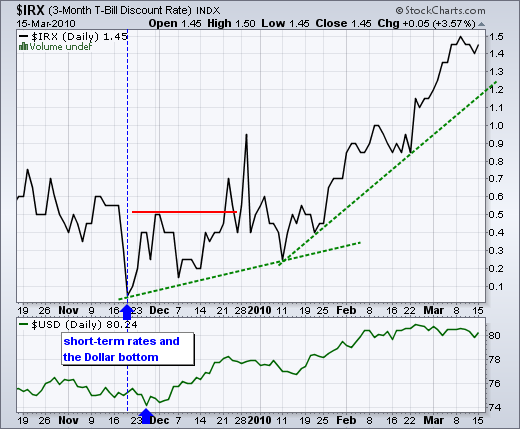
Short-Term rates rising ahead of Fed
by Arthur Hill,
Chief Technical Strategist, TrendInvestorPro.com
Even though the Fed is unlikely to raise rates today, the bond market is already doing some of the Fed's work. The 3-month T-Bill Rate ($IRX) bottomed at the end of November and surged over the last two months. Despite this big move, $IRX is still low by...
READ MORE
MEMBERS ONLY
SPY up 12 days straight
by Arthur Hill,
Chief Technical Strategist, TrendInvestorPro.com
The S&P 500 ETF (SPY) put another notch on its belt today with the 12th straight gain. As far as I can tell, September 1995 was the last such occurrence, after which SPY moved into a seven week trading range. I posted a chart of September 1995 in...
READ MORE
MEMBERS ONLY
Pulte hits retracement resistance
by Arthur Hill,
Chief Technical Strategist, TrendInvestorPro.com
Pulte Homes (PHM) is hitting resistance from broken support and the 62% retracement around 11.8. The stock hit this resistance zone twice in February and formed a lower high in March. Also notice that PHM is underperforming the S&P 500 over the last few weeks.
Click this...
READ MORE
MEMBERS ONLY
SPY up 11 days straight
by Arthur Hill,
Chief Technical Strategist, TrendInvestorPro.com
With Friday's advance, the S&P 500 ETF (SPY) is now up 11 days straight and 20 of the last 25 days. It is an almost historic run. The ETF was up 12 days straight on September 13th, 1995. After the September 1995 run, the ETF went...
READ MORE
MEMBERS ONLY
Breadth continues to expand
by Arthur Hill,
Chief Technical Strategist, TrendInvestorPro.com
NYSE and Nasdaq breadth continues to expand and back up the current rally. From the breadth charts page at Stockcharts.com, we can see the NYSE AD Line ($NYAD) and Nasdaq AD Line ($NAAD) moving sharply higher the last five weeks. Also notice that the cumulative Net New Highs lines...
READ MORE
MEMBERS ONLY
MT Evidence shows sea of green
by Arthur Hill,
Chief Technical Strategist, TrendInvestorPro.com
All stock market indicators are in bull mode. Before moving to the details, note that two indicators have been removed. The McClellan Oscillators were removed because they are redundant breadth indicators. The AD Lines represent a purer picture of the advance-decline metrics. The intermarket indicator has been removed because I...
READ MORE
MEMBERS ONLY
SPY goes 10 for 10
by Arthur Hill,
Chief Technical Strategist, TrendInvestorPro.com
With Thursday's advance, the S&P 500 ETF (SPY) is now up 10 of the last 10 days and 19 of the last 24. This is an amazing string of advances. In fact, I would say it is starting to look like a melt-up, which is the...
READ MORE
MEMBERS ONLY
SPY goes for 10 of 10
by Arthur Hill,
Chief Technical Strategist, TrendInvestorPro.com
With a move into positive territory today, the S&P 500 ETF (SPY) is trying to make it 10 up days in a row. The ETF is also trying to make it 19 up days out of the last 24 days. Truly a remarkable run. Resistance from the January...
READ MORE
MEMBERS ONLY
SPY challenges January high
by Arthur Hill,
Chief Technical Strategist, TrendInvestorPro.com
There was another challenge to the January high as the S&P 500 ETF (SPY) gained around 1/2% to close at 114.97. For all intents and purposes, SPY has reached the January high. However, it has yet to exceed the January high. As noted in Wednesday'...
READ MORE
MEMBERS ONLY
Profunds Sector Carpet
by Arthur Hill,
Chief Technical Strategist, TrendInvestorPro.com
Even if you do not trade or invest with Profunds, the Profunds market carpet provides an excellent means to track sector/industry action. The Profunds Mutual Funds sector carpet shows 19 funds with the top/bottom five listed on the right. Over the last five days, only the Precious Metals...
READ MORE
MEMBERS ONLY
SPY stalls near January high
by Arthur Hill,
Chief Technical Strategist, TrendInvestorPro.com
After moving sharply higher in early trading, stocks turned lower in the afternoon and finished mixed on the day. All major indices finished fractionally higher, but the sectors were mixed with three up, five down and one unchanged. With the afternoon selloff, shooting stars formed in the S&P...
READ MORE
MEMBERS ONLY
Cisco surges ahead of announcement
by Arthur Hill,
Chief Technical Strategist, TrendInvestorPro.com
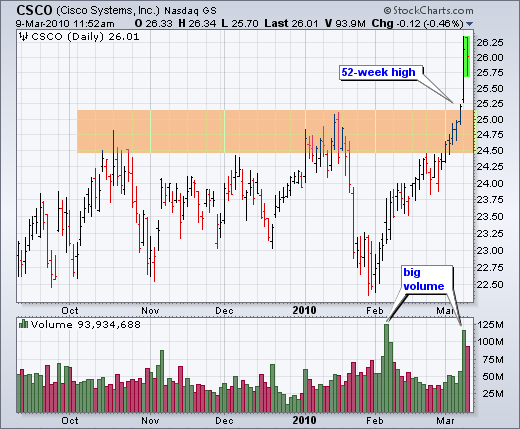
Cisco (CSCO) surged above resistance and recorded a new 52-week high ahead of Tuesday's big announcement. Notice how CSCO started its move with a volume surge in early February. While the new 52-week high is bullish, the stock is getting a bit frothy and the news is now...
READ MORE
MEMBERS ONLY
SPY stalls near January high
by Arthur Hill,
Chief Technical Strategist, TrendInvestorPro.com
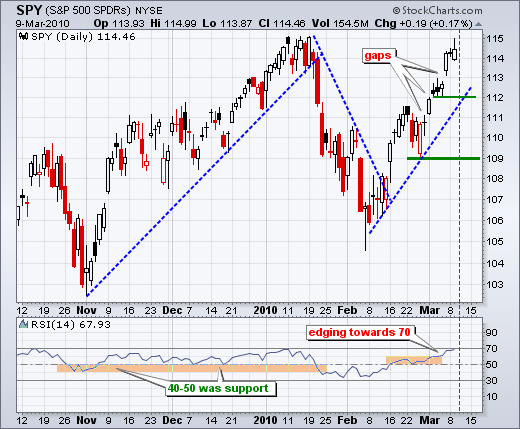
After a gap and surge above 114 on Friday, the S&P 500 ETF (SPY) stalled with a small doji on Monday. This is hardly surprising given potential resistance near the January high and short-term overbought conditions. SPY is up over 7% since mid February and up over 3....
READ MORE
MEMBERS ONLY
RIMM goes for a breakout
by Arthur Hill,
Chief Technical Strategist, TrendInvestorPro.com
Research in Motion (RIMM) broke above resistance with a sharp advance in early trading on Monday. The chart shows resistance around 72 from the December-February highs. In addition, a small inverse head-and-shoulders formed over the last three weeks and RSI held momentum support at 50.
Click this image for details...
READ MORE
MEMBERS ONLY
SPY becomes short-term overbought
by Arthur Hill,
Chief Technical Strategist, TrendInvestorPro.com
Stocks surged with a better-than-expected employment report on Friday. The Russell 2000, S&P 500 Equal-Weight Index, Nasdaq 100 Equal-weight Index and S&P 400 MidCap Index all recorded new 52-week highs. The Nasdaq 100, Dow and S&P 500 also surged, but remain just below their...
READ MORE
MEMBERS ONLY
Net New Highs Expand to January Levels
by Arthur Hill,
Chief Technical Strategist, TrendInvestorPro.com
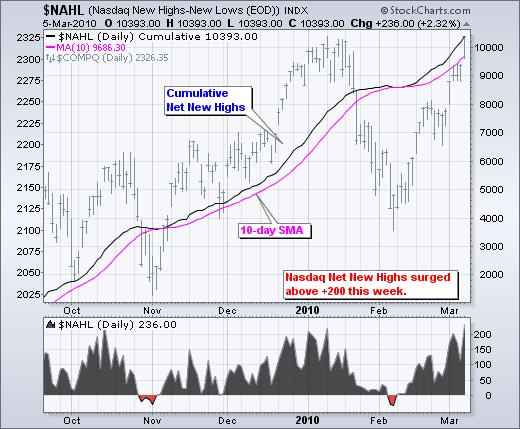
Net New Highs survived their third corrective period and surged over the last few weeks. The chart below shows Nasdaq Net New Highs surging back above +200 this week. Prior surges in October and early January hit the +200 area. Notice that there have been three corrections over the last...
READ MORE
MEMBERS ONLY
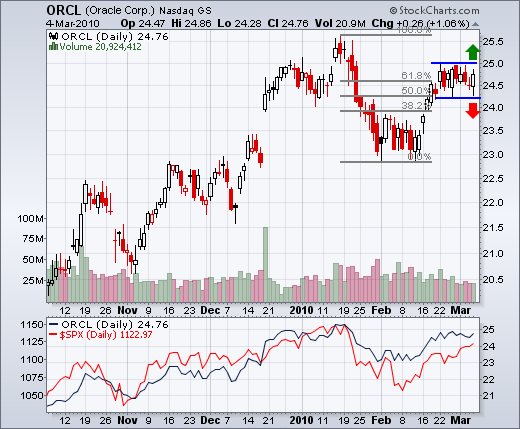
Oracle stalls after surge
by Arthur Hill,
Chief Technical Strategist, TrendInvestorPro.com
Oracle (ORCL) surged in mid February and then stalled over the last two weeks. The resolution of this consolidation will signal the next directional move. A break above resistance would be short-term bullish, while break below support would be bearish.
Click this image for details...
READ MORE
MEMBERS ONLY
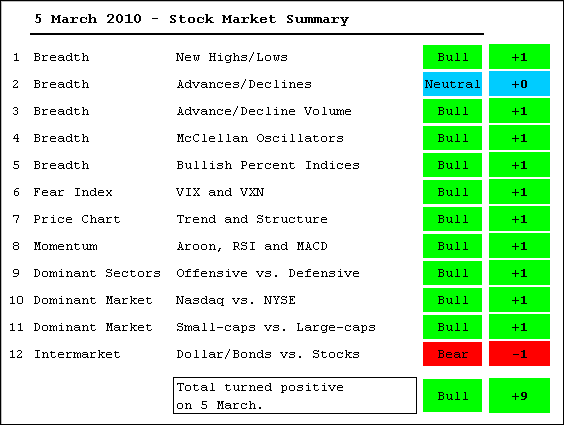
MT Evidence shifts back to the bulls
by Arthur Hill,
Chief Technical Strategist, TrendInvestorPro.com
With further strength this week, the market summary table moved from -2 to +9. The only negative indications come from the Nasdaq AD Line and strength in the Dollar. In addition, relative weakness in the large-cap indices (SPY and DIA) is a concern. The rally over the last four weeks...
READ MORE
MEMBERS ONLY
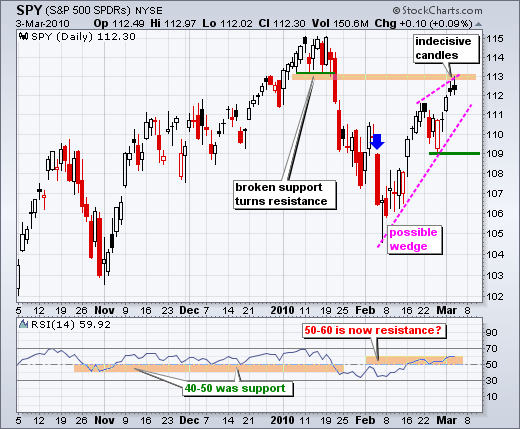
SPY stalls in an uptrend
by Arthur Hill,
Chief Technical Strategist, TrendInvestorPro.com
The S&P 500 ETF (SPY) stalled for the third day running as the ETF formed its third indecisive candlestick in a row. While this indecision can sometimes foreshadow a reversal, stalling is not the same as weakness. At this point, it is just a rest within the advance,...
READ MORE
MEMBERS ONLY
AA and AXP lagging within the Dow
by Arthur Hill,
Chief Technical Strategist, TrendInvestorPro.com
A look at the CandleGlance page for the Dow stocks shows Alcoa (AA) and American Express (AXP) lagging in February. The Dow and S&P 500 were up sharply in February, but these two stocks simply consolidated and shows relative weakness. Click this image to see all Dow stocks....
READ MORE
MEMBERS ONLY
SPY extends its stall + stock charts
by Arthur Hill,
Chief Technical Strategist, TrendInvestorPro.com
For the second day running, the S&P 500 ETF (SPY) stalled with an indecisive candlestick. Notice the small body (open-close) and the modest upper-lower shadows (intraday high-low). These candlesticks show a stalemate between buyers and sellers. DIA and QQQQ formed similar candlesticks. Even though IWM and MDY hit...
READ MORE
MEMBERS ONLY
SPY stalls with indecisive candlestick
by Arthur Hill,
Chief Technical Strategist, TrendInvestorPro.com
Technically, there is a case for a medium-term uptrend. SPY recorded a 52-week high in January and the February reaction low is above the early November reaction low. Also, consider that the Russell 2000 ETF (IWM) and S&P 400 MidCap ETF (MDY) are already back near their January...
READ MORE
MEMBERS ONLY
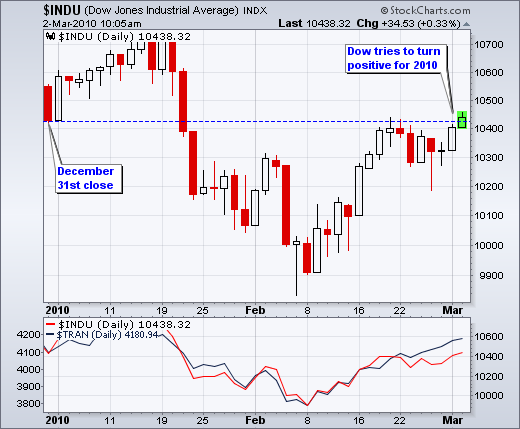
Dow tries to go positive for 2010
by Arthur Hill,
Chief Technical Strategist, TrendInvestorPro.com
The Dow Industrials is attempting to turn positive for 2010. The senior Average closed at 10,428 on December 31st and flirted with the 10428 area 7-8 days ago. After falling back below 10300 last week, the Dow is making another go at positive ground.
Click this image for details...
READ MORE
MEMBERS ONLY
SPY follows through on reversal day
by Arthur Hill,
Chief Technical Strategist, TrendInvestorPro.com
Stocks moved higher on Monday with broad participation. All of the major indices were up 1% or more. All sectors were up with the Consumer Discretionary SPDR (XLY) leading the way. The Financials SPDR (XLF), however, was clearly the weakest link with a fractional gain (+.27%). This could develop into...
READ MORE
MEMBERS ONLY
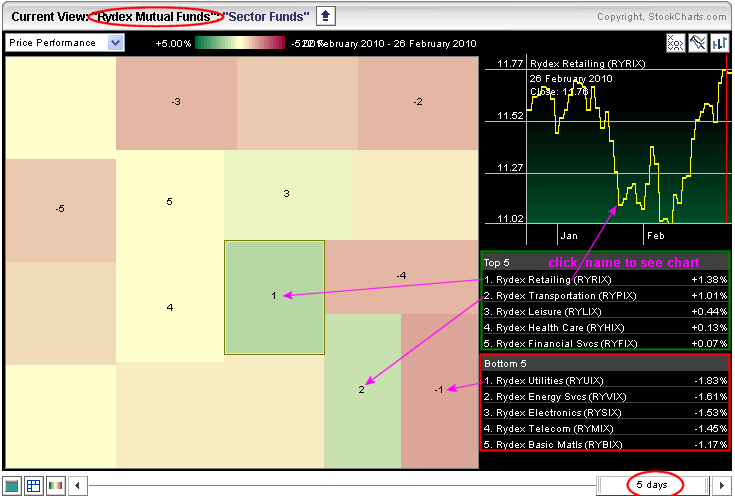
Retail leads Rydex Funds
by Arthur Hill,
Chief Technical Strategist, TrendInvestorPro.com
The Market Carpet for the Rydex Sector Funds shows the Rydex Retailing Fund (RYRIX) leading the way higher last week. Notice that the slider at the bottom is set at 5 days to show last week's results. The Rydex Transportation Fund (RYPIX) came in second with a 1....
READ MORE