MEMBERS ONLY
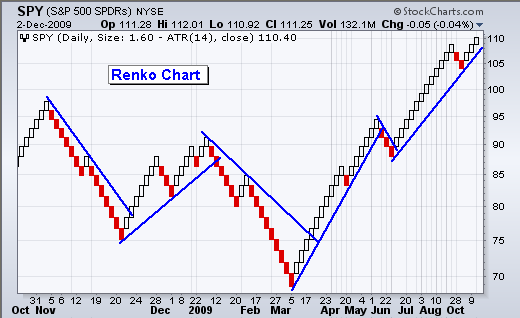
Renko charts filter the noise
by Arthur Hill,
Chief Technical Strategist, TrendInvestorPro.com
The chart below shows a Renko chart for the S&P 500 ETF (SPY). Like Point & Figure, these charts focus on price action, independent of time. Notice that the first half of the chart extends from late October 2008 to early March 2009. The second half extends from...
READ MORE
MEMBERS ONLY
A volatility contraction for SPY
by Arthur Hill,
Chief Technical Strategist, TrendInvestorPro.com
Despite three up gaps in the last three weeks and a volatile range on the 60-minute chart, SPY remains stuck in a trading range with contracting volatility on the daily chart. The chart shows Bollinger Bands (10,2) with Bollinger Band Width in the indicator window. Bollinger Band Width measures...
READ MORE
MEMBERS ONLY
Airlines go from lagging to leading
by Arthur Hill,
Chief Technical Strategist, TrendInvestorPro.com
After underperforming the S&P 500 in October, the Amex Airline Index ($XAL) reversed course to become a leader in November. This leadership role picked up steam the last three days as XAL broke above consolidation resistance. The indicator window shows the price relative ($XAL:$SPX ratio). $XAL outperforms...
READ MORE
MEMBERS ONLY
SPY extends volatile range
by Arthur Hill,
Chief Technical Strategist, TrendInvestorPro.com
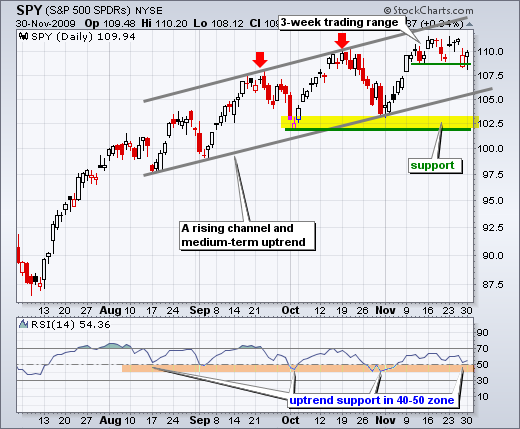
SPY gapped up and held its gains to close above 111 for the fifth time in eleven days. There is no change in the medium-term picture. SPY remains within a rising price channel overall with key support around 102. The ETF surged above 110 the second week of October and...
READ MORE
MEMBERS ONLY
Japan lags Europe and China
by Arthur Hill,
Chief Technical Strategist, TrendInvestorPro.com
The US and European markets bottomed in early July and have been moving higher the last five months. These indices are up 18-23% since early July. The Shanghai Composite ($SSEC) is also up, but less than 5% and lagging the US and Europe. In stark contrast to these gainers, the...
READ MORE
MEMBERS ONLY
Tuesday video includes...
by Arthur Hill,
Chief Technical Strategist, TrendInvestorPro.com
-SPY shows resilience
-QQQQ forms falling flag
-IWM and the January effect
-Key sectors with short-term downtrends
-Stocks with bullish setups:
CAKE, CHK, CSCO, DELL, INTC, NVDA and OMC
-Click here for the video page...
READ MORE
MEMBERS ONLY
Stocks with bullish setups
by Arthur Hill,
Chief Technical Strategist, TrendInvestorPro.com
A number of stocks, ETFs and indices gapped down on Friday and then firmed on Monday. Friday's gap and decline endorsed the bearish case, but firmness on Monday shows indecision. The ability to fill Friday's gap would be considered bullish. Keep this in mind when reviewing...
READ MORE
MEMBERS ONLY
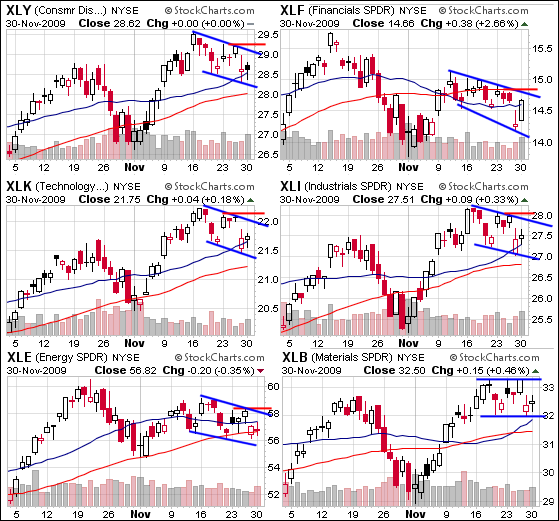
ST downtrends in the sector SPDRs
by Arthur Hill,
Chief Technical Strategist, TrendInvestorPro.com
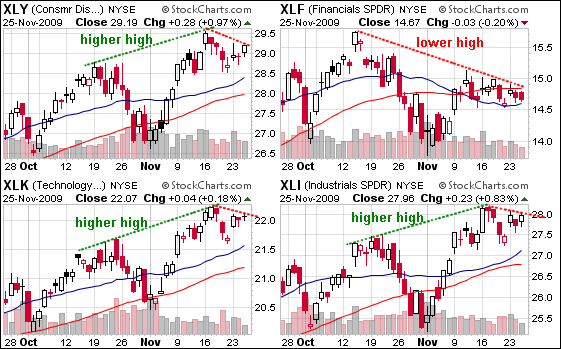
On the CandleGlance charts, the four offensive sectors sport falling consolidations over the last 2-3 weeks. After recording higher highs in mid November, the Consumer Discretionary SPDR (XLY), Technology SPDR (XLK) and Industrials SPDR (XLI) pulled back with falling flags over the last two weeks. Technically, we could call the...
READ MORE
MEMBERS ONLY
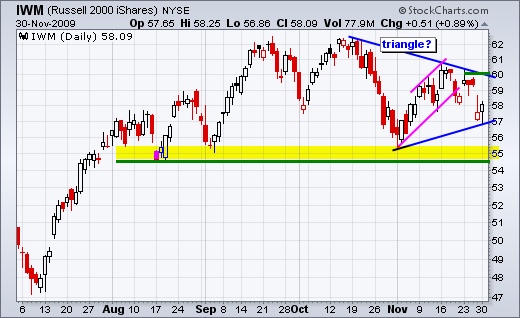
IWM and the January effect
by Arthur Hill,
Chief Technical Strategist, TrendInvestorPro.com
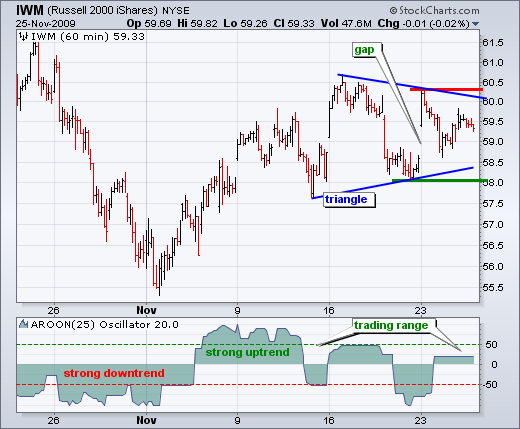
While the rising flag (pink) and support break at 58 were bearish for IWM, we must always be prepared for the unexpected when dealing with the stock market. What would be the precursor if IWM were to move above 62 by yearend? First, we must not forget the January effect,...
READ MORE
MEMBERS ONLY
A bull flag for QQQQ
by Arthur Hill,
Chief Technical Strategist, TrendInvestorPro.com
There is no denying the uptrend in QQQQ over the last few months. Even with the pullback over the last two weeks, QQQQ is within spitting distance of its 2009 high. Moreover, this pullback looks like a falling flag, which is a bullish consolidation. A break above flag resistance would...
READ MORE
MEMBERS ONLY
SPY: bulls show resilience
by Arthur Hill,
Chief Technical Strategist, TrendInvestorPro.com
Despite negative ramblings with Dubai and black Friday, the S&P 500 ETF (SPY) is showing resilience on the daily chart. SPY gapped down on Friday, but closed well above its open to form a white candlestick. Even though Monday's candlestick shows an intraday dip to 108....
READ MORE
MEMBERS ONLY
Silver and Gold Perfchart
by Arthur Hill,
Chief Technical Strategist, TrendInvestorPro.com
It has been a big year for gold, but an even bigger year for silver. As the Perfchart shows, $SILVER underperforms $GOLD on the way down and outperforms on the way up. Silver was down more than gold in April and July, but up more than gold in June and...
READ MORE
MEMBERS ONLY
SPY: Short-term trend reversal
by Arthur Hill,
Chief Technical Strategist, TrendInvestorPro.com
Friday's decline reversed the short-term uptrend, but the medium-term trend remains up. On the daily chart, SPY has been zigzagging higher the last 3-4 months. After moving above its October high in mid November, SPY stalled around 110 with choppy trading for two weeks. Friday's gap...
READ MORE
MEMBERS ONLY
Intermarket chart page updated
by Arthur Hill,
Chief Technical Strategist, TrendInvestorPro.com
-Bonds show relative strength with a 5-month closing high
-Another new low in short-term rates weighs on the Dollar
-Gold remains overextended, but still strong
-The 5-week downtrend in oil looks like a falling flag
-Bonds surge with biggest 2-week surge since November 2008
- Click here for the intermarket...
READ MORE
MEMBERS ONLY
Friday video includes...
by Arthur Hill,
Chief Technical Strategist, TrendInvestorPro.com
-SPY stalls near resistance
-IWM traces out a symmetrical triangle
-Medium-term Evidence Remains Bullish
-Defensive sectors perking up
-Interest rates and the Dow
-Bond ETF holds resistance breakout
-Click here for the video page...
READ MORE
MEMBERS ONLY
FTSE plunges on Dubai concerns
by Arthur Hill,
Chief Technical Strategist, TrendInvestorPro.com
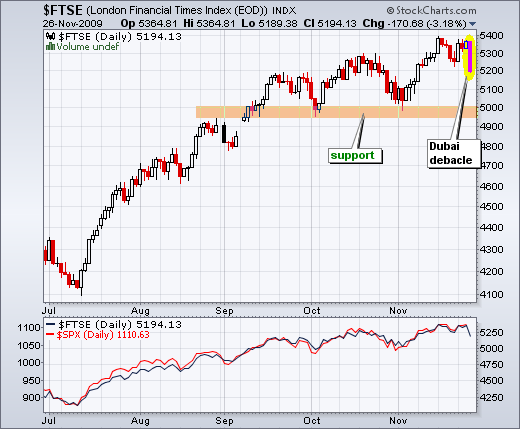
The London FTSE ($FTSE) dropped over 3% on the prospects of a sovereign default from Dubai. Even with this sharp decline, the medium-term trend is up as the index recorded a new reaction high just two weeks ago. Major support is set in the 4950-5000 area. A break below this...
READ MORE
MEMBERS ONLY
SPY stalls near resistance
by Arthur Hill,
Chief Technical Strategist, TrendInvestorPro.com
The medium-term trend remains up for SPY, but the going is getting tough around 110. The S&P 500 ETF (SPY) first moved above 110 on November 11th, eleven trading days ago. Since first moving above 110, the ETF has seesawed above and below this level at least four...
READ MORE
MEMBERS ONLY
IWM traces out symmetrical triangle
by Arthur Hill,
Chief Technical Strategist, TrendInvestorPro.com
The Russell 2000 ETF (IWM) is stalling with a symmetrical triangle over the last two weeks. Because the prior move was up, there is still a bullish bias overall. However, the ensuing break will determine the next directional signal for IWM. A move above this week's high would...
READ MORE
MEMBERS ONLY
MT Evidence Remains Bullish
by Arthur Hill,
Chief Technical Strategist, TrendInvestorPro.com
Note that current evidence does not include Friday's trading. The S&P 500 is down around 3% in pre-market trading. This move could be an overreaction in thin trading or more. I will review the table and indicators on Monday as well. Despite some bearish indicators and...
READ MORE
MEMBERS ONLY
Breadth charts updated
by Arthur Hill,
Chief Technical Strategist, TrendInvestorPro.com
-Nasdaq AD Line forms a bearish flag
-Nasdaq AD Volume Line forms lower high in November (bearish divergence)
-Nasdaq Net New Highs remain positive, but there were fewer in November
-NYSE AD Line remains in bull mode and above support
-NYSE AD Volume Line forms lower high in November (bearish...
READ MORE
MEMBERS ONLY
Defensive sectors perking up
by Arthur Hill,
Chief Technical Strategist, TrendInvestorPro.com
The next two Candleglance groups show the four offensive sectors (technology, finance, industrials, technology) and the three defensive sectors (healthcare, utilities, consumer staples). Three of the four offensive sectors moved to new reaction highs in mid November. Only the Financials SPDR failed to exceed its October high and show relative...
READ MORE
MEMBERS ONLY
Interest rates and the Dow
by Arthur Hill,
Chief Technical Strategist, TrendInvestorPro.com
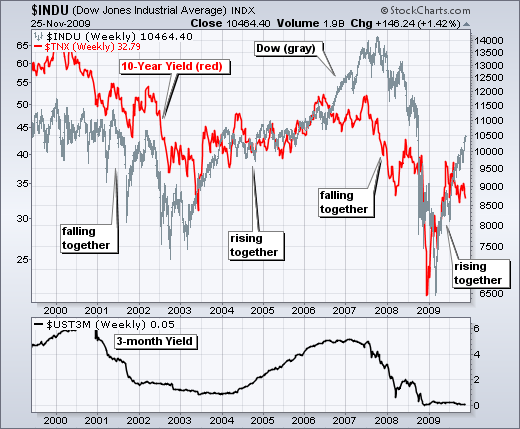
Over the last ten years, there is generally a positive correlation between long-term interest rates and the Dow Industrials. The 10-Year Treasury Yield ($TNX) and the Dow fell from 2000 to 2003, rose from 2003 to 2007, fell from 2007 to 2008 and rose in 2009. Falling interest rates were...
READ MORE
MEMBERS ONLY
Bond ETF holds breakout
by Arthur Hill,
Chief Technical Strategist, TrendInvestorPro.com
The 20+ Year Treasury ETF (TLT) continues to exhibit strength with a wedge breakout. Notice that the ETF broke resistance with a gap above 94. More importantly, notice that this gap is holding and TLT moved higher the last two days. With higher lows in July and November, the bigger...
READ MORE
MEMBERS ONLY
Dollar weakness not helping oil
by Arthur Hill,
Chief Technical Strategist, TrendInvestorPro.com
Despite strength in stocks and weakness in the Dollar, the US Oil Fund ETF (USO) is down for the month of November. It is not much, but it is still surprising and merits attention. Strength in stocks points to strength in the economy, which should increase demand for oil. Commodities...
READ MORE
MEMBERS ONLY
FLR Fails - CIEN Firms
by Arthur Hill,
Chief Technical Strategist, TrendInvestorPro.com
Based on the November 16th close, Fluor (FLR) was featured after the stock bounced on good volume. Even though FLR was still in a downtrend, it was at retracement support and the bounce occurred on good volume. This bounce has now failed. First, follow through was weak the next two...
READ MORE
MEMBERS ONLY
SPY: Upswing within trading range
by Arthur Hill,
Chief Technical Strategist, TrendInvestorPro.com
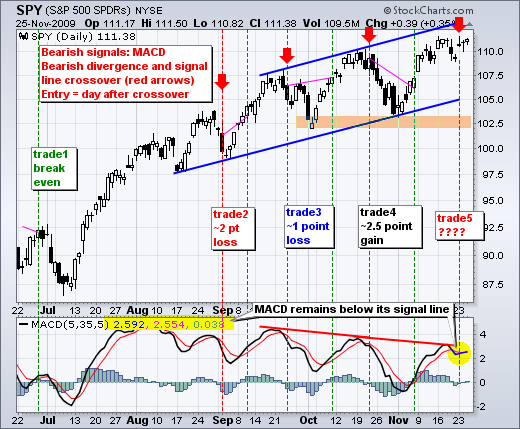
I am showing three charts for the S&P 500 ETF (SPY) today. The first shows daily candlesticks with MACD(5,35,5). SPY is trending up with higher highs and higher lows, but MACD(5,35,5) is trending down with lower highs and lower lows. Even though...
READ MORE
MEMBERS ONLY
Energy lagging in November
by Arthur Hill,
Chief Technical Strategist, TrendInvestorPro.com
The sector PerfChart from 30-Oct to 23-Nov shows energy as the weakest of the nine sectors. The shaded S&P 500 tab means performance is measured relative to the S&P 500. The percentage changes are not absolute, but rather over or under performance relative to the S&...
READ MORE
MEMBERS ONLY
Video analysis for Tuesday
by Arthur Hill,
Chief Technical Strategist, TrendInvestorPro.com
-SPY gaps off support
-MACD(5,35,5) crossover signal for SPY
-T-Bill rate near zero again
-Financials SPDR lags overall market
-3 key banks to watch (GS,JPM,STT)
-Gold gets frothy on the daily chart
-US Dollar Index remains in downtrend
-Bullish flag in oil extends
-30-year Treasury...
READ MORE
MEMBERS ONLY
Intermarket chart page updated
by Arthur Hill,
Chief Technical Strategist, TrendInvestorPro.com
Intermarket highlights include:
-Gold continues to lead the intermarket group
-Gold is looking frothy on the daily chart
-Look for a break above 76 to show strength in the Dollar.
-Oil remains with extended flag consolidation
-The long bond broke resistance with a gap-surge
- Click here for intermarket chart...
READ MORE
MEMBERS ONLY
3 Key Banks (GS, JPM, STT)
by Arthur Hill,
Chief Technical Strategist, TrendInvestorPro.com
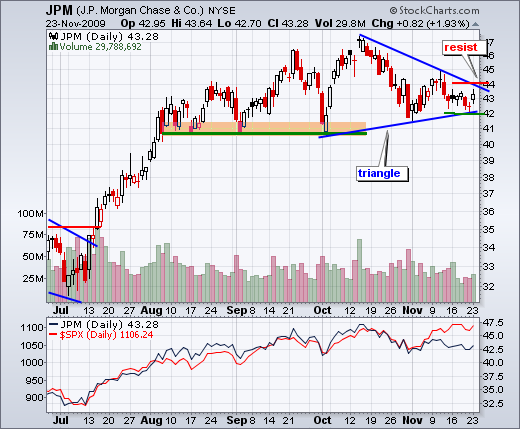
JP Morgan Chase (JPM) is the biggest holding (12.08%) in the Financials SPDR (XLF). As with XLF, JPM is showing relative weakness as it trades well below its October high. The stock is currently testing support from the triangle trendline extending up from the October low. Trading has been...
READ MORE
MEMBERS ONLY
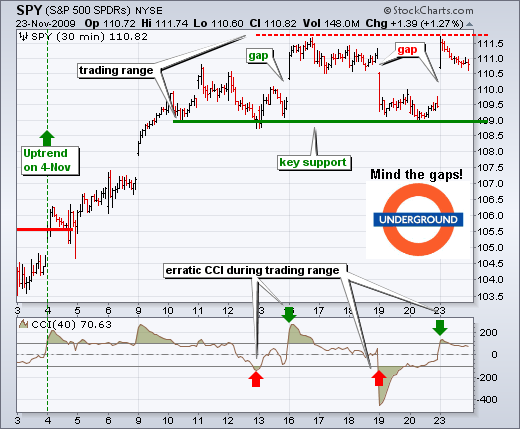
Mind the Gaps
by Arthur Hill,
Chief Technical Strategist, TrendInvestorPro.com
With another gap-surge on Monday, SPY has gapped up the last four Mondays (November 4, 9, 16 and 23). The first three gaps were part of an uptrend, but the fourth occurred within a trading range. Also notice that SPY gapped up-down-up over the last six trading days. Talk about...
READ MORE
MEMBERS ONLY
Why are Tbill rates near zero again?
by Arthur Hill,
Chief Technical Strategist, TrendInvestorPro.com
I featured the 3-month T-Bill Rate ($IRX) near zero last Wednesday and Mark Hulbert wrote about this phenomenon in is commentary for Tuesday. Based on my analysis, low short-term rates reflect Fed policy and put downward pressure on the Dollar. Chicago Fed President Evans suggested no-change in Fed policy until...
READ MORE
MEMBERS ONLY
XLF Continues to Lag
by Arthur Hill,
Chief Technical Strategist, TrendInvestorPro.com
While the Dow and S&P 500 moved to new reaction highs in November, the Financials SPDR (XLF) remains well below its October high. XLF is clearly not keeping pace with the broader market. Such relative weakness can foreshadow absolute weakness and a potential break down. XLF surged above...
READ MORE
MEMBERS ONLY
Wells Fargo shows relative weakness
by Arthur Hill,
Chief Technical Strategist, TrendInvestorPro.com
Even though the S&P 500 is up sharply over the last four weeks, Wells Fargo (WFC) is just flat and shows relative weakness. After a surge the first few days of November, WFC traded flat with a small triangle. Watch this neutral pattern for clues on the future....
READ MORE
MEMBERS ONLY
Flags breaks and MACD crosses
by Arthur Hill,
Chief Technical Strategist, TrendInvestorPro.com
With a little weakness on Friday, SPY broke below flag support on the 30-minute chart and MACD(5,35,5) moved below its signal line on the daily chart. First, let's look at the daily chart. For the fifth time since June, MACD formed a bearish divergence and...
READ MORE
MEMBERS ONLY
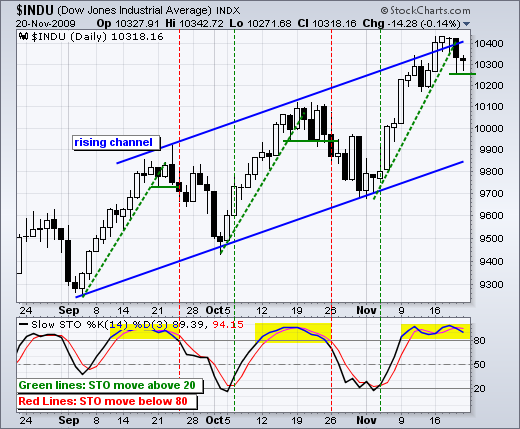
Dow Hits Top of Channel
by Arthur Hill,
Chief Technical Strategist, TrendInvestorPro.com
The Dow has been moving higher the last three months with surges early in the month and pullbacks later in the month. Notice how the Dow bottomed in early September, early October and early November. Also notice how the Dow peaked in mid September and mid October. Here we are...
READ MORE
MEMBERS ONLY
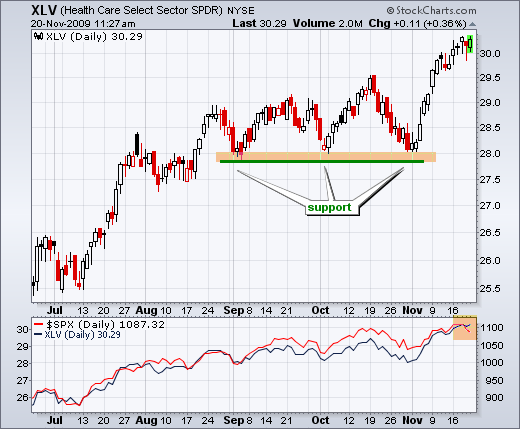
Healthcare showing relative strength
by Arthur Hill,
Chief Technical Strategist, TrendInvestorPro.com
The Healthcare SPDR (XLV) broke above its October high two weeks ago and continued above 30 this week. Even though stocks were weak across the board on Thursday, healthcare managed to show relative strength with a smaller loss. Eight of the nine sectors were down in early trading Friday, but...
READ MORE
MEMBERS ONLY
Video analysis for Friday includes...
by Arthur Hill,
Chief Technical Strategist, TrendInvestorPro.com
-Performance anxiety and seasonality
-The split-month pattern in SPY
-Bear flags on the 30-minute charts
-Medium-term Evidence Remains Bullish
-Breadth is mixed overall
-Bullish% for consumer discretionary sector lags
-VIX forms inverse head-and-shoulders
-SPY momentum remains bullish
-Small-caps continue to lag large-caps
-Short-term rates hit new lows again
-TLT breaks...
READ MORE
MEMBERS ONLY
Performance anxiety and seasonality
by Arthur Hill,
Chief Technical Strategist, TrendInvestorPro.com
Tops are complicated beasts that usually take time to evolve. Bottoms, on the other hand, form quicker and often feature some sort of quick "V" reversal. Stocks are well off their March lows after a powerful rally the last nine months. The Dow, S&P 500 and...
READ MORE
MEMBERS ONLY
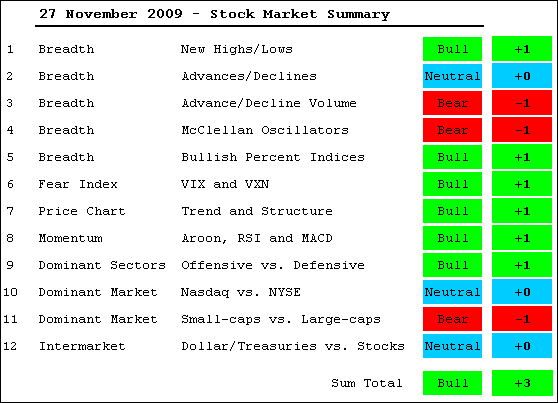
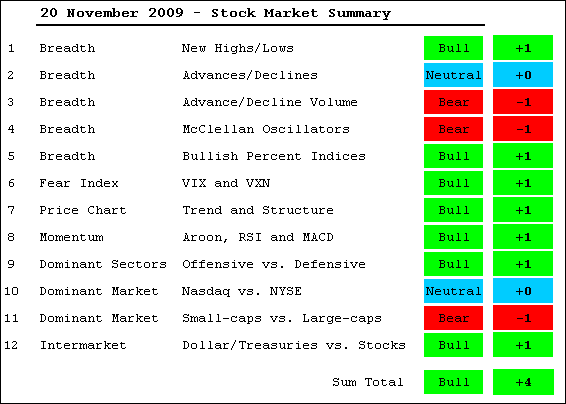
Medium-term evidence remains bullish
by Arthur Hill,
Chief Technical Strategist, TrendInvestorPro.com
The warnings signs continue, but the bulk of the medium-term evidence remains bullish. On the negative side, breadth has been deteriorating the last few weeks. Small-caps and the finance sector have been relatively week since October. Bonds surged this week in what could be a flight to quality as we...
READ MORE