MEMBERS ONLY
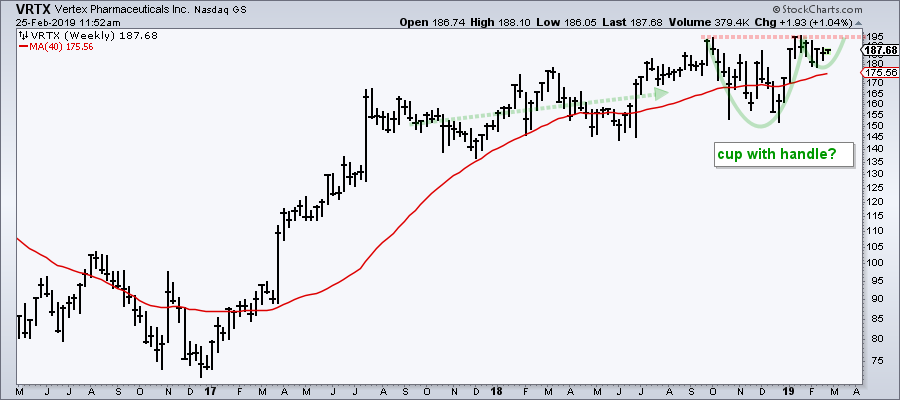
Vertex Forges Bullish Setups on Two Timeframes
by Arthur Hill,
Chief Technical Strategist, TrendInvestorPro.com
The daily chart for Vertex (VRTX) is quite a mess with several dips under the 200-day SMA over the last ten months, but a short-term bullish pattern is shaping up and the weekly chart also sports a bullish setup.
Let's look at the weekly chart first because the...
READ MORE
MEMBERS ONLY
Just how Effective is the 200-day Moving Average?
by Arthur Hill,
Chief Technical Strategist, TrendInvestorPro.com
The 200-day moving average is perhaps the most widely used moving average and the S&P 500 is the most widely followed benchmark for the U.S. stock market. Taken together, the S&P 500 and the 200-day SMA can be used to identify major trends in the...
READ MORE
MEMBERS ONLY
Weekly Market Review & Outlook - Utes Lead as Finance Improves
by Arthur Hill,
Chief Technical Strategist, TrendInvestorPro.com
* Mid-caps and Small-caps Join Large-caps.
* Breadth Tables Improve.
* XLU Shows Strongest Breadth.
* Changing My Mindset.
* Home Construction iShares Clears 200-day.
* Three Flags at Different Breakout Stages.
* Pfizer Gets Second Breakout.
* Berry Plastics Completes Big Reversal.
* Expedia Breaks Channel.
* ChartList Notes and Deletions.
... Mid-caps and Small-caps Join Large-caps
... The Mid-Cap %Above...
READ MORE
MEMBERS ONLY
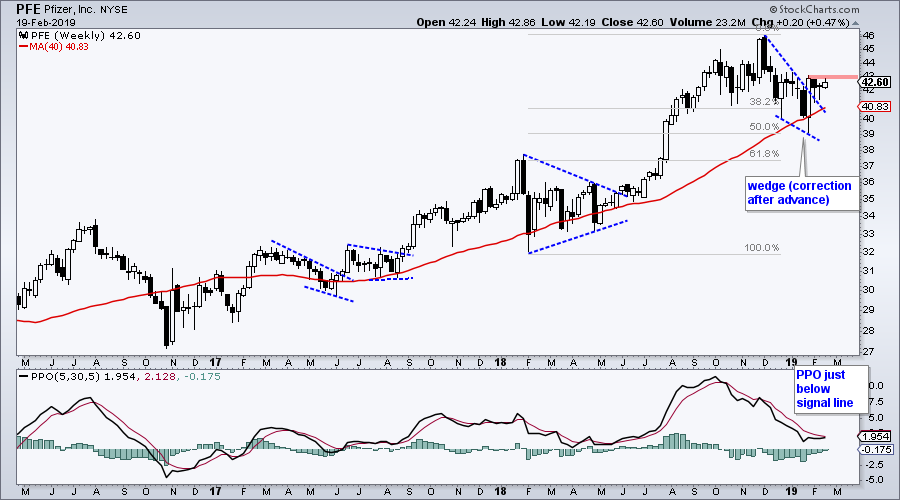
Pfizer Bids to End Correction
by Arthur Hill,
Chief Technical Strategist, TrendInvestorPro.com
When sitting down to a chart, or even standing, establishing the direction of the bigger trend is the first task. The direction of this trend establishes my trading bias and tells me where to focus. My trading bias is bullish when the trend is up and this means I focus...
READ MORE
MEMBERS ONLY
Breadth Indicators Flip as Big Banks Take the Lead
by Arthur Hill,
Chief Technical Strategist, TrendInvestorPro.com
* Six of Nine Breadth Indicators Bullish.
* November 2015 All Over Again?
* JP Morgan, Bank of America and Citigroup Break Out.
* A Successful Test for Disney.
* ChartList Addition and Deletion.
* On Trend on YouTube.
Breadth Indicators Flip Back to Bullish
The S&P 500 turned net bullish on February 5th...
READ MORE
MEMBERS ONLY
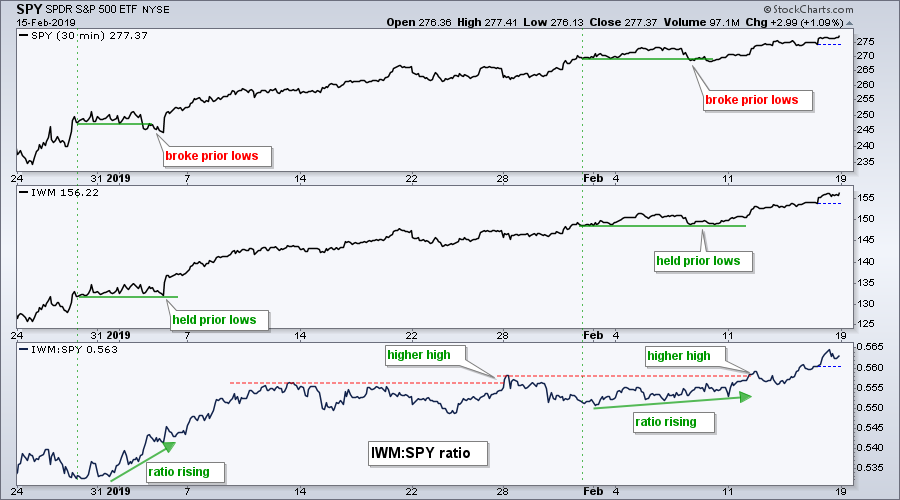
Techniques to Spot Early Signs of Relative Strength
by Arthur Hill,
Chief Technical Strategist, TrendInvestorPro.com
Chartists can compare two price plots to find early signs of relative strength. This can be done by comparing the corresponding peaks or troughs for two names, such as the Russell 2000 iShares (IWM) and the S&P 500 SPDR (SPY). It is a sign of relative strength when...
READ MORE
MEMBERS ONLY
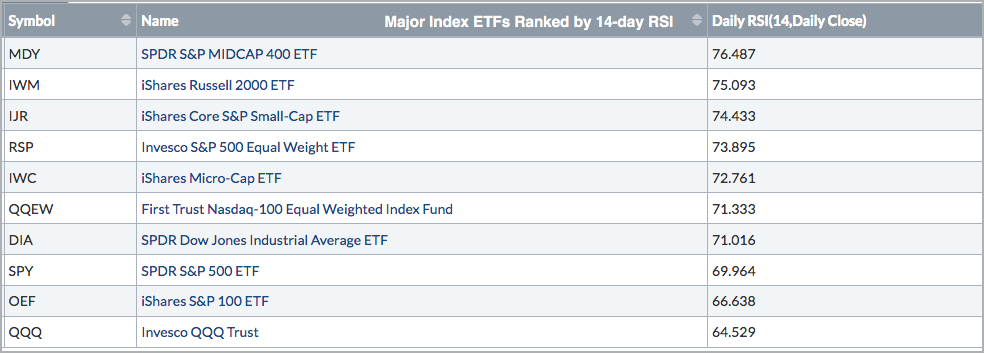
Small and Mid Caps Take the Momentum Lead
by Arthur Hill,
Chief Technical Strategist, TrendInvestorPro.com
The Relative Strength Index (RSI) is a momentum indicator that chartists can use to measure the strength behind a price move. Moreover, chartists can also use RSI values to rank momentum and find the leaders.
As an indicator that measures the magnitude of gains relative to the magnitude of losses,...
READ MORE
MEMBERS ONLY
Weekly Market Review & Outlook (w/Video) - S&P 500 Tilts Bullish
by Arthur Hill,
Chief Technical Strategist, TrendInvestorPro.com
* Reviewing the Weight of the Evidence
* New Highs Expand in XLK
* Sector Table is Net Bullish (XLK, XLV, XLI Lead)
* What If December-January Never Happened?
* Four Consolidations to Watch (XLF, IAI, XRT, IBB)
* New Additions to the ChartList
* AMD Keeps Flag Alive
* Finisar Holds Breakout
* Intuitive Surgical Breaks Pennant
* Walgreens-Boots...
READ MORE
MEMBERS ONLY
China Goes for a Breakout
by Arthur Hill,
Chief Technical Strategist, TrendInvestorPro.com
Chinese stocks came to life after their New Year's holiday with the Shanghai Composite ($SSEC) and some ETFs breaking double bottom resistance. Before looking at these charts, let's review the double bottom, which is a bullish reversal pattern. First and foremost, there must be a downtrend...
READ MORE
MEMBERS ONLY
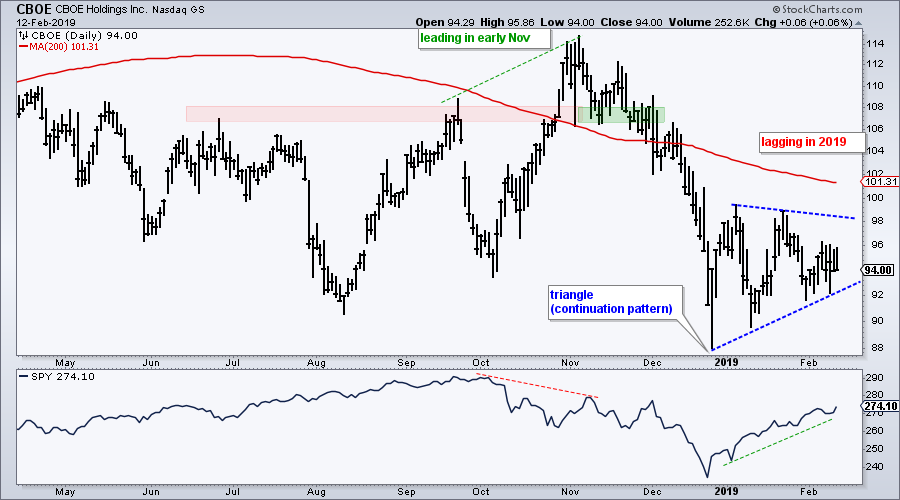
CBOE Holdings Fails to Bounce
by Arthur Hill,
Chief Technical Strategist, TrendInvestorPro.com
We are 29 trading days into 2019 and the S&P 500 is up a very respectable 9.49%. Furthermore, some 465 stocks in the S&P 500 are up year-to-date, which means 35 are down year-to-date. CBOE Holdings (CBOE) is one of these stocks (-3.91% year-to-date)...
READ MORE
MEMBERS ONLY
New Highs Expand - Plus Four Stocks
by Arthur Hill,
Chief Technical Strategist, TrendInvestorPro.com
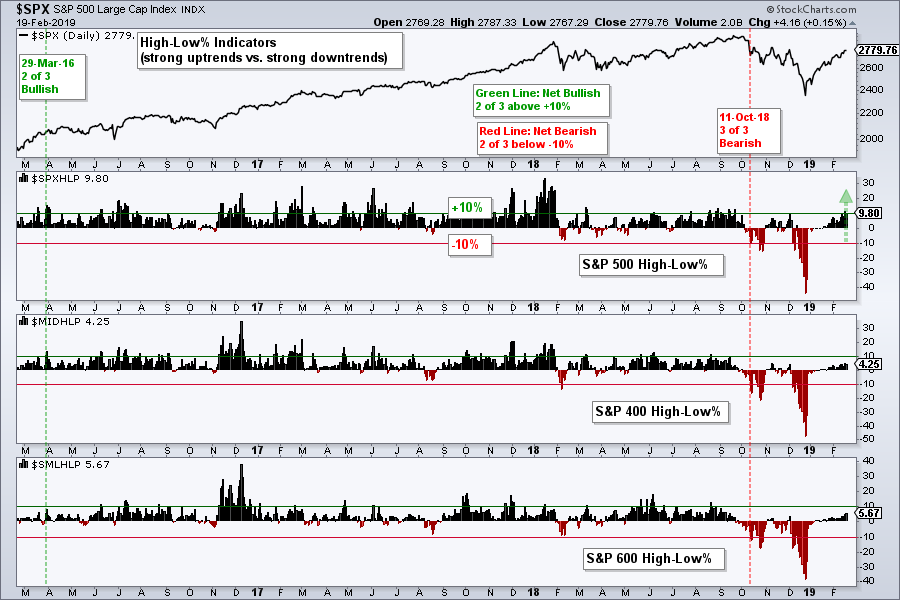
* SPX High-Low Percent Nears Signal Flip.
* Intuitive Surgical Breaks Out.
* Walgreens-Boots Bounces off 200-day.
* Careful with AMD.
* RSI Improvements in Intel.
... Five of the nine breadth indicators are on bearish signals right now, but S&P 500 High-Low% ($SPXHLP) reached 9.8% on Tuesday and is close to triggering...
READ MORE
MEMBERS ONLY
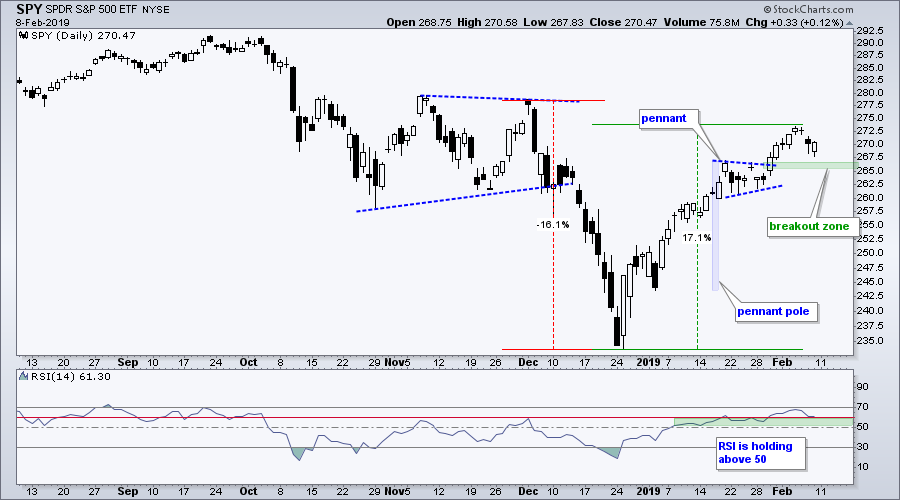
Pennant Breakouts Remain in Play for SPY and QQQ - Six Stocks Consolidating above their 200-day SMAs
by Arthur Hill,
Chief Technical Strategist, TrendInvestorPro.com
... The stock market took a rest last week as the S&P 500 stalled in the 2708 area, which is just below the 200-day SMA. Note that the S&P 500 rose 24 of the last 31 days and gained around 15% in six weeks. It still looks...
READ MORE
MEMBERS ONLY
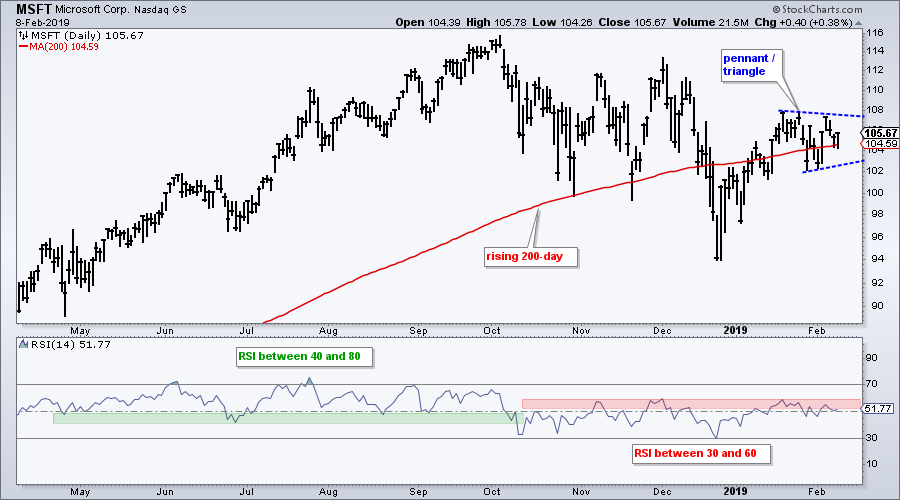
Microsoft Bids for a Momentum Shift
by Arthur Hill,
Chief Technical Strategist, TrendInvestorPro.com
Microsoft is battling the rising 200-day moving average and making a bid to shift momentum back to the bulls.
The chart shows MSFT falling along with the market from October to December and then rebounding sharply in January. The stock is currently consolidating around the 200-day SMA with a pennant,...
READ MORE
MEMBERS ONLY
Weekly Market Review & Outlook (with Video) - When to Tread Carefully
by Arthur Hill,
Chief Technical Strategist, TrendInvestorPro.com
* Breadth Indicators Fall Short.
* S&P 500 Backs off the 40 Week.
* When to Tread Carefully.
* Offensive Sectors Weigh.
* Sector with Lowest Correlation to $SPX.
* Utes Lead the Market.
* Bond ETFs Consolidate within Uptrends.
* ChartList Notes, Additions and Deletions.
... Breadth Indicators Fall Short
... The advance from late December to...
READ MORE
MEMBERS ONLY
Finance Sector Hits Moment-of-truth - Chart, Scan and Analyze the Bollinger Band Squeeze
by Arthur Hill,
Chief Technical Strategist, TrendInvestorPro.com
* XLF Goes from Leader to Laggard.
* XLF Hits Resistance and Retracement.
* Bollinger Band Squeeze Chart.
* Bollinger Band Squeeze Scan Code.
* On Trend on StockChartsTV
...XLF Goes from Leader to Laggard
...The Financials SPDR (XLF) went from leader to laggard over the last six weeks as the broad market advance narrowed....
READ MORE
MEMBERS ONLY
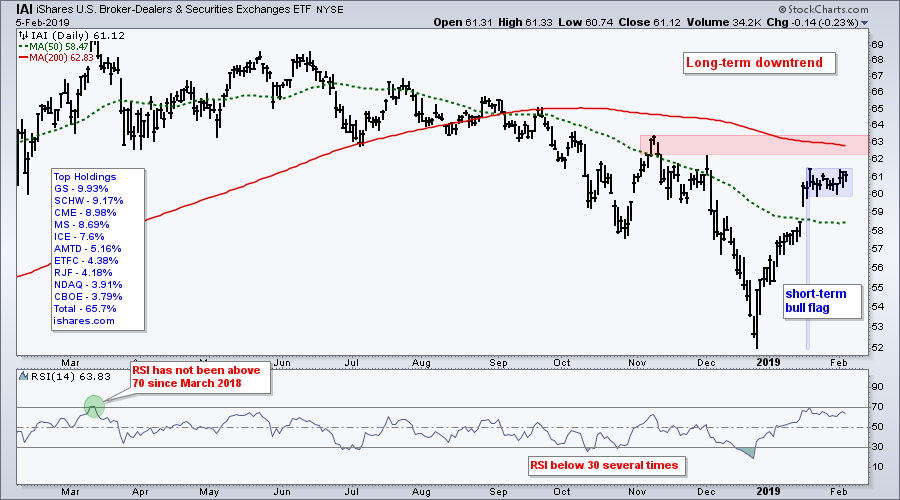
The Broker-Dealer iShares and Top Holdings Stall - Plus three Stocks
by Arthur Hill,
Chief Technical Strategist, TrendInvestorPro.com
The Broker-Dealer iShares (IAI) led the market rebound from December 24th to January 18th and then stalled out over the last two weeks.
As with the broader market, we can see two conflicting trends. The long-term trend is down because IAI hit a 52-week low in late December, remains below...
READ MORE
MEMBERS ONLY
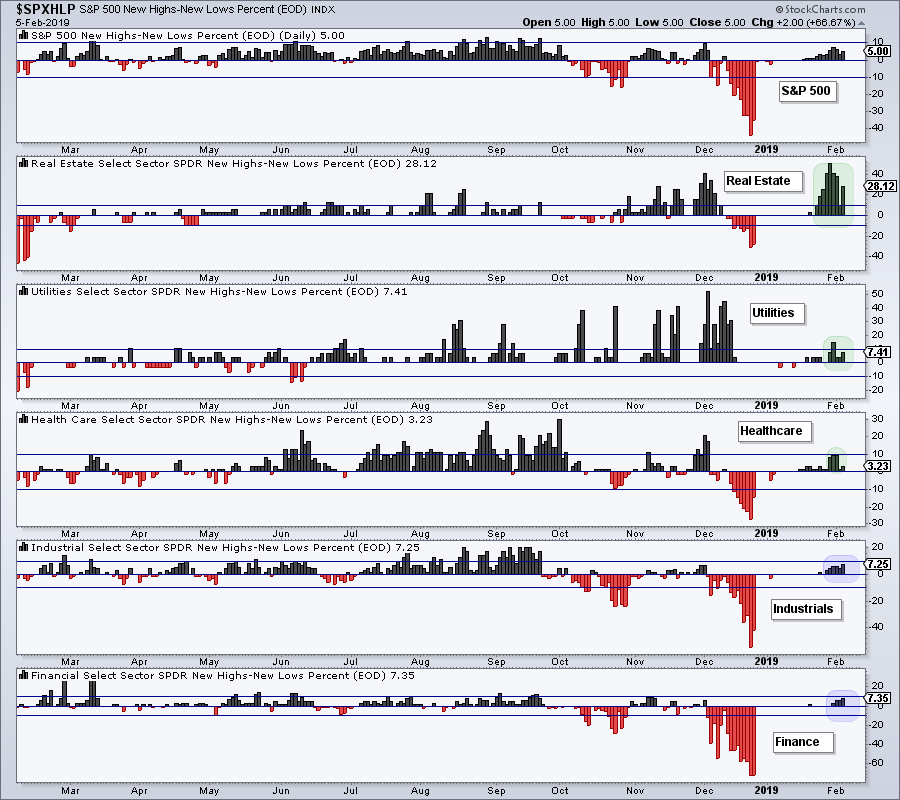
REITs, Utes and Healthcare Lead New High List
by Arthur Hill,
Chief Technical Strategist, TrendInvestorPro.com
Chartists looking for the sectors with the most stocks in strong uptrends can turn to the High-Low Percent indicators. High-Low Percent equals new 52-week highs less new 52-week lows divided by total issues. This indicator is positive when new highs outnumber new lows and negative when new lows outnumber new...
READ MORE
MEMBERS ONLY
Amazon and the Seismic RSI Shift
by Arthur Hill,
Chief Technical Strategist, TrendInvestorPro.com
The overall trend for Amazon shifted from bullish to bearish in October and RSI caught this shift.
Before looking at RSI, let's review price action and the bigger trend at work. The chart shows Amazon moving to a new high in early September, forming a lower high in...
READ MORE
MEMBERS ONLY
Between a Rock and a Hard Place
by Arthur Hill,
Chief Technical Strategist, TrendInvestorPro.com
* Extended but Not Overbought.
* SPY and QQQ Form Doji.
* %Above 20-day EMA Holds Strong.
* 4 Sector SPDRs above their 200-day SMAs.
* On Trend on StockChartsTV.
... The stock market is in a tricky spot because the short-term uptrends are quite extended and the long-term trends are still down. The chart below...
READ MORE
MEMBERS ONLY
Putting January Into Perspective
by Arthur Hill,
Chief Technical Strategist, TrendInvestorPro.com
One's outlook often depends on one's timeframe. This outlook can also be influenced by recent price action or a recency bias. The S&P 500 surged 7.87% in January and recorded its biggest monthly advance since October 2015. This surge, however, was preceded by...
READ MORE
MEMBERS ONLY
Weekly Market Review & Outlook (w/ video) - The Broken Record
by Arthur Hill,
Chief Technical Strategist, TrendInvestorPro.com
* Putting January Into Perspective.
* Still Below December High.
* Another Reversal Zone Appears.
* SPY and the Pennant Breakout.
* Participation begins the Wane.
* REITs, Utes and Healthcare Lead New Highs.
* XLU Extends on Breakout.
* Charts that Make me Throw my Hands Up.
* Choosing Another Timeframe.
* The Powell Put Comes to Life.
* Homebuilders...
READ MORE
MEMBERS ONLY
Autozone Gets Back in Gear
by Arthur Hill,
Chief Technical Strategist, TrendInvestorPro.com
Autozone (AZO) is a leading stock because it recorded a 52-week high in December and remains above the rising 200-day SMA. The S&P 500, on the other hand, recorded a 52-week low in December and remains below its 200-day SMA.
The chart below shows AZO with a falling...
READ MORE
MEMBERS ONLY
Short-Term Consolidations Unfold within Conflicting Trends
by Arthur Hill,
Chief Technical Strategist, TrendInvestorPro.com
* Moving into the Prior Battle Zone.
* Pennant versus Gap for SPY.
* Lowest Close in two Weeks for QQQ.
* IWM Holds Up the Best.
* Divide and Conquer with Sector Analysis.
... Moving into the Prior Battle Zone
... It's a mixed-up world out there as two trends compete and the major...
READ MORE
MEMBERS ONLY
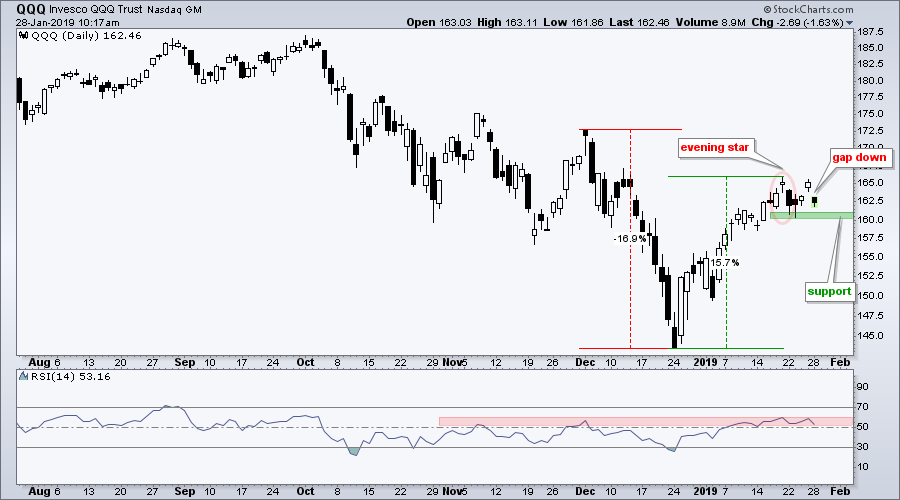
Another Gap for QQQ
by Arthur Hill,
Chief Technical Strategist, TrendInvestorPro.com
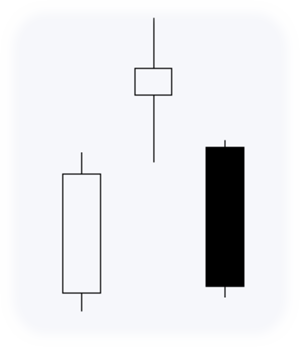
Last week (Monday) I featured an evening star reversal pattern in QQQ. This pattern did not foreshadow further weakness as QQQ firmed in the 161 area the next day and gapped up on Friday. This gap did not last long as QQQ gapped down on Monday morning and filled Friday&...
READ MORE
MEMBERS ONLY
Charts to Keep an Eye on this Week
by Arthur Hill,
Chief Technical Strategist, TrendInvestorPro.com
* Big Four Retake 50-day SMAs.
* %Above 200-day Lags for XLP.
* 52-week Highs for 22 REITs.
* Jobless Claims Hit 40+ Year Low.
* TLT Stalls between Key Levels.
* Dollar Fails to Hold Breakout.
* Gold Breaks out of Small Consolidation.
* Shanghai Composite Forms Potential Double Bottom.
* Delta Turns Indecisive.
* Tesla Goes from Leader...
READ MORE
MEMBERS ONLY
Weekly Market Review & Outlook - A Race to the 200-day
by Arthur Hill,
Chief Technical Strategist, TrendInvestorPro.com
* Big Move within Bigger Downtrend.
* The Bullish Turn of the Month.
* S&P 500 Could Challenge 200-day.
* Junk Bonds Surge to Breakdown Zone.
* Key Supports for Big Six Sectors.
* Bull Flags in ITB and XHB.
* Bonds Turning Up ahead of Fed.
* International ETFs Outperforming S&P.
... Big Move...
READ MORE
MEMBERS ONLY
Reversal Signs Appearing in SPY and TLT - XLC is Leading Lower
by Arthur Hill,
Chief Technical Strategist, TrendInvestorPro.com
* SPY Forges a Gap-Gap Reversal
* What Makes this Wedge Break Significant?
* TLT Turns up from Oversold Levels.
* XLC is the First to Break.
... The mood of the market appears to be changing as stocks weaken and bonds strengthen. It looks like short-term trends are trying to reverse. The first chart...
READ MORE
MEMBERS ONLY
A Rare Evening Star Forms in QQQ
by Arthur Hill,
Chief Technical Strategist, TrendInvestorPro.com
Despite a 15% surge the prior 17 days, the Nasdaq 100 ETF (QQQ) remains below its flattening 200-day SMA and the ETF formed a rare evening star candlestick pattern over the last three days.
First and foremost, I think the long-term trend is down for QQQ. The ETF recorded a...
READ MORE
MEMBERS ONLY
To Chase or Not to Chase?
by Arthur Hill,
Chief Technical Strategist, TrendInvestorPro.com
* Volume is not What is Used to Be.
* 2008: Bear Bounce and Bullish Setup.
* 2010: Big Bounce and Big Pullback.
* 2011: Retracement and Bull Flag.
* 2014: October Volatility.
* 2015: Volatility and BREXIT Vote.
* 2019: What Now?
* On Trend on StockChartsTV.
... Volume is not What is Used to Be
... I went...
READ MORE
MEMBERS ONLY
Separating the Contenders from the Pretenders
by Arthur Hill,
Chief Technical Strategist, TrendInvestorPro.com
The S&P 500 is in the midst of a big run that lifted most boats, especially financial stocks. Even though these stocks are leading with the biggest gains over the last three weeks, most big financials are still in downtrends overall and below their 200-day SMAs.
Take Citigroup...
READ MORE
MEMBERS ONLY
Weekly Market Review & Outlook (with video) - A One Legged Chair
by Arthur Hill,
Chief Technical Strategist, TrendInvestorPro.com
* Finance Does the Heavy Lifting.
* One out of Four is Not Enough.
* New Highs Remain Subdued.
* Majority of Stocks in Long-term Downtrends.
* The Lone Breadth Thrust.
* Bear Market Environments.
* Strength Outside of U.S. Stocks.
* Separating the Contenders from the Pretenders.
* Growth Stocks with Strong Charts.
... Finance Does the Heavy...
READ MORE
MEMBERS ONLY
A Five Step Bearish Setup for ABC
by Arthur Hill,
Chief Technical Strategist, TrendInvestorPro.com
AmerisourceBergen (ABC) started the day strong and rose with the broader market, but turned south in the afternoon and formed a bearish engulfing. This bearish candlestick reversal looks especially ominous because it formed near the minimum retracement and with the Commodity Channel Index (CCI) overbought.
The chart shows ABC breaking...
READ MORE
MEMBERS ONLY
Big Sectors Drive Short-term Breakout in SPY
by Arthur Hill,
Chief Technical Strategist, TrendInvestorPro.com
* Stocks Bid to Extend Higher.
* SPY Enters the Prior Consolidation.
* Big Sectors Join the Breakout Parade.
... The S&P 500 SPDR (SPY) and several sector SPDRs broke out of short-term consolidations in a bid to extend the upswing that began on December 26th. While I remain in the bearish...
READ MORE
MEMBERS ONLY
Palo Alto Networks Breaks from the Pack
by Arthur Hill,
Chief Technical Strategist, TrendInvestorPro.com
Most stocks have struggled since November, but Palo Alto Networks managed to reverse at a key area and break above a resistance zone.
The chart below shows PANW with weekly bars over the last 3 years. The stock broke to new highs in February 2018 and more than doubled from...
READ MORE
MEMBERS ONLY
Coca-Cola Loses Some Fizz
by Arthur Hill,
Chief Technical Strategist, TrendInvestorPro.com
Stocks surged over the last 12 days with the S&P 500 gaining over 10% and moving above its late December high. Coca-Cola (KO) was leading the market with a new high in November, but did not partake in the broad market rally here in January. SPY is up...
READ MORE
MEMBERS ONLY
The 800-pound Gorilla Hits Resistance
by Arthur Hill,
Chief Technical Strategist, TrendInvestorPro.com
I highlighted the confluence of data points that argue for resistance in the S&P 500 last week and would like to review this as we start a new week. Note that I only focus on resistance when the bigger trend is down. Why? Because resistance levels have a...
READ MORE
MEMBERS ONLY
Weekly Market Review & Outlook (with Video) - Looking Outside the U.S. Stock Market
by Arthur Hill,
Chief Technical Strategist, TrendInvestorPro.com
* Big Markets in Big Downtrends.
* Bullish Breadth Surge.
* Counting New Highs on One Hand.
* Vast Majority of Stocks in Downtrends.
* A Return to the Breakdown.
* A Potential Reversal Area.
* Finding Pockets of Strength.
* India Starts to Drag.
* Indonesia Extends on Breakout.
* New Zealand Holds above October Lows.
* Singapore Dollar Surges....
READ MORE
MEMBERS ONLY
Perspective - 40 years of the Zweig Breadth Thrust - Weight of the Evidence
by Arthur Hill,
Chief Technical Strategist, TrendInvestorPro.com
* Putting the Bounce into Perspective.
* 23-day Performance Overshadows 9-day Surge.
* 40 Years of the Zweig Breadth Thrust.
* AD Percent for $SPX, $MID and $SML.
* A Weight of the Evidence Approach.
... Putting the Bounce into Perspective
... As of Tuesday's close, the S&P 500 is up a whopping...
READ MORE
MEMBERS ONLY
Netflix Leads the FAANGs as Facebook Quietly Outperforms
by Arthur Hill,
Chief Technical Strategist, TrendInvestorPro.com
Netflix was the first of the five FAANG stocks to peak in June 2018 and is now the first of the five to break its December high. Thus, Netflix is leading the FAANGs here in January because it is the only one with a higher high. Note that Netflix reports...
READ MORE
MEMBERS ONLY
VerSign Holds One Key Moving Average and Retakes Another
by Arthur Hill,
Chief Technical Strategist, TrendInvestorPro.com
The broad market environment remains rather negative overall with the S&P 500 well below its falling 200-day SMA and volatility increasing over the last few months. Note that the different environments were highlighted in ChartWatchers this weekend. After a sharp decline into Christmas, stocks rebounded over the last...
READ MORE