MEMBERS ONLY
QQQQ Leads with Break above June High
by Arthur Hill,
Chief Technical Strategist, TrendInvestorPro.com
- Market Overview
- QQQQ breaks June high
- SPY hits resistance
- Stocks short-term overbought
- VIX hits new low,
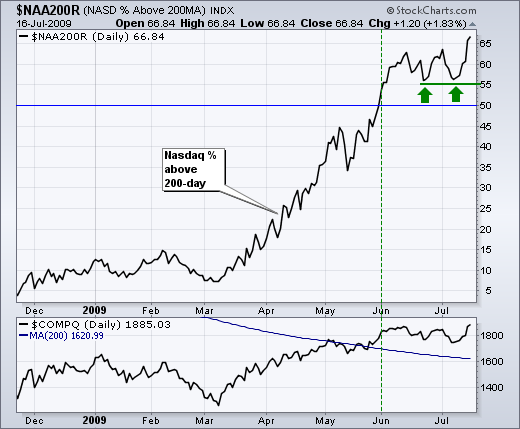
- Percent above 200-day hits new high
- Net New Highs expand
- Small-caps lag large-caps.
-Link to today's video.
Chart Worth Watching will be posted around 9AM. The next update...
READ MORE
MEMBERS ONLY
NYSE AD Line Breaks June High
by Arthur Hill,
Chief Technical Strategist, TrendInvestorPro.com
The AD Line for the NYSE remains strong after a break above the June high. In fact, the AD Line is leading the NY Composite because the latter has yet to break its June high. Leadership from the AD Line is positive for the market overall. You see breadth stats...
READ MORE
MEMBERS ONLY
Majority of Stocks Still Above their 200-day SMAs
by Arthur Hill,
Chief Technical Strategist, TrendInvestorPro.com
It is hard to argue with the bulls when the vast majority of Nasdaq and NYSE stocks are trading above their 200-day SMAs. Over 66% of Nasdaq stocks are trading above their 200-day moving averages, while over 77% of NYSE stocks are trading above their 200-day moving...
READ MORE
MEMBERS ONLY
Dow Reclaims Two Key Moving Averages
by Arthur Hill,
Chief Technical Strategist, TrendInvestorPro.com
With a surge back above 8500 this week, the Dow Industrials reclaimed the upper ground on the 50-day and 200-day moving averages. Also notice that the 50-day SMA moved above the 200-day SMA. This is also knows as a golden cross. Even though these are positive...
READ MORE
MEMBERS ONLY
Charts Worth Watching
by Arthur Hill,
Chief Technical Strategist, TrendInvestorPro.com
- Charts Worth Watching: CAKE, INTU, JCP, LEAP, MCD, PII, PSS, QSII
- Link to today's video.
- The next update will be Tuesday (July 21) by 7AM ET.
*****************************************************************
Cake edges towards resistance. With the market surge over the last four days, I would have expected bigger things from the Cheesecake...
READ MORE
MEMBERS ONLY
Market Overview
by Arthur Hill,
Chief Technical Strategist, TrendInvestorPro.com
- Market Overview: DIA, IWM, QQQQ, SPY, $VIX, $NAA200R, AAII Sentiment, AD Line and Ad Volume line
- Click here for today's video.
- The next update will be Tuesday (July 21) by 7AM ET.
*****************************************************************
Still Within Trading Ranges
Despite this week's surge, I am still not buying into...
READ MORE
MEMBERS ONLY
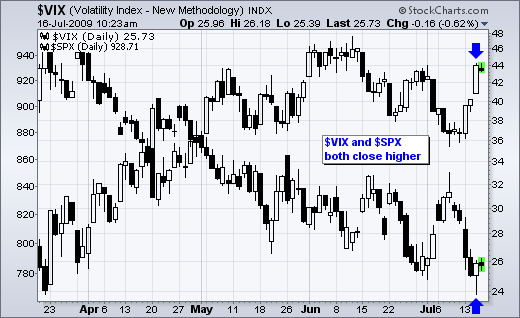
VIX and SPX Both Close Higher
by Arthur Hill,
Chief Technical Strategist, TrendInvestorPro.com
Despite a big surge in the S&P 500 on Wednesday, the S&P 500 Volatility Index ($VIX) recovered from early losses and closed higher on the day. This is unusual because the VIX normally declines during a sharp stock market advance. It is just one day though....
READ MORE
MEMBERS ONLY
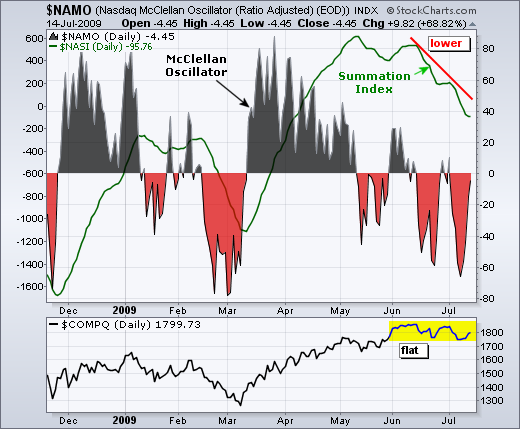
Nasdaq Summation Index Moves Lower
by Arthur Hill,
Chief Technical Strategist, TrendInvestorPro.com
Even though the Nasdaq is trading above its mid May levels, the Nasdaq Summation Index (green line) is trending lower. This breadth indicator suggests that a "stealth" correction is underway within the Nasdaq. In other words, stocks within the index are showing some weakness, but the index itself...
READ MORE
MEMBERS ONLY
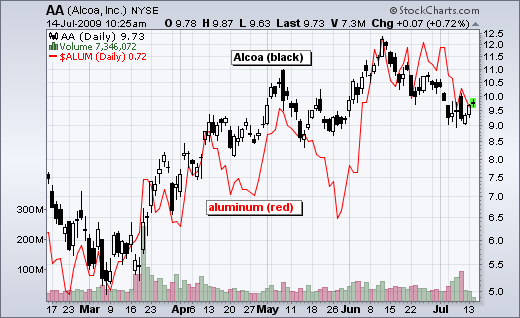
Alcoa and Aluminum
by Arthur Hill,
Chief Technical Strategist, TrendInvestorPro.com
The chart below shows Alcoa (AA) with black candlesticks and the continuous futures contract for Aluminum ($ALUM). Although not perfect, there is clearly a positive correlation between the two. Overall, both have been working their way higher since March. More recently, both peaked in early June and moved lower the...
READ MORE
MEMBERS ONLY
Charts Worth Watching
by Arthur Hill,
Chief Technical Strategist, TrendInvestorPro.com
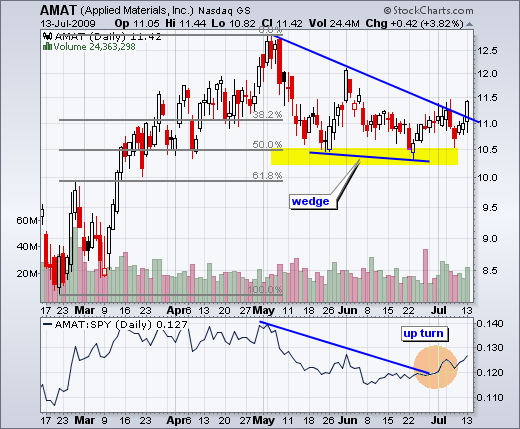
- Charts Worth Watching: AMAT, BMY, BRK.A, CB, HOG, NBR, NSM, PII, PTEN
- Link to today's video.
- The next update will be Friday (July 17) by 7AM ET.
*****************************************************************
Applied Materials (AMAT) broke trendline resistance with good volume.
*****************************************************************
Bristol Meyers (BMY) firms near key retracement. Volume also surged as...
READ MORE
MEMBERS ONLY
Charts Worth Watching
by Arthur Hill,
Chief Technical Strategist, TrendInvestorPro.com
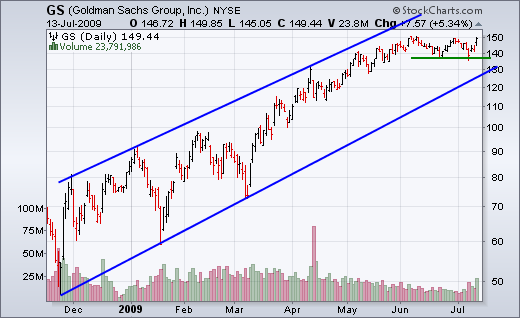
- Market Overview: SPY, GS, XLF, KRE, VIX, VXN, $NYA200R, $NAA200R
- Link to today's video.
A stock setups commentary and video will be posted around 9AM. The next update will be Friday (July 17) by 9AM ET.
*****************************************************************
As most of us know, an upgrade of Goldman Sach (GS) spurred...
READ MORE
MEMBERS ONLY
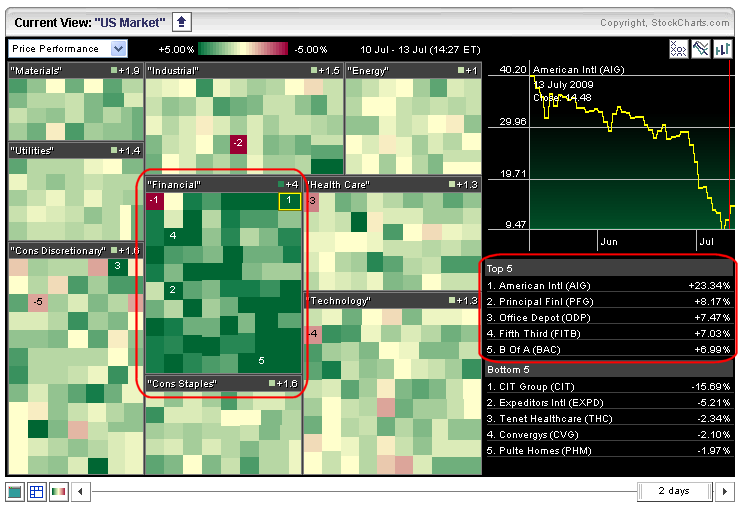
Finance Leads the Market
by Arthur Hill,
Chief Technical Strategist, TrendInvestorPro.com
A look at the market carpet for Monday reveals strength in the finance sector. All sectors are up today, but the finance sector shows the most, and the darkest, green on the carpet. From the table on the right, you can also see that four of the five biggest gainers...
READ MORE
MEMBERS ONLY
Nikkei Makes it 7 Straight
by Arthur Hill,
Chief Technical Strategist, TrendInvestorPro.com
With another down day on Thursday, the Nikkei 225 ($NIKK) has now declined seven days in a row. Even though it is getting short-term oversold, it looks like a medium-term downtrend is taking shape. The index could eventually retraced 50% of the March-June advance....
READ MORE
MEMBERS ONLY
Charts Worth Watching
by Arthur Hill,
Chief Technical Strategist, TrendInvestorPro.com
Charts Worth Watching: AAPL, AMAT, AMZN, ARO, BMS, BMY, CAKE, CHRW, FDX, GR, IWM, JBL, JCP, LLY, NKE, OMC, PFE, PRSP, QQQQ, SPY, WPO
- Link to today's video.
- Next update will be Tuesday (July 14) by 9AM ET.
*****************************************************************
After a gap down and sharp decline last Friday, stocks...
READ MORE
MEMBERS ONLY
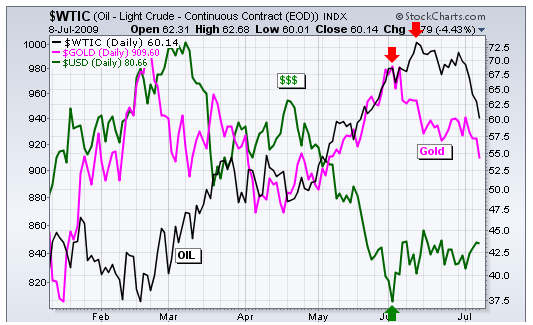
Dollar Firms as Oil and Gold Slip
by Arthur Hill,
Chief Technical Strategist, TrendInvestorPro.com
June witnessed a change in inter-market dynamics. The US Dollar Index ($USD) bounced at the beginning of June while the Gold-Continuous Futures ($GOLD) and West Texas Intermediate ($WTIC) declined in June. Gold started down first with a move lower in early June. Oil followed by moving lower the...
READ MORE
MEMBERS ONLY
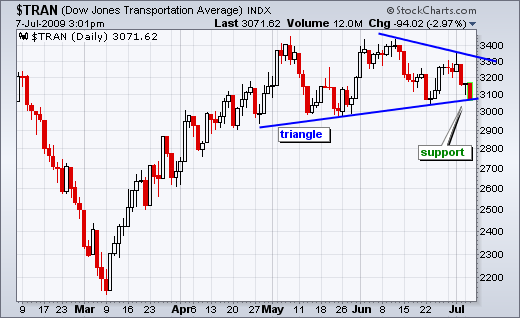
Transports Test Triangle Support
by Arthur Hill,
Chief Technical Strategist, TrendInvestorPro.com
After forming a lower high last week, the Dow Transports declined to triangle support with a sharp move lower the last three days. As of 3PM ET on Tuesday, the Average was down over 8% from last week's high. A triangle break would be bearish and call for...
READ MORE
MEMBERS ONLY
Charts Worth Watching
by Arthur Hill,
Chief Technical Strategist, TrendInvestorPro.com
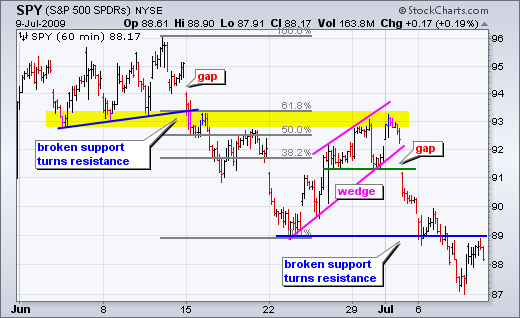
- Charts Worth Watching: AMAT, APH, ARO, BWA, DIA, HCN, IWM, JWN, KSS, MCD, OLN, PSA, QQQQ, SPY
- Link to today's video.
- Next update will be Friday (July 10) by 9AM ET.
*****************************************************************
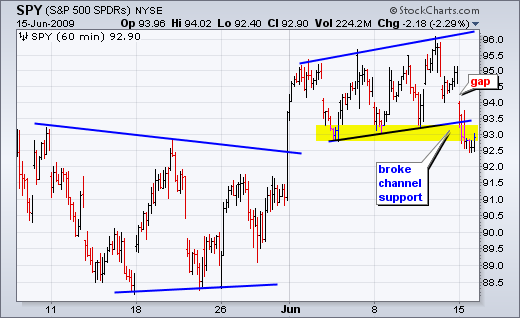
Short-term Gaps and Support Breaks
Last Tuesday I led off with the 60-minute charts showing...
READ MORE
MEMBERS ONLY
RTH Breaks May Low
by Arthur Hill,
Chief Technical Strategist, TrendInvestorPro.com
The Retail HOLDRS (RTH) broke below the May low with a sharp decline last week. Overall, it appears that a double top formed in May-June. The support break confirms the pattern and this ETF could retrace around 50% of its prior advance.
Sharpcharts users can click this chart to...
READ MORE
MEMBERS ONLY
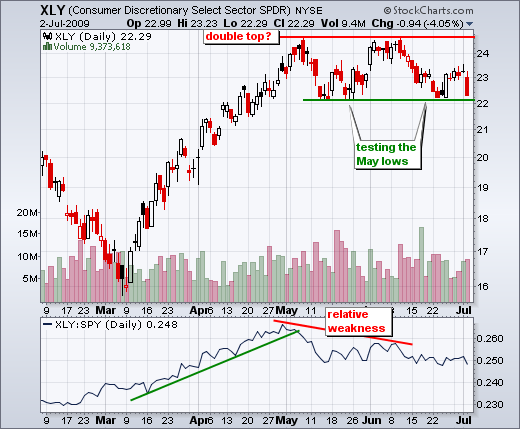
Consumer Discretionary Stocks Get Rocked
by Arthur Hill,
Chief Technical Strategist, TrendInvestorPro.com
Non-farm payrolls declined 467,000 for June, which was worse than expected. Stocks took the news hard with a broad based decline on Thursday. The major indices were down 2-4% on the day, while all sector ETFs were down over 2% with the Consumer Discretionary SPDR (XLY) leading...
READ MORE
MEMBERS ONLY
TSE Hits Resistance
by Arthur Hill,
Chief Technical Strategist, TrendInvestorPro.com
With a 3000 point surge the last few months, the S&P TSX Composite ($TSE) broke through resistance and CCI moved above +100. Both events are bullish, but the index looks vulnerable to a pullback. First, CCI moved back below +100. Second, the index is up 3000 points without...
READ MORE
MEMBERS ONLY
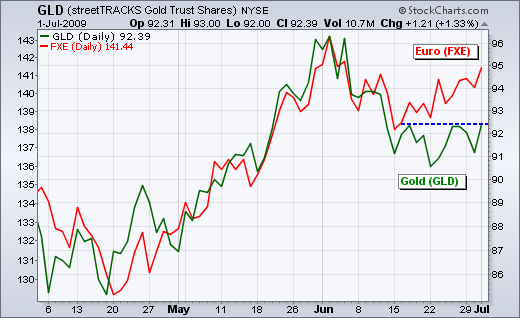
Gold Lags the Euro
by Arthur Hill,
Chief Technical Strategist, TrendInvestorPro.com
Gold normally moves with the Euro, but the yellow metal has not been keeping up the last few weeks. Notice how the Euro ETF (FXE) bottomed on 15-June and moved higher the last 2-3 weeks. However, the Gold ETF (GLD) did not bottom until 22-June and has...
READ MORE
MEMBERS ONLY
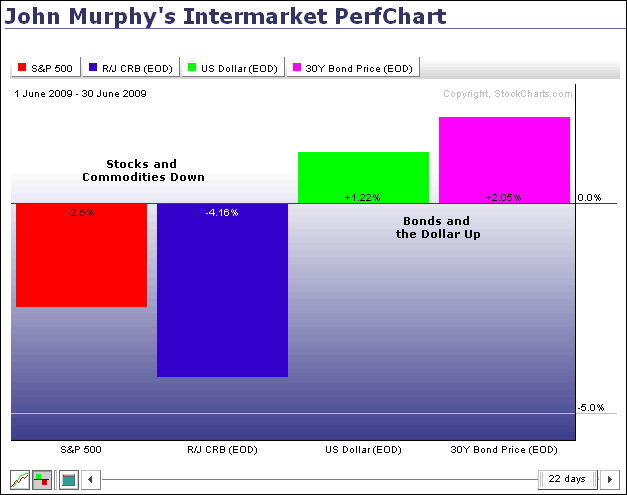
Stocks and Commodities Down in June
by Arthur Hill,
Chief Technical Strategist, TrendInvestorPro.com
From John Murphy's intermarket perfchart, we can see that stocks (S&P 500) and commodities ($CRB) were down for the month of June. In contrast, Bonds ($USB) and the Dollar ($USD) were up. Strength in the greenback weighed on commodities. In addition, it appears that strength in...
READ MORE
MEMBERS ONLY
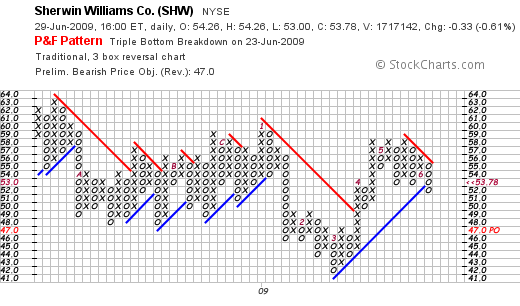
A Triple Bottom Breakdown for Sherwin Williams
by Arthur Hill,
Chief Technical Strategist, TrendInvestorPro.com
From the PnF scans comes Sherwin Williams (SHW) with a clear break below the May lows. On the PnF chart, you can see the number 5 to denote the start of May and then two reaction lows. After the number 6 (June), SHW formed another column of O's...
READ MORE
MEMBERS ONLY
Charts Worth Watching
by Arthur Hill,
Chief Technical Strategist, TrendInvestorPro.com
- Charts featured: DHI, DIA, IBB, IWM, JAH, JPM, LUV, MMC, PENN, PNRA, QQQQ, SPY, USB, WFC, XHB, XLF, XLY
- Link to today's video.
- Next update will be Tuesday (July 7) by 9AM ET.
*****************************************************************
As noted last week, the current trading environment remains tricky for a number of technical...
READ MORE
MEMBERS ONLY
FedEx Hits Channel Resistance
by Arthur Hill,
Chief Technical Strategist, TrendInvestorPro.com
After surging on good volume, FedEx (FDX) hit channel resistance around 57. Notice that FDX peaked in early May and then worked its way lower the last eight weeks. This series of lower lows and lower highs defines the channel, which is also an 8-week downtrend. Look for a...
READ MORE
MEMBERS ONLY
Dow Bullish Percent Gets Frothy
by Arthur Hill,
Chief Technical Strategist, TrendInvestorPro.com
The DJIA Bullish Percent Index ($BPINDU) moved above 70% in June and remains at lofty levels. Mid December and early January were the last two occasions above 70%. Currently, 73% of the Dow stocks (30) are on Point & Figure buy signals. Even though this is technically bullish, an advance...
READ MORE
MEMBERS ONLY
Charts Worth Watching
by Arthur Hill,
Chief Technical Strategist, TrendInvestorPro.com
Charts featured: SPY, DIA, GRMN, HOG, PFCB, FITB, HCBK, JPM, LAZ, MMC, USB, WFC, AMAT, NVDA, TIBX.
- Click here for today's video.
- Next update will be Tuesday (June 30) by 9AM ET.
*****************************************************************
Trading remains tricky as we approach the end of the second quarter. There is evidence that...
READ MORE
MEMBERS ONLY
HP Holds the Breakout
by Arthur Hill,
Chief Technical Strategist, TrendInvestorPro.com
While the S&P 500 took a hit in June, Hewlett-Packard (HPQ) managed to hold its breakout and stay relatively strong. HP broke triangle resistance in early June. Broken resistance then turned into support the last three weeks. Also notice that the price relative moved higher throughout June....
READ MORE
MEMBERS ONLY
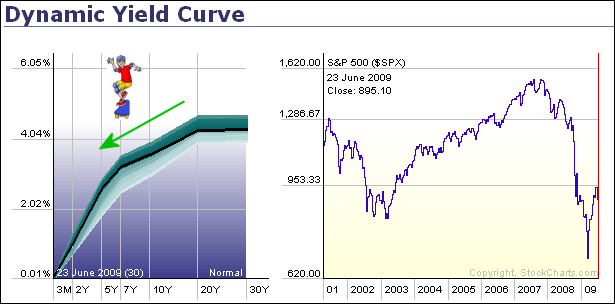
Yield Curve Remains Steep
by Arthur Hill,
Chief Technical Strategist, TrendInvestorPro.com
A static shot of the dynamic yield curve reveals a curve steep enough to temp a skateboarder. As this curve shows, interest rates start low at the short end and rise as the maturities lengthen. Typically, a steep yield curve reflects loose monetary policy designed to stimulate the economy and...
READ MORE
MEMBERS ONLY
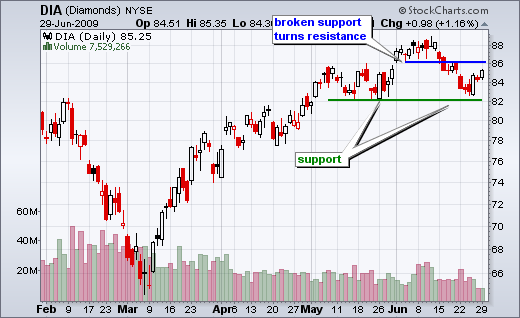
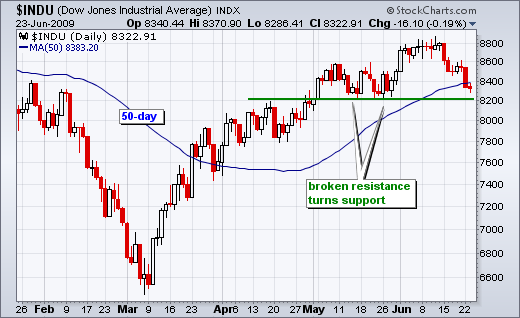
Dow Tests Support
by Arthur Hill,
Chief Technical Strategist, TrendInvestorPro.com
The Dow Industrials is testing support around 8200. A key tenet of technical analysis is that broken resistance turns into support. After breaking 8200 in early May and this level turned into support twice in May. With a sharp decline in June, the Dow is once again poised for a...
READ MORE
MEMBERS ONLY
Charts Worth Watching
by Arthur Hill,
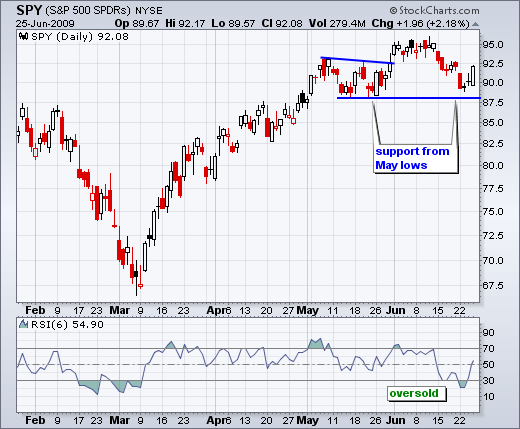
Chief Technical Strategist, TrendInvestorPro.com
- Index ETF Charts: SPY, $RUT, $OEX, $NAHL
-Stock Charts: WHR, XHB, DHI, CAKE, KR, SLE, WMT, FLO, INTC, KLAC, INTC
-Today's video will be posted by 10:15 AM ET
- The next update will be Friday (June 26) by 9AM ET.
*****************************************************************
The major index ETFs broke down on...
READ MORE
MEMBERS ONLY
UPS Leads the Market
by Arthur Hill,
Chief Technical Strategist, TrendInvestorPro.com
UPS is a key part of the Dow Transports and perhaps a leading indicator for the stock market. Notice how the price relative (UPS:$SPX ratio) bottomed ahead of the stock market in March. UPS started showing relative strength before the actual market bottom. Most recently, the price relative peaked...
READ MORE
MEMBERS ONLY
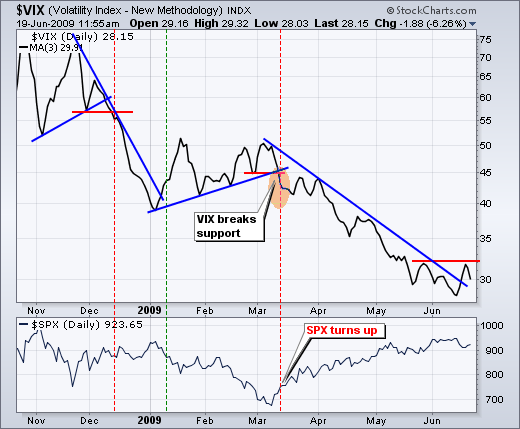
VIX BREAKS A TRENDLINE
by Arthur Hill,
Chief Technical Strategist, TrendInvestorPro.com
A downtrend in the S&P 500 Volatility Index ($VIX) underpins the current rally in the S&P 500. After all, decreasing fear gives way to confidence. The chart below shows the VIX as a 3-day SMA to smooth out daily fluctuations. The VIX broke support on...
READ MORE
MEMBERS ONLY
Volume Picks Up for SW Airlines
by Arthur Hill,
Chief Technical Strategist, TrendInvestorPro.com
After surging in March-April, SW Airlines (LUV) went into corrective mode with a falling wedge in May-June. This wedge is still falling, but volume on up days is starting to increase. The bounce in early June occurred on above average volume and Wednesday's volume was the...
READ MORE
MEMBERS ONLY
Charts Worth Watching
by Arthur Hill,
Chief Technical Strategist, TrendInvestorPro.com
- Charts Worth Watching: $USD, AAPL, BBBY, CHKP, CSCO, DHI, ENR, FXE, GLD, INTC, IWM, K, KFT, NVDA, PEP, QQQQ, SLE, SPY, SWK, WAG, WHR
- Click here for today's video.
The next update will be Tuesday (June 22) by 9AM ET.
*****************************************************************
It is touch-and-go in the stock...
READ MORE
MEMBERS ONLY
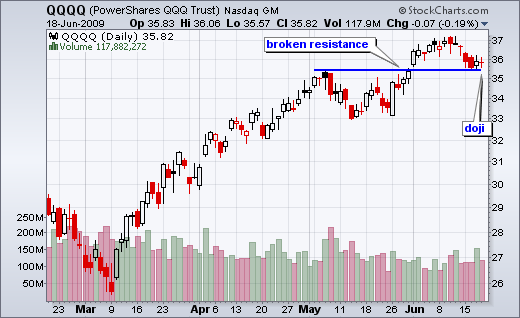
QQQQ Turns Indecisive
by Arthur Hill,
Chief Technical Strategist, TrendInvestorPro.com
The Nasdaq 100 ETF (QQQQ) formed a doji on Thursday to signal indecision at support. Doji look like plus signs because there is little change from open to close. In addition, notice that QQQQ closed in the middle of its high-low range. The candlestick looks like a small plus...
READ MORE
MEMBERS ONLY
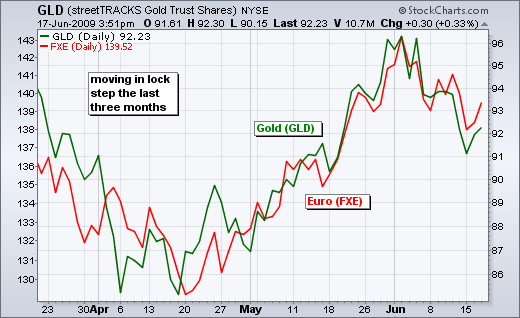
Euro and Gold Dancing Together
by Arthur Hill,
Chief Technical Strategist, TrendInvestorPro.com
The Euro ETF (FXE) and the Gold ETF (GLD) have been moving step-for-step over the last three months. In broad terms, both declined into mid April, advanced into early June and declined over the last two weeks....
READ MORE
MEMBERS ONLY
Triple Bottom Breakdown For CCL
by Arthur Hill,
Chief Technical Strategist, TrendInvestorPro.com
Carnival Corp (CCL) came up on the Triple Bottom Breakdown scan. After failing to hold its May breakout (blue arrow), the stock broke support with a sharp decline in June. You can probably see some other patterns at work here as well. Think Fibonacci, wedge and broken support....
READ MORE
MEMBERS ONLY
Charts Worth Watching
by Arthur Hill,
Chief Technical Strategist, TrendInvestorPro.com
- Charts Worth Watching: $USD, BBY, CI, EL, GDX, GLD, IPCR, KMB, LLL, MHP, RTN, SPY, XLF , XLK, XLV, XLY
- Click here for today's video.
-The next update will be Friday (June 19) by 9AM ET.
*****************************************************************
With a sharp decline over the last two days, the major index ETFs...
READ MORE
MEMBERS ONLY
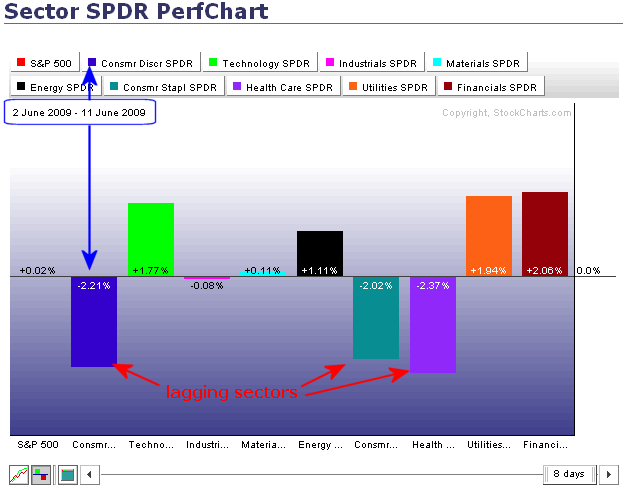
Consumer Discretionary Lagging in June
by Arthur Hill,
Chief Technical Strategist, TrendInvestorPro.com
The S&P Sector PerfChart from 2-June until 11-June shows the consumer staples, healthcare and consumer discretionary sectors lagging the broader market. Each is down over 2%, while the S&P 500 is up .02% (a fraction) over this timeframe. It is a strange trio, but...
READ MORE