MEMBERS ONLY
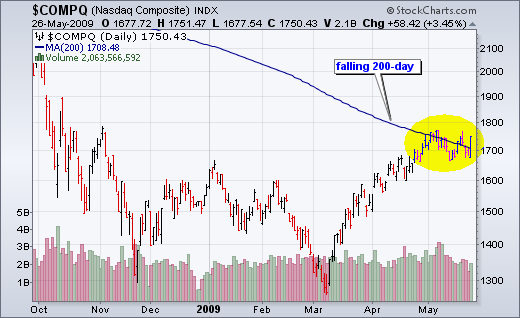
Naz Battles the 200-day
by Arthur Hill,
Chief Technical Strategist, TrendInvestorPro.com
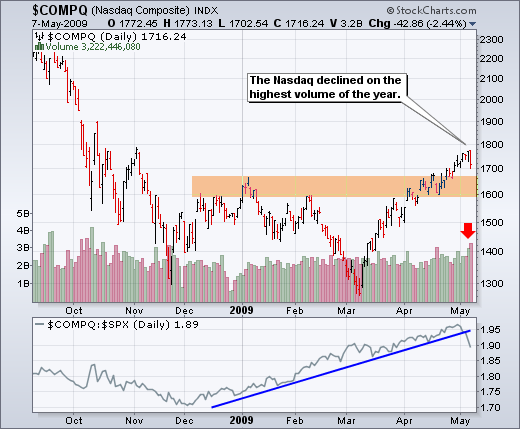
The Nasdaq extended its battle with the 200-day moving average by jumping back above with a big advance on Tuesday. With this latest move, the index has now crossed the 200-day at least five times this month. Notice that today's surge occurred on the second lowest volume of...
READ MORE
MEMBERS ONLY
Charts Worth Watching
by Arthur Hill,
Chief Technical Strategist, TrendInvestorPro.com
Charts Worth Watching: SPY, DIA, IWM, XLB, XRT AND IYT.
Another update will be posted by 12PM ETon Tuesday (26-May). This will include the stock setups and the video.
*****************************************************************
The major index ETFs are showing signs of weakness as a potential correction unfolds. These ETFs include the Dow Diamonds (DIA)...
READ MORE
MEMBERS ONLY
Stock Setups and Video
by Arthur Hill,
Chief Technical Strategist, TrendInvestorPro.com
Charts: BA, DELL, HD, HON, INTC, K , KFT, LMT, LOW
The next update will be Friday (May 29) by 9AM ET.
Link to corresponding video.
*****************************************************************
Weakness in Home Depot (HD) is negative overall. HD was hit hard with two sharp declines in May. The one-day wonder surge above 26 divides...
READ MORE
MEMBERS ONLY
Charts Worth Watching
by Arthur Hill,
Chief Technical Strategist, TrendInvestorPro.com
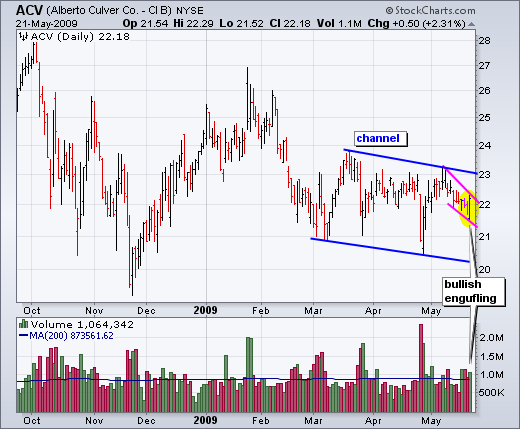
- Charts Worth Watching:acv, amgn, amln , asei, bro,
cah, cb, eric, hon, idcc, nke, swy, trv, vrtx
- Link to corresponding video.
The next update will be Tuesday (May 26) by 11AM ET.
****************************************************************
I will start off today with two potentially bullish setups from the consumer staples sector. This...
READ MORE
MEMBERS ONLY
QQQQ Retraces 38.2%
by Arthur Hill,
Chief Technical Strategist, TrendInvestorPro.com
With the March-May advance, QQQQ has now retraced 38.2% of the May-November decline. Where does this number come from? It based on the Golden Ratio Congugate (.618). 1 - .618 = .382 or 38.2%. After a decline, like May to November, the Fibonacci Retracements Tool can be used to...
READ MORE
MEMBERS ONLY
AD Volume Line Breaks Trendline
by Arthur Hill,
Chief Technical Strategist, TrendInvestorPro.com
The AD Volume Line for the Nasdaq broke its March trendline and formed a lower high in May. This indicator is a cumulative measure for the volume of advancing stocks less the volume of declining stocks. Notice that recent peaks and troughs in the Nasdaq coicided with peaks and troughs...
READ MORE
MEMBERS ONLY
A Head-and-Shoulders for Wal-Mart?
by Arthur Hill,
Chief Technical Strategist, TrendInvestorPro.com
Wal-Mart is tracing out a continuation head-and-shoulders pattern with neckline support around 47.5-48. It is a bit unusual because the neckline is sloping up, which reflects higher lows since early February. A break below support would confirm the pattern and signal a continuation lower. Conversely, a break above the...
READ MORE
MEMBERS ONLY
A High-Volume Harami for SUN
by Arthur Hill,
Chief Technical Strategist, TrendInvestorPro.com
After a decline below 30, Sunoco (SUN) suddenl firmed with a high volume harami on Monday (18-May). These are potentially bullish candlestick reversal patterns that require confirmation with further upside. Look for volume to confirm any breakout....
READ MORE
MEMBERS ONLY
Charts Worth Watching
by Arthur Hill,
Chief Technical Strategist, TrendInvestorPro.com
Charts Worth Watching: ANF, AZO, CAL, CB, INTC, ITB,
LUV, PGR, QQQQ, SMH, SWY, SYY, XLB, XLF
The next update will be Friday (May 22) around 9AM ET.
*****************************************************************
The moment of truth is close. Based on positive reports from State Street (STT) and Lowe's (LOW), stocks moved sharply...
READ MORE
MEMBERS ONLY
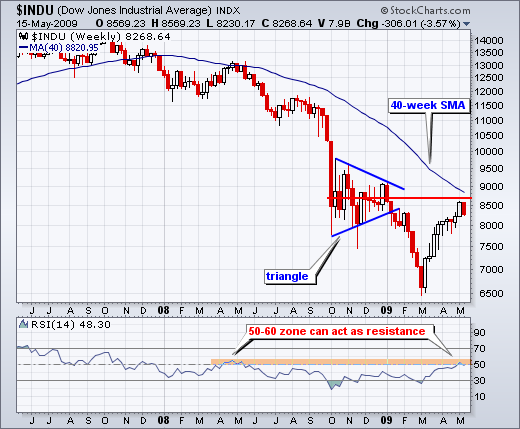
DOW HITS RESISTANCE
by Arthur Hill,
Chief Technical Strategist, TrendInvestorPro.com
After a massive 9 week advance, the Dow ran into resistance with its biggest weekly decline since early March. There is a resistance zone coming into play around 8700-8800 from the falling 40-week moving average and the Oct-Nov consolidation. After establishing support in Oct-Nov, this triangle consolidation now turns into...
READ MORE
MEMBERS ONLY
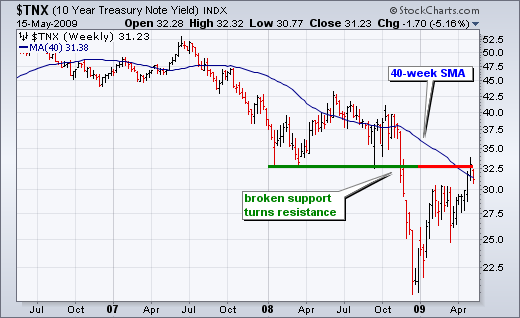
10-Year Treasury Yield Hits Resistance
by Arthur Hill,
Chief Technical Strategist, TrendInvestorPro.com
Broken support turns into resistance. This classic tenet of technical analysis is coming into play for the 10-Year Treasury Yield ($TNX). Notice that the 10-Year Treasury Yield broke support around 33-34 (3.3-3.4%) and this area turned into resistance in early May....
READ MORE
MEMBERS ONLY
A Massive Bearish Engulfing
by Arthur Hill,
Chief Technical Strategist, TrendInvestorPro.com
Tidewater (TDW) formed a massive bearish engulfing that engulfed the prior five candlesticks. Volume surged to its highest level since January. What's more, this is the second bearish engulfing pattern in two weeks. These patterns reflect a raging battle at resistance from the January-February highs....
READ MORE
MEMBERS ONLY
Charts Worth Watching
by Arthur Hill,
Chief Technical Strategist, TrendInvestorPro.com
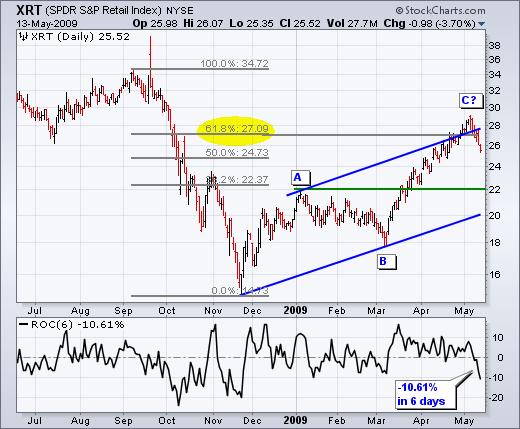
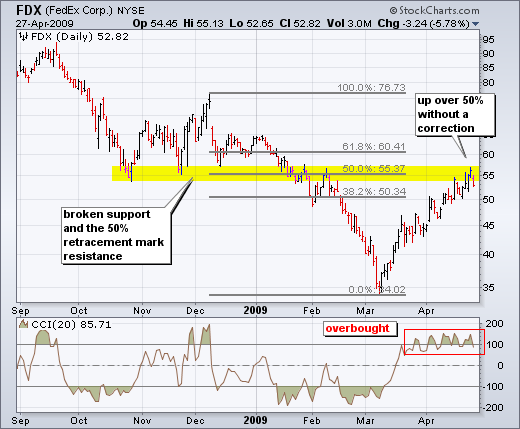
Today's Charts Include: AMZN, ANF, ARO, CEPH, CHRW, COV, CPRT, FDX, GILD, INTC, IYT, JBHT, JWN, RL, UPS, XRT.
The next update will be Tuesday (May 19th) around 9AM ET.
*****************************************************************
The consumer discretionary sector and the retail group were hit hard over the last three days. Actually, the...
READ MORE
MEMBERS ONLY
Best Buy Breaks Support
by Arthur Hill,
Chief Technical Strategist, TrendInvestorPro.com
Best Buy (BBY) broke support and the 50-day moving average with a sharp decline over the last six days. Notice how the Aroon Oscillator turned negative just before this support break. In fact, this Aroon signal would have shown up on the Aroon scan last Thursday....
READ MORE
MEMBERS ONLY
Dow Transports Falls Short of 200-day
by Arthur Hill,
Chief Technical Strategist, TrendInvestorPro.com
After a most impressive rally, the Dow Transports stopped just short of its 200-day simple moving average with a sharp decline the last four days. Also notice that this key average is trading below its prior reaction high (early January). Watch the rising 50-day moving average for potential support on...
READ MORE
MEMBERS ONLY
Charts Worth Watching
by Arthur Hill,
Chief Technical Strategist, TrendInvestorPro.com
Today's charts include: SPY, ANF, BIIB, CHH, CL, FLML, GLD, IBB, ITB, LEN, MDC, NIKE, QQQQ, SEPR, SVU, VRTX, WMT, XLP, XLY.
The next update will be Thursday (May 14th) morning around 9AM ET.
*****************************************************************
Let's start with the broad market. Even though the S&P...
READ MORE
MEMBERS ONLY
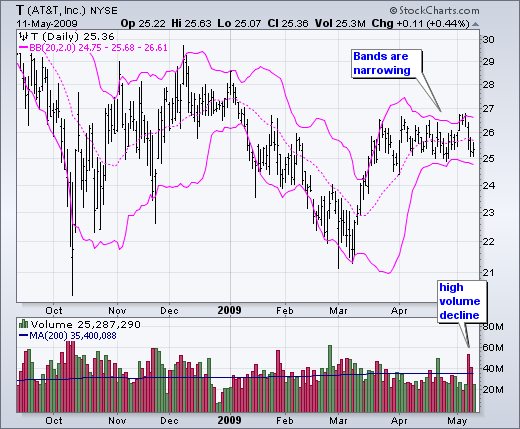
Bollinger Bands Narrow for AT&T
by Arthur Hill,
Chief Technical Strategist, TrendInvestorPro.com
With flat trading since late March, a volatility contraction for AT&T (T) is causing the Bollinger Bands to narrow. Bollinger Bands do not provide a directional bias, but last week's high volume decline shows selling pressure picking up steam....
READ MORE
MEMBERS ONLY
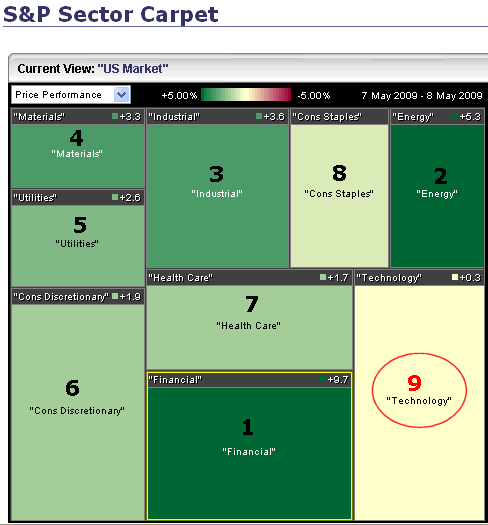
Technology Lags on Friday
by Arthur Hill,
Chief Technical Strategist, TrendInvestorPro.com
The S&P Sector Carpet shows a color-coded version of the leading and lagging sectors. Dark green sectors are leading with financial and energy showing the biggest gains on Friday. The technology was conspicuously absent from the leadership board on Friday. In fact, technology was the worst performing sector...
READ MORE
MEMBERS ONLY
Charts Worth Watching
by Arthur Hill,
Chief Technical Strategist, TrendInvestorPro.com
Charts Worth Watching: ANF, BIIB, CHH, CL, FLML, GLD, IBB, ITB, LEN, MDC, NIKE, QQQQ, SEPR, SPY, SVU, VRTX, WMT, XLP, XLY.
Scheduling Note: The next posting will be on Tuesday, May 12 around 9AM ET.
*****************************************************************
The Nasdaq declined with the highest volume of the year on Thursday. While a...
READ MORE
MEMBERS ONLY
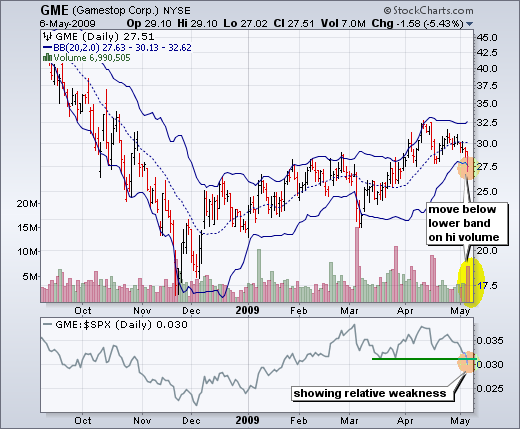
Gamestop Breaks Lower B-Band
by Arthur Hill,
Chief Technical Strategist, TrendInvestorPro.com
Looking through the scans page, I noticed that Game stop broke below its lower Bollinger Band with a high volume decline. Moreover, the stock is showing relative weakness as the price relative broke below its March lows. GME is moving down while the S&P 500 has been moving...
READ MORE
MEMBERS ONLY
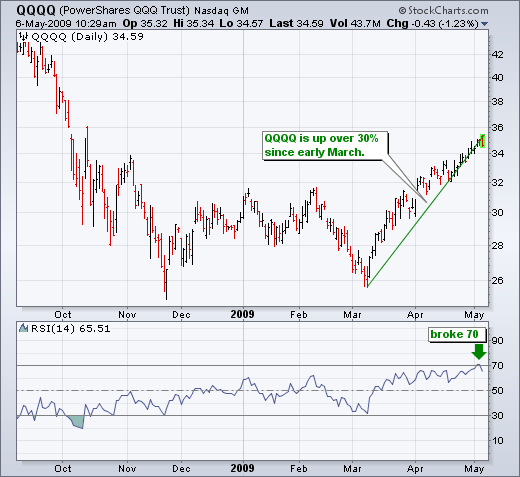
RSI Breaks 70 for QQQQ
by Arthur Hill,
Chief Technical Strategist, TrendInvestorPro.com
With 14-day RSI moving above 70 this week, the Nasdaq 100 ETF (QQQQ) became the first major-index ETF with an overbought reading. RSI is considered overbought when above 70 and oversold when below 30. For the Russell 2000 ETF (IWM), S&P 500 ETF (SPY) and Dow Industrials ETF...
READ MORE
MEMBERS ONLY
Commodity ETFs Follow SPY
by Arthur Hill,
Chief Technical Strategist, TrendInvestorPro.com
Demand for certain commodity ETFs is moving in the same direction as the stock market: UP. Economic growth translates into more demand for industrial metals (DBB), oil (USO), gasoline (UGA) and agricultural products (UGA). In a bit of a strange twist, natural gas (UNG) and livestock (COW) remain laggards....
READ MORE
MEMBERS ONLY
Lagging Sectors Break Resistance
by Arthur Hill,
Chief Technical Strategist, TrendInvestorPro.com
With Monday's market surge, some lagging ETFs joined the bulls with consolidation breakouts. The next four charts show sector ETFs that were lagging SPY because they remained below resistance from the March-April highs. These sector ETFs are still lagging, but they are now trying to play some catch-up...
READ MORE
MEMBERS ONLY
Charts Worth Watching
by Arthur Hill,
Chief Technical Strategist, TrendInvestorPro.com
Charts Worth Watching: BTU, CVX, ELON, EWW, KOL, LUB, MMC, RF and SLV.
Even though Mexico is ground-zero for swine flu, the Mexico ETF (EWW) shows no signs of the bug as it challenges resistance from the January high. There was a gap down last week, but the ETF recovered...
READ MORE
MEMBERS ONLY
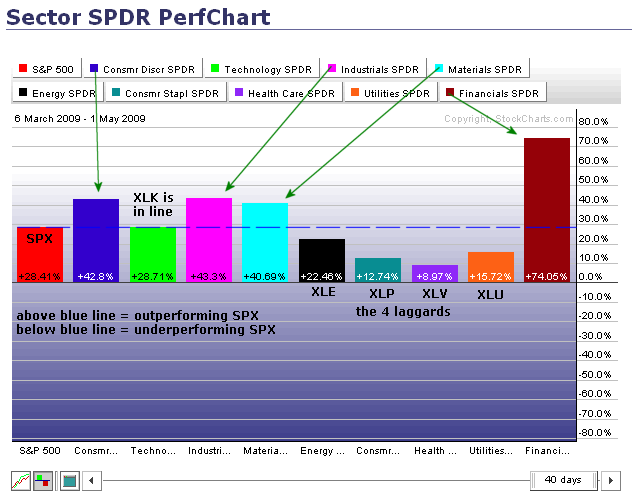
IT'S ALL RELATIVE
by Arthur Hill,
Chief Technical Strategist, TrendInvestorPro.com
The PerfChart below shows the percentage change for the S&P 500 and the nine sector SPDRs. The S&P 500 acts as the benchmark for relative performance. Sectors with greater percentage gains are outperforming the S&P 500. Sectors smaller percentage gains are underperforming. Defining the...
READ MORE
MEMBERS ONLY
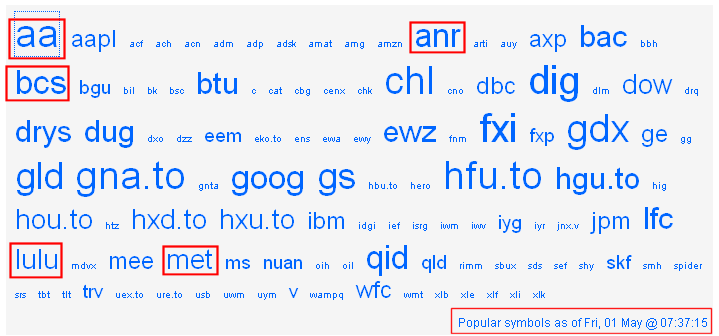
Don't Ignore this Cloud!
by Arthur Hill,
Chief Technical Strategist, TrendInvestorPro.com
Check out theticker cloudto see what's hot every morning. While there will always be the old standby symbols like GLD, DIG, DUG, GOOG, QID and FXI popping up, you are also likely to see some the stars d' jour. For Friday morning, I noticed interest inAlcoa(AA)...
READ MORE
MEMBERS ONLY
Sector Leaders and Laggards
by Arthur Hill,
Chief Technical Strategist, TrendInvestorPro.com
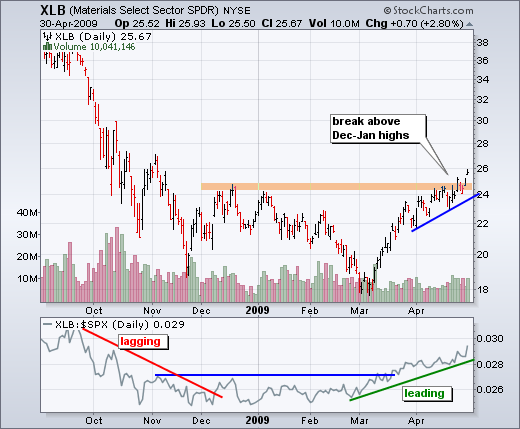
- Sector ETF Leaders and Laggards (XLY, XLB, XLK, XLP, XLV, XLE)
The Materials SPDR (XLB) was the latest to join the sector breakout club. With a surge from 18 to 26 (~30%), the ETF broke above its Dec-Jan highs over the past five days. The bottom indicator shows the...
READ MORE
MEMBERS ONLY
Charts Worth Watching
by Arthur Hill,
Chief Technical Strategist, TrendInvestorPro.com
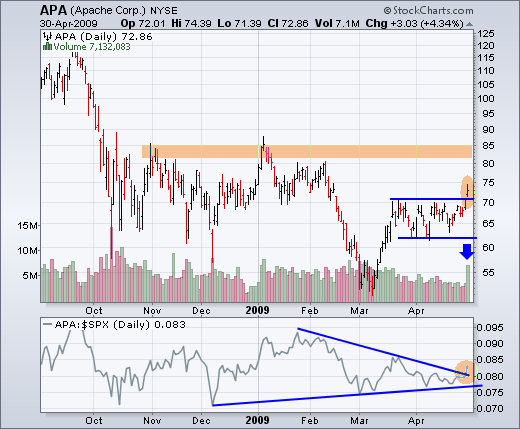
- Charts Worth Watching (APA, CLF, JOYG, NSM, NVDA, T, NKE, CL).
Despite relative weakness in the energy sector, Apache (APA) broke consolidation resistance with a volume surge on Thursday. Also notice that the price relative turned up over the last few days and broke above the late January trendline....
READ MORE
MEMBERS ONLY
Triple Top Breakout for QQQQ
by Arthur Hill,
Chief Technical Strategist, TrendInvestorPro.com
A run through the PnF scans reveals a triple top breakout for QQQQ on Wednesday. This means prices pushed the current "x" above the prior two highs (green arrow). Despite this breakout, QQQQ is trading right at potential resistance from the bearish resistance line....
READ MORE
MEMBERS ONLY
Stocks on the Move
by Arthur Hill,
Chief Technical Strategist, TrendInvestorPro.com
Charts: KFT, LLY, URBN XRAY
Stocks are up sharply in early trading ahead of today's FOMC policy statement. Even though the major stock indices are still looking overbought, the current uptrend remains in place as stocks continue to attract money. It takes some real guts to buy overbought...
READ MORE
MEMBERS ONLY
A Lot of Resistance Around
by Arthur Hill,
Chief Technical Strategist, TrendInvestorPro.com
-- Financial stocks showing relative weakness
-- Stocks trading near resistance and overbought
-- Bullish considerations
After a big advance the last 9-10 weeks, many stocks are running into resistance. In addition, many are are overbought and ripe for at least a correction or consolidation. The same can be said...
READ MORE
MEMBERS ONLY
Financial Stocks Showing Relative Weakness
by Arthur Hill,
Chief Technical Strategist, TrendInvestorPro.com
-- Financial stocks showing relative weakness
-- Stocks trading near resistance and overbought
-- Bullish considerations
With a bounce last week, the Nasdaq 100 ETF (QQQQ) moved above its mid April high and the S&P 500 ETF (SPY) challenged its mid April high. However, some key financial stocks...
READ MORE
MEMBERS ONLY
Defensive Sectors Turn Green
by Arthur Hill,
Chief Technical Strategist, TrendInvestorPro.com
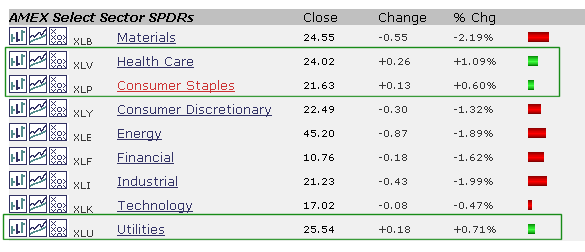
The healthcare, utilities and consumer staples sectors are traditionally the defensive sectors that underperform during a broad market advance. This was the case in March and most of April. With Monday's weakness, the defensive sectors held up and all three finished with small gains. It is just one...
READ MORE
MEMBERS ONLY
Welcome to Art's Charts
by Arthur Hill,
Chief Technical Strategist, TrendInvestorPro.com
Welcome to the first posting day at Art's Charts. This blog will feature bullish and bearish setups for stocks and ETFs. Every week I scan through the chart universe looking for breakouts, strong trends, reversals and key chart patterns. Each setup will feature an annotated chart with detailed...
READ MORE
MEMBERS ONLY
ANF Forms Inside Day within Rising Wedge
by Arthur Hill,
Chief Technical Strategist, TrendInvestorPro.com
Abercrombie & Fitch (ANF) is part of the retail apparel industry group and the consumer discretionary sector. ANF surged with a gap up in early April, but failed to hold this surge and filled the gap in mid April.
The inability tohold the gap-surge shows weakness. There was another, and...
READ MORE
MEMBERS ONLY
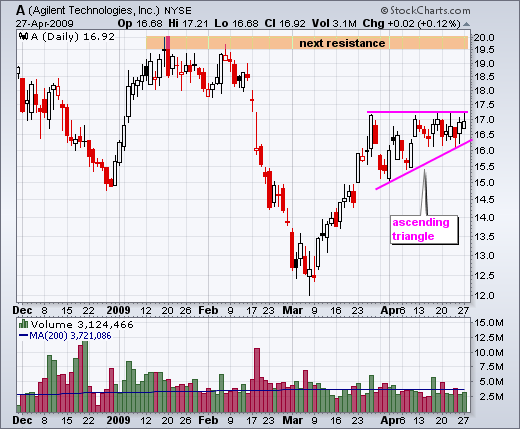
Agilent Traces Out Ascending Triangle
by Arthur Hill,
Chief Technical Strategist, TrendInvestorPro.com
Agilent Technology (A) surged in March and then formed an ascending triangle over the last 4-5 weeks. These classic patterns are bullish continuation patterns that require confirmation with a breakout.
The equal highs around 17.2 mark overhead supply (resistance). The higher lows in April show buying pressure (demand) coming...
READ MORE
MEMBERS ONLY
CNP Breaks Pennant Resistance
by Arthur Hill,
Chief Technical Strategist, TrendInvestorPro.com
Centerpoint Energy (CNP) is part of the electric utilities group. The defensive utilities sector has been struggling lately, but managed a gain in the face of Monday's market weakness.
Investors may turn to defense if the market weakens further. CNP surged with good volume in mid March and...
READ MORE
MEMBERS ONLY
New High for AD Line
by Arthur Hill,
Chief Technical Strategist, TrendInvestorPro.com
The NYSE AD Line moved above its January high to record a new high for 2009. In contrast, the NY Composite Index remains below its January high. This show of relative strength in the AD Line reflects broad participation in the current advance and bodes well for the current uptrend....
READ MORE
MEMBERS ONLY
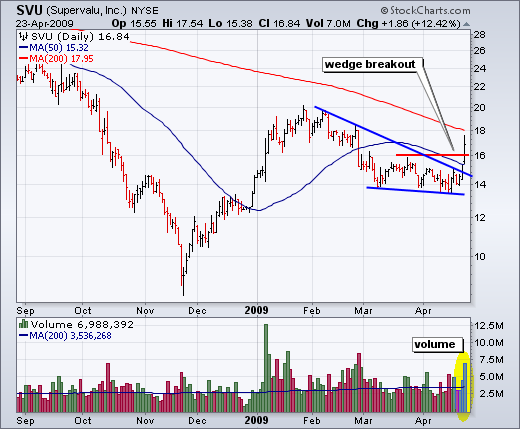
Super Surge for Super Valu
by Arthur Hill,
Chief Technical Strategist, TrendInvestorPro.com
Super Value (SVU) surged above its 50-day moving average and wedge resistance with a big move on big volume. The 200-day moving average is just ahead for the next challenge....
READ MORE
MEMBERS ONLY
Air Products Surges on Big Volume
by Arthur Hill,
Chief Technical Strategist, TrendInvestorPro.com
Air Products (APD) is part of the chemicals group and the basic materials sectors. After surging to resistance in March, the stock consolidated around the 60 the last few weeks. The bulls came out in force as the stock surged to its highest level of the year with big volume...
READ MORE