MEMBERS ONLY
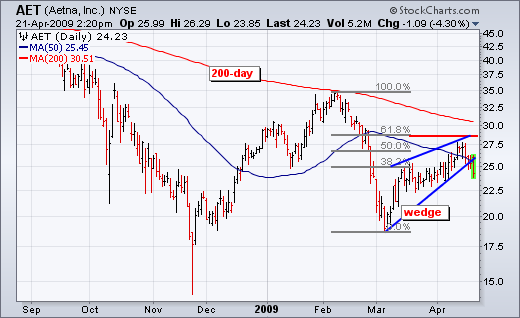
AETNA Breaks Wedge Trendline
by Arthur Hill,
Chief Technical Strategist, TrendInvestorPro.com
Aetna (AET) retraced 62% of the Feb-Mar decline with a rising wedge that peaked in mid April. Both the wedge and the retracement are typical for corrective rallies within bigger downtrends. Also notice that the 200-day moving average is falling and the 50-day moving average is below the 200-day moving...
READ MORE
MEMBERS ONLY
RTH Hits Resistance
by Arthur Hill,
Chief Technical Strategist, TrendInvestorPro.com
The Retail HOLDRs (RTH) hit massive resistance around 78-80 for the third time since October. Resistance in this area stems from the October, January and April highs. In addition, the falling 200-day moving average is coming into play. After a run from 60 to 80, RTH is ripe for a...
READ MORE
MEMBERS ONLY
Wal-Mart Shows Relative Weakness
by Arthur Hill,
Chief Technical Strategist, TrendInvestorPro.com
Wal-Mart (WMT), which is the biggest component in RTH, is leading the way lower with a break below its 50-day moving average on Monday. Notice that WMT peaked at the 200-day moving average on 2-April and did not follow the broader market higher over the last two weeks. The king...
READ MORE
MEMBERS ONLY
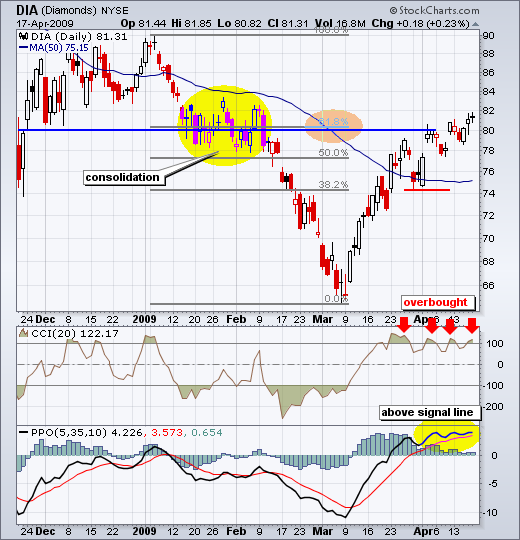
DIA MAINTAINS UPTREND
by Arthur Hill,
Chief Technical Strategist, TrendInvestorPro.com
The Dow Industrials ETF (DIA) shows a classic case of becoming overbought and remaining overbought. I featured DIA in ChartWatchers two weeks ago as it hit potential resistance around 80. The song remains the same as DIA finished at 81.31 on Friday.
Let's review resistance. First, the...
READ MORE
MEMBERS ONLY
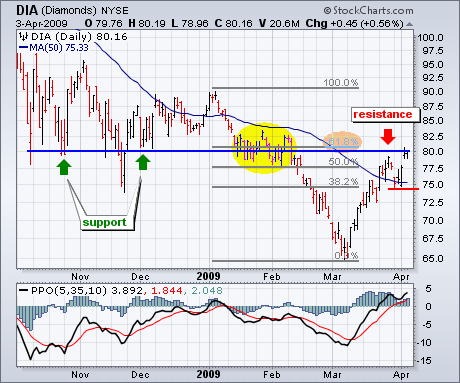
DIA SURGES OFF 50-DAY
by Arthur Hill,
Chief Technical Strategist, TrendInvestorPro.com
The Dow Industrials ETF (DIA) surged off its 50-day moving average with a big advance on Wednesday and a gap on Thursday. While the four-week surge is most impressive, the ETF is running into a resistance zone and becoming overbought. First, broken supports around 80 turn into resistance. This level...
READ MORE
MEMBERS ONLY
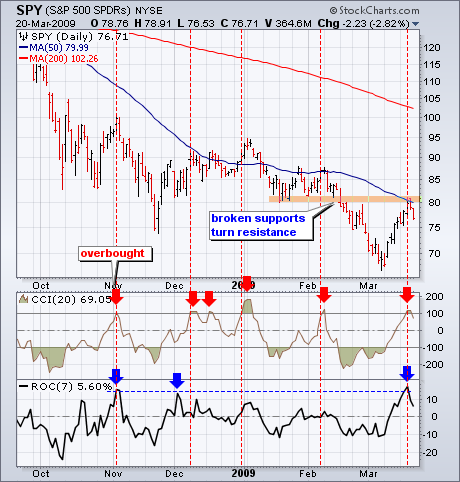
SPY HITS RESISTANCE
by Arthur Hill,
Chief Technical Strategist, TrendInvestorPro.com
After a sharp advance the last two weeks, SPY hit a classic resistance zone and pulled back over the last two days. Three items confirm resistance in the low 80s. First, broken support around 80-81 turns into resistance. Second, the falling 50-day moving average marks resistance. Third, the advance retraced...
READ MORE
MEMBERS ONLY
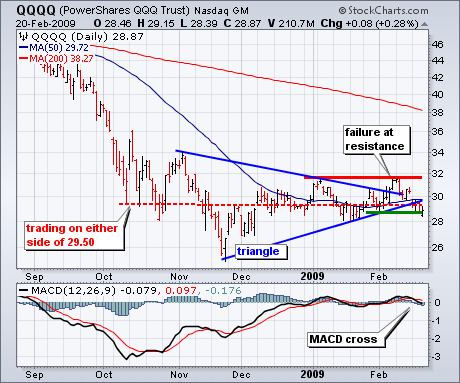
TECHS TAKE A PUNCH
by Arthur Hill,
Chief Technical Strategist, TrendInvestorPro.com
Two weeks ago I featured the Nasdaq 100 ETF (QQQQ) with a triangle breakout, strong OBV and relative strength. The ETF surged to resistance from the early January high, but ultimately failed to break above this key level. With a sharp decline over the last eight trading days, the trading...
READ MORE
MEMBERS ONLY
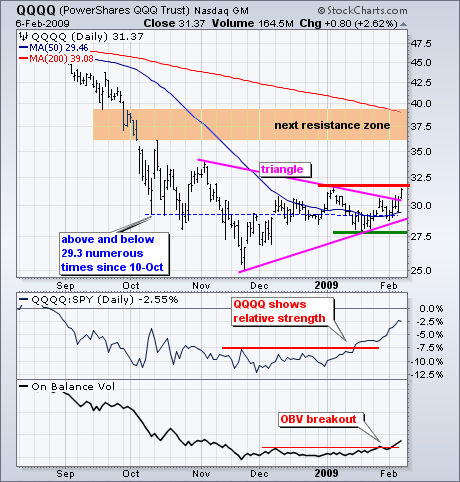
OBV AND RELATIVE STRENGTH DRIVE QQQQ
by Arthur Hill,
Chief Technical Strategist, TrendInvestorPro.com
The Nasdaq 100 ETF (QQQQ) is breaking out of its trading range. The chart below shows QQQQ stuck in a trading since 10-Oct. Focusing on the blue dotted line marking the mid October lows, we can see that QQQQ traded above and below this line numerous times the last four...
READ MORE