MEMBERS ONLY
Smaller Biotechs are Outperforming Larger Biotechs (IBB, XBI and XLV)
by Arthur Hill,
Chief Technical Strategist, TrendInvestorPro.com
* Biotechs Perk Up.
* Average-Cap XBI versus Large-cap IBB.
* IBB Surges off Support.
* XBI Holds Above Support.
* Health Care SPDR Bounces off Retracement Zone.
Biotechs showed some upside leadership with a big surge last week, most of which occurred on Friday. This group has been lagging the market in 2018, but...
READ MORE
MEMBERS ONLY
Weekly Market Review & Outlook (with Video) - Semis, Finance and Industrials Rebound
by Arthur Hill,
Chief Technical Strategist, TrendInvestorPro.com
* Weighing the Evidence.
* S&P 500 Breaks April High and Reverses Downswing.
* Small-caps Lead with New High.
* Small-caps are Really Really Small.
* Nasdaq 100 Leads New High List.
* Small-cap Sectors Lead.
* Tech, Finance and Industrials Dominate.
* Small-cap Industrials Sector Leads.
* Finance Sector Recovers.
* Notes from the Art's...
READ MORE
MEMBERS ONLY
Ringing the Bell for Hilton
by Arthur Hill,
Chief Technical Strategist, TrendInvestorPro.com
Hilton (HLT) led the market in the second half of 2017 and then took a breather in 2018. This is looking like the pause that refreshes as the stock challenges resistance.
First and foremost - you know the drill - the long-term trend is up and this means I am...
READ MORE
MEMBERS ONLY
Banks Lead on Multiple Timeframes - Plus JPM, MS, Energy-ETFs, Bonds and Utes
by Arthur Hill,
Chief Technical Strategist, TrendInvestorPro.com
* Banks Lead on Multiple Timeframes.
* Regional Bank SPDR Extends Upturn.
* Big Banks are Mixed.
* Wedge Corrections for JPM and MS.
* Small-caps Get Dollar Tailwind.
* Energy ETFs Break Out of Consolidations.
* Bond Market Breakdown Holds.
* Utilities Look Poised to Continue Downtrend.
Banks Lead on Multiple Timeframes...
The PerfChart below shows the...
READ MORE
MEMBERS ONLY
Discount Brokers Lead the Market
by Arthur Hill,
Chief Technical Strategist, TrendInvestorPro.com
The discount brokers are showing strength in the broader market with E-Trade Financial (ETFC) and Interactive Brokers (IBKR) hitting new highs in May. Schwab (SCHW) is breaking out of a small triangle, while TD Ameritrade is bouncing within a bigger triangle. A picture is worth a thousand words and the...
READ MORE
MEMBERS ONLY
Breadth Thrust Shows Expanding Participation - SOXX Surges off Support - A Bunch of Stock Setups
by Arthur Hill,
Chief Technical Strategist, TrendInvestorPro.com
* One-Day Breadth Thrust.
* SOXX Surges off Support.
* Four Semiconductor Stocks to Watch.
* A Bollinger Band Squeeze for Akamai.
* Five Stocks to Watch: ABT, ACN, ANTM, HCA, SLB.
One-Day Breadth Thrust...
As noted last Thursday, I was not impressed with the breadth indicators because they showed narrow upside participation. This changed...
READ MORE
MEMBERS ONLY
The Bird's Eye View: Big Advances Deserve Big Corrections
by Arthur Hill,
Chief Technical Strategist, TrendInvestorPro.com
2018 has been a tough year for stocks with the S&P 500 SPDR (SPY) basically unchanged (+.08%) for the year. During this journey to unchanged, SPY was up around 7% at its late January high and down around 5% at its February low. The index has since gyrated...
READ MORE
MEMBERS ONLY
Weekly Market Review & Outlook (with Video) - Slugging without Conviction
by Arthur Hill,
Chief Technical Strategist, TrendInvestorPro.com
* S&P 500 Caught in the Crossfire.
* SPY Reverses Upswing.
* Large-cap Tech Holds up Well.
* A Bull Flag in the S&P SmallCap iShares.
* Finance and Industrials Weigh.
* Healthcare Breakdown Tilts the Balance.
* Mind the Gap in Tech-Related ETFs.
* Oil Forms Bull Flag.
* Gold Forges Lower Low and...
READ MORE
MEMBERS ONLY
Breadth Indicators Fail to Inspire (with Video)
by Arthur Hill,
Chief Technical Strategist, TrendInvestorPro.com
* Breadth Falls Short.
* Chart Links and Video.
* Looking for a Breadth Thrust.
* Still a Correction?
* %Above 200-day Indicator Waffles.
* The Weight of the Evidence.
* Where to Find the Symbols.
Breadth Falls Short
Enthusiasm among the bulls is waning and this is reflected in the breadth stats over the last two...
READ MORE
MEMBERS ONLY
Alphabet: Is it time to Bounce?
by Arthur Hill,
Chief Technical Strategist, TrendInvestorPro.com
It has been a rough year for Alphabet, also known as Google, but the stock is still in a long-term uptrend and firming near a solid support zone. This could give way to a bounce.
First, the stock advanced some 30% and hit a 52-week high in January. Second, the...
READ MORE
MEMBERS ONLY
Visa Hits New High and Chases Mastercard
by Arthur Hill,
Chief Technical Strategist, TrendInvestorPro.com
Visa (V) is leading the stock market as it breaks out of a triangle and records a fresh new high. The stock is now setting its sights on its big rival, Mastercard.
The chart below shows Visa in the top window with a steady advance from May to January and...
READ MORE
MEMBERS ONLY
A Baker's Dozen - Stocks to Watch for this Stock Picker's Market
by Arthur Hill,
Chief Technical Strategist, TrendInvestorPro.com
* Throwbacks after Breakouts.
* Triangles within Bigger Uptrends.
* Stock with Fresh Breakouts.
* Corrections within Uptrends.
* Two Dozen Strong Uptrends.
As noted in Friday's commentary, the performance of stocks in the S&P 500 is split and it a stock picker's market. I am even seeing divisions...
READ MORE
MEMBERS ONLY
Weekly Market Review & Outlook (with Video) - Divided and Range Bound
by Arthur Hill,
Chief Technical Strategist, TrendInvestorPro.com
* Small-caps Continue to Lead.
* IJR Remains with Bullish Continuation Pattern.
* Large-cap Techs are Lagging, but Trending Up.
* A Divided Market.
* The S&P 500 is Stuck in the Middle.
* %Above 50-day EMA Struggling.
* Countering the Downward Breadth Thrusts.
* Healthcare Perks Up.
* Biotech ETFs Get Oversold Bounces.
* Notes from the...
READ MORE
MEMBERS ONLY
Sector Splits Divide Broader Market - Plus Banks, Energy-Related ETFs, Telcos and Four Stocks
by Arthur Hill,
Chief Technical Strategist, TrendInvestorPro.com
* SPY Tests Upswing Support.
* Finance Sector Holds Up Best.
* Two Down and Three to Go.
* KRE Still Looking Positive.
* Bullish Continuation Patterns in Energy-Related ETFs.
* A Few Telcos Come Alive.
* Four Stocks to Watch.
SPY Tests Upswing Support...
I marked upswing support for the S&P 500 SPDR (SPY)...
READ MORE
MEMBERS ONLY
QQQ: Breakdown, Mean-Reversion Opportunity or Both?
by Arthur Hill,
Chief Technical Strategist, TrendInvestorPro.com
The Nasdaq 100 ETF (QQQ) broke down with a sharp decline the last five days and this pushed RSI(5) below 30 for a short-term oversold reading. The breakdown is bearish, but it has also created a short-term mean-reversion opportunity.
I first introduced a mean-reversion trading system using RSI in...
READ MORE
MEMBERS ONLY
Monitoring the Swings in SPY and the 5 Big Sectors - Plus KRE, GOOGL, NKE, UNH and BAC
by Arthur Hill,
Chief Technical Strategist, TrendInvestorPro.com
* SPY Pulls Back within Channel.
* Monitoring Upswings in the Big Sectors.
* Regional Bank ETF Extends Short-term Bounce.
* Smelly SOXX.
* Google Holds the Gap.
* Nike Forms Flag within Triangle.
SPY Pulls Back within Channel...
There are three stages to a trend reversal. First, there is the bottom picking stage when momentum...
READ MORE
MEMBERS ONLY
Costco Breaks Triangle Line with Big Gap
by Arthur Hill,
Chief Technical Strategist, TrendInvestorPro.com
Costco (COST) is showing some upside leadership this year with a triangle breakout and challenge to the January high.
Long-term trend identification is important because it sets my bias going forward. My bias is bullish when the long-term trend is up and this means I favor bullish patterns over bearish...
READ MORE
MEMBERS ONLY
Three Strike Trend Following with the PPO
by Arthur Hill,
Chief Technical Strategist, TrendInvestorPro.com
The Percentage Price Oscillator (PPO) is mostly used as a momentum oscillator, but chartists can also use it to define the trend, even the long-term trend. Chartists interested in trend signals can simply ignore the wiggles and the signal line, and instead focus on zero line crossovers.
As noted in...
READ MORE
MEMBERS ONLY
Weekly Market Review & Outlook - The Range Narrows
by Arthur Hill,
Chief Technical Strategist, TrendInvestorPro.com
* A Narrowing Range for the S&P 500.
* Monitoring the Upswing in SPY.
* Raff Regression Channel Explained.
* QQQ Weathers Semiconductor Weakness.
* IJR Challenges Rim Resistance.
* Big Wedge and Little Wedge in XLF.
* XLY, XLK and XLI Lead the Big Sectors.
* SOXX Fails to Hold Breakout.
* Notes from the Art&...
READ MORE
MEMBERS ONLY
Finance and Banks Lag, but 10-yr Yield Breaks Out as Commodities Move Higher
by Arthur Hill,
Chief Technical Strategist, TrendInvestorPro.com
* IJR Moves above Chandelier Exit.
* Finance Sector Underperforms.
* Regional Bank SPDR Forms Bear Flag.
* 10-yr Yield Breaks out of Flag.
* Yield Curve Sinks to Multi-year Lows.
* Bond Bounce May be Ending.
* Commodities are on the Move.
* Copper Bounces off Support (plus COPX).
* Gold Forms Bullish Cup-with-Handle.
The S&P...
READ MORE
MEMBERS ONLY
Silver Surges out of Bollinger Band Squeeze
by Arthur Hill,
Chief Technical Strategist, TrendInvestorPro.com
Industrial metals surged on Wednesday with 2+ percent gains coming in silver, aluminum, palladium, copper and nickel. The Silver ETF (SLV), in particular, finally broke out of a two-month consolidation.
The chart below shows the Silver ETF (SLV) with Bollinger Bands in pink and BandWidth in the indicator window. Overall,...
READ MORE
MEMBERS ONLY
SPY Grinds Higher as Bullish Continuation Pattern Brews in Small-Cap ETF
by Arthur Hill,
Chief Technical Strategist, TrendInvestorPro.com
* Small-caps Rise as Large-caps Grind.
* Cup-with-handle Evolves in IJR.
* Three Leading Small-Cap Sectors.
* XRT Holds Breakout.
* Providers and Devices Lead Healthcare.
* ITA Edges Above Short-term Resistance.
* Delta and Micron Correct within Uptrends.
Small-caps Rise as Large-caps Grind...
After a fairly dismal March, stocks moved higher this month with small-caps leading...
READ MORE
MEMBERS ONLY
Analog Devices Reverses Course at Key Retracement
by Arthur Hill,
Chief Technical Strategist, TrendInvestorPro.com
Analog Devices (ADI) is a large semiconductor stock and a leader in the internet of things (IoT). The stock is in a long-term uptrend and recently broke short-term resistance to reverse a short-term pullback.
First and foremost, the long-term trend is up. The stock hit a 52-week high in January,...
READ MORE
MEMBERS ONLY
Weekly Market Review & Outlook (with Video) - Tech Springs Back and High-Low Lines Turn
by Arthur Hill,
Chief Technical Strategist, TrendInvestorPro.com
* Three Strikes and your Out - But Not Yet.
* SPY Attempts to Reverse Downswing.
* IJR Leading in April.
* QQQ Springs to Life.
* High-Low Lines Turn Up.
* Tech-Related ETFs Break Out in Unison.
* XBI, SLX and the Problem with Reversal Patterns.
* Bear Market Bounce for Bonds, Utes and REITs.
* Gold Stays...
READ MORE
MEMBERS ONLY
SystemTrader - Putting the 200-day Moving Average through the Wringer
by Arthur Hill,
Chief Technical Strategist, TrendInvestorPro.com
* Introduction and Overview.
* How Many Crosses in the Last 25 Years?
* Crunching the Numbers.
* Putting the Dow Industrials to the Test.
* SPY, SPX and Dividends.
* Slowing Down the Trigger.
* Reduce Risk and Get on the Right Side.
* Summarizing the Results.
* Consulting, Software and Data.
The S&P 500 is...
READ MORE
MEMBERS ONLY
Bulls and Bears Slug it Out within Trading Range
by Arthur Hill,
Chief Technical Strategist, TrendInvestorPro.com
* SPY Challenges Short-term Resistance.
* Small-caps Continue to Act Well.
* Retail Comes Alive.
* Kohls, Nordstrom and Michael Kors.
* Cyber Security, Networking and Software Show Leadership.
* Copper Miners ETF Breaks Out within Consolidation.
SPY Challenges Resistance...
The S&P 500 is flirting with the 200-day simple moving average as it consolidates...
READ MORE
MEMBERS ONLY
Frontier Markets are Outperforming US Market
by Arthur Hill,
Chief Technical Strategist, TrendInvestorPro.com
The Frontier Markets ETF (FM) has been outperforming the S&P 500 SPDR (SPY) since summer and held up much better than the US market in March-April. FM recently broke out of a consolidation and it looks like the bigger uptrend is continuing.
The chart below shows FM with...
READ MORE
MEMBERS ONLY
The 800-pound Gorilla Continues to Struggle
by Arthur Hill,
Chief Technical Strategist, TrendInvestorPro.com
The percentage of stocks above the 50-day EMA is a breadth indicator that measures internal performance. Chartists can compare this indicator across indexes to identify the leaders and laggards. The Nasdaq 100 is the weakest of the major indexes and weighing on the broader market.
The chart below shows %Above...
READ MORE
MEMBERS ONLY
Weekly Market Review & Outlook (with Video) - Two Down and One to Go
by Arthur Hill,
Chief Technical Strategist, TrendInvestorPro.com
* Two Down, One To Go.
* QQQ: Bruised, but not Quite Broken.
* Small-caps Continue to Show Relative Strength.
* Small-cap Consumer Discretionary and Industrials Lead.
* Housing and Retail Lead CD.
* Tech-related ETFs Remain Subdued.
* Watching the Channel in Oil.
* Notes from the Art's Charts ChartList.
Trends depend on timeframes and...
READ MORE
MEMBERS ONLY
DSW Takes the Lead with a New High
by Arthur Hill,
Chief Technical Strategist, TrendInvestorPro.com
The S&P 500 is well below its January high and trading near its February low. DSW, in contrast, hit a 52-week high last week and is clearly leading the market.
The chart shows DSW with a choppy advance from mid August to mid November and then a choppy...
READ MORE
MEMBERS ONLY
The Range Narrows on the S&P 500 - Plus 3 ETFs, Energy and 5 Stocks
by Arthur Hill,
Chief Technical Strategist, TrendInvestorPro.com
* A Narrowing Range for the S&P 500.
* A Bearish Pennant or Higher Low?
* Not Always the End of the World.
* Three Industry Group ETFs to Watch (ITA, ITB, IAI).
* Energy ETFs Continue Consolidation.
* Stocks to Watch (APC, HAL, MSFT, INTC, ATVI).
A Narrowing Range for the S&...
READ MORE
MEMBERS ONLY
Weekly Market Review & Outlook - Green Shoots Appearing
by Arthur Hill,
Chief Technical Strategist, TrendInvestorPro.com
* To Bounce or Not To Bounce.
* %Above 200-day EMA at Inflection Point.
* Fewer New Lows in March.
* Seasonality is Quite Bullish in April.
* A Big Triangle for the S&P 500.
* Playing the Swings within the Triangle.
* QQQ is Not Broken.
* Small-caps are Showing Relative Strength.
* Gold Falls back...
READ MORE
MEMBERS ONLY
SystemTrader - Putting the Put-Call Ratio Through the Wringer
by Arthur Hill,
Chief Technical Strategist, TrendInvestorPro.com
* Introduction and Overview.
* A Historical Look at the Ratio.
* Put Volume Surges to Multi-year Levels.
* The Eye-Ball Signals.
* Putting Together a System.
* Running the Numbers.
* Conclusions.
...The Put-Call Ratio is getting a lot of attention lately so I took a stab at building a trading system around this indicator.
Sentiment...
READ MORE
MEMBERS ONLY
Pfizer Bounces within Uptrend
by Arthur Hill,
Chief Technical Strategist, TrendInvestorPro.com
The pickings are slim as the market corrects and may charts turn ugly. I am noticing some strength in big pharma with Merck (MRK) up in March and Pfizer (PFE) holding above the early February low (so far).
The chart shows PFE with a zigzag uptrend since June. The stock...
READ MORE
MEMBERS ONLY
An RSI Failure Swing in Ross Stores
by Arthur Hill,
Chief Technical Strategist, TrendInvestorPro.com
The S&P 500 was shaken with a plunge below its 200-day SMA on Friday and this gives chartists a reference point to compare with other charts.
Personally, I do not think moving averages represent support or resistance levels. Moving averages provide price points that chartists can use to...
READ MORE
MEMBERS ONLY
SystemTrader - Would you have the Nerve? - Revisiting Mean-Reversion and Adding Leverage
by Arthur Hill,
Chief Technical Strategist, TrendInvestorPro.com
* Universe, Market Regime and Ground Rules.
* Know Your Indicators.
* Sample Signals for IJR and QQQ.
* Testing the Big Four.
* Plotting Equity and Drawdowns.
* Testing Four Leveraged ETFs.
* Conclusions and Caveat Emptor!
Introduction and Overview...
Stocks fell sharply the last two weeks and RSI became oversold for most major index ETFs....
READ MORE
MEMBERS ONLY
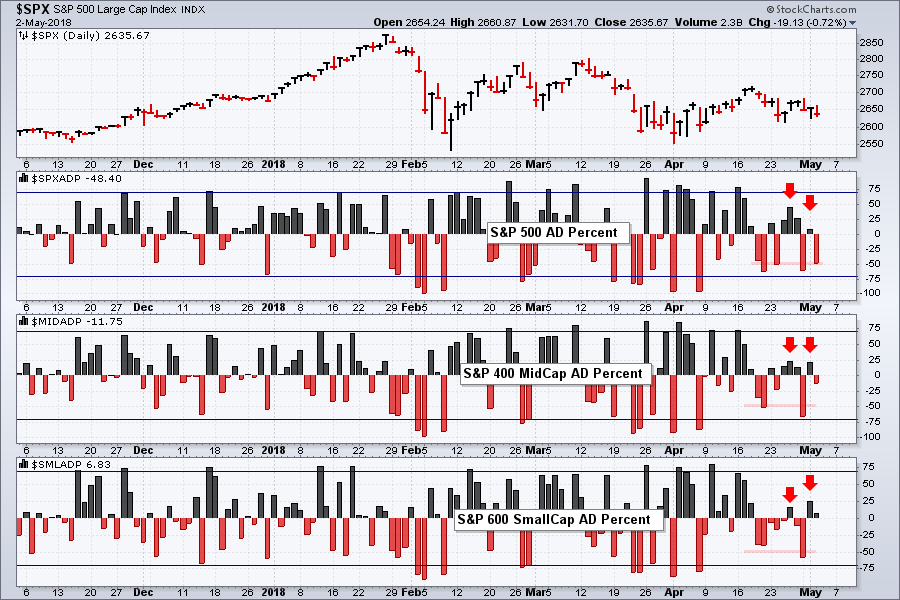
Breadth: Weighing Active Bullish Signals Against New Bearish Signals
by Arthur Hill,
Chief Technical Strategist, TrendInvestorPro.com
* Another Bearish Breadth Thrust.
* High-Low Percent Indicators Remain Bullish.
* %Above 200-day Indicators Dip below 50%.
* Index Table Remains Bullish.
* Sector Breadth Highlights.
* Bottom Line: Still a Bull Market.
Breadth Overview ...
The following breadth assessment is based on three breadth indicators. First, the 10-day EMA of AD Percent is used to...
READ MORE
MEMBERS ONLY
Weekly Market Review & Outlook (with Video) - As the Roller Coaster Turns
by Arthur Hill,
Chief Technical Strategist, TrendInvestorPro.com
* The 2018 Roller Coaster Continues.
* High-Low Line Turns Down for XLY.
* SPY Leads the Wedge Break Downs.
* XLF, XLV, XLY and XLB Break Wedge Lines.
* When Oversold is Not Such an Opportunity.
* XLI Breaks Triangle Support.
* Breakaway Gaps for XLK.
* Gold Bounces off Support Zone.
* Oil Holds Breakout.
* Notes from...
READ MORE
MEMBERS ONLY
QQQ Traps Traders on the Island as SPY Extends Wedge Break
by Arthur Hill,
Chief Technical Strategist, TrendInvestorPro.com
* QQQ Holds Gap for Three Days.
* SPY Holds Wedge Break.
* Charting the Fab Five.
* MMM and Honeywell Join Dow Triangulation.
QQQ Traps Traders on the Island ...
QQQ formed an island reversal with Monday's gap down and held this gap for three days. Chartists sometimes apply time filters to...
READ MORE
MEMBERS ONLY
Gold: Is this Another Head Fake or the Beginning of a Move?
by Arthur Hill,
Chief Technical Strategist, TrendInvestorPro.com
* Gold and the Dollar Hit Inflection Points.
* Dollar Bumps Into Short-term Resistance.
* Gold Miners Underperform Gold.
* GDX Tests Low End of Range.
Gold Channels Harden...
For the third time in six weeks, the Gold SPDR (GLD) is surging above the 125 level and making a bid to reverse within a...
READ MORE