MEMBERS ONLY
Microsoft and Alphabet Lead the Fab Five - Four Stock Setups - Bitcoin Index Hits New High
by Arthur Hill,
Chief Technical Strategist, TrendInvestorPro.com
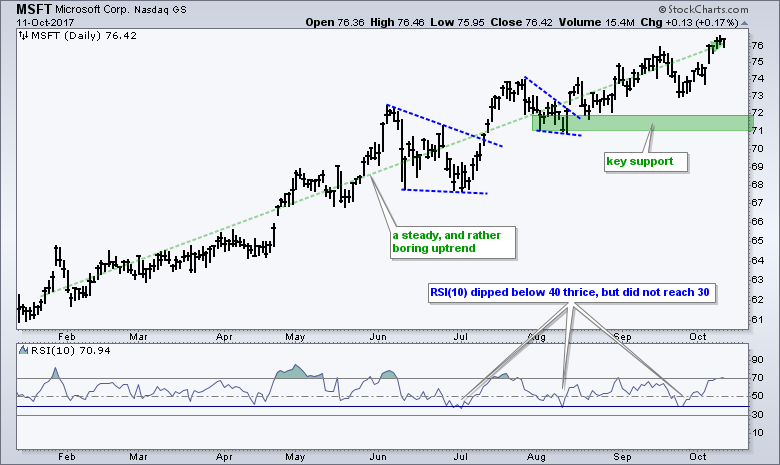
.... Microsoft Leads Fab Five with New High
.... Alphabet Breaks Triangle Line
.... Apple Reverses after Oversold Reading
.... Amazon Breaks Wedge Line
.... Avago Pattern Evolves into Ascending Triangle
.... Cornerstone OnDemand Forms Double Bottom
.... Universal Display Firms at Support and Zoetis Turns Up
.... Understanding Cryptos and Blockchain
.... Bitcoin Index Hits New High ....
Microsoft...
READ MORE
MEMBERS ONLY
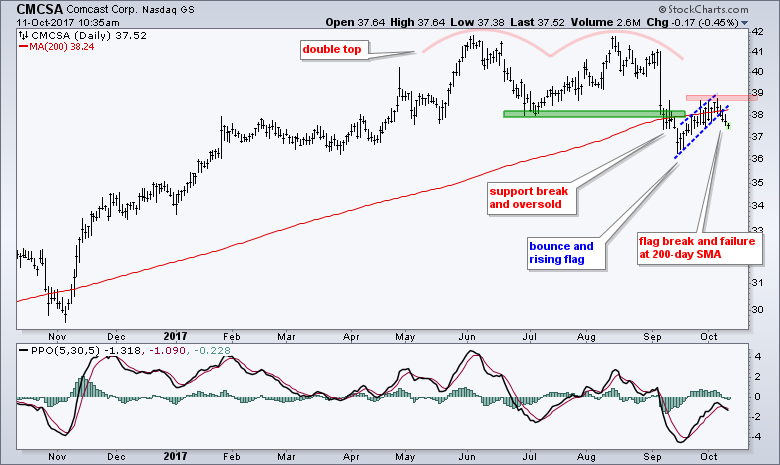
Comcast Fails at a Key Moving Average
by Arthur Hill,
Chief Technical Strategist, TrendInvestorPro.com
A recent double top and failure at the 200-day SMA point to lower prices for Comcast (CMCSA). The double top formed from May to early September with two highs around 42 and a low around 38. Comcast broke this low with a sharp decline and then became oversold. The stock...
READ MORE
MEMBERS ONLY
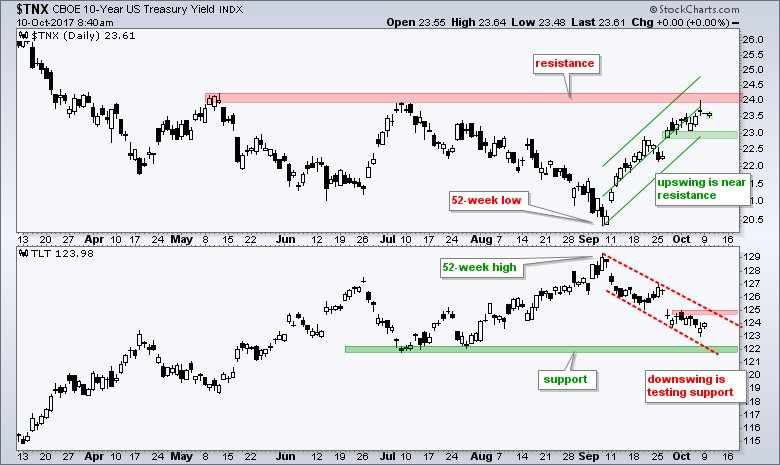
10-yr Yield and TLT Hit Moment-of-Truth - Gold, Silver and Gold Miners Reverse in Fib Zone
by Arthur Hill,
Chief Technical Strategist, TrendInvestorPro.com
.... Nearing the Moment-of-truth for TLT and $TNX
.... How the 10-yr Yield Affects other Names
.... Gold, Silver and Gold Miners Reverse Near Key Retracement
.... Newmont Forms Bull Flag
.... Working with High-Low Percent Indicators
.... Finance, Industrials, Tech and Materials Lead New High List
.... New Highs Expand for XLK
.... Three Different Sector Views...
READ MORE
MEMBERS ONLY
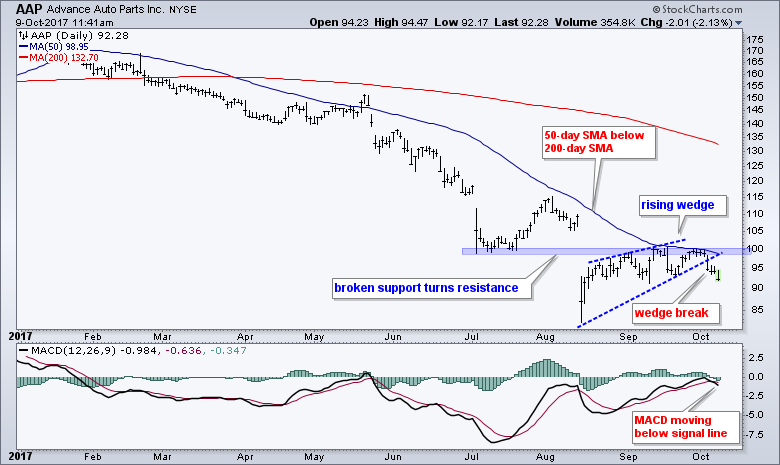
One of the Weakest Stocks in the S&P 500 Looks Set to Get Even Weaker
by Arthur Hill,
Chief Technical Strategist, TrendInvestorPro.com
The S&P 500 is near all time highs and we are in a bull market, but Advance Auto Parts (AAP) did not get the memo and recent signals point to new lows. First and foremost, the long-term trend is down because the 50-day SMA is below the 200-day...
READ MORE
MEMBERS ONLY
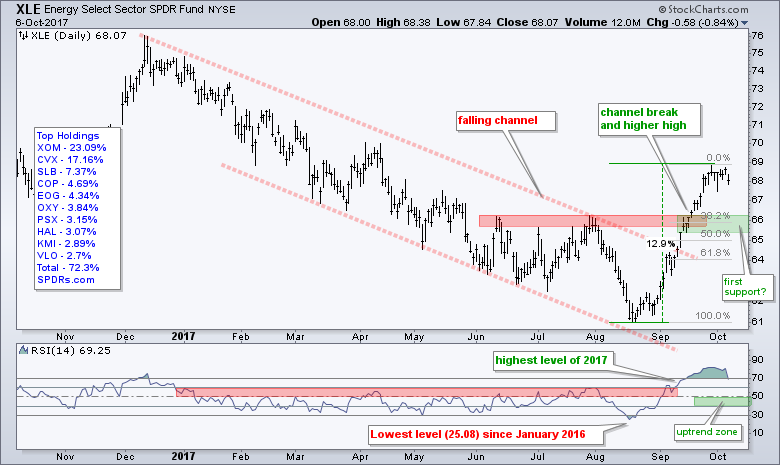
A Pullback in the Energy SPDR? Here's What to Watch.
by Arthur Hill,
Chief Technical Strategist, TrendInvestorPro.com
The Energy SPDR (XLE) is the top performing sector SPDR since mid August with a double digit advance over the last seven weeks. On the price chart, XLE broke out of the channel, exceeded its summer highs and pushed RSI above 70 for the first time this year. It was...
READ MORE
MEMBERS ONLY
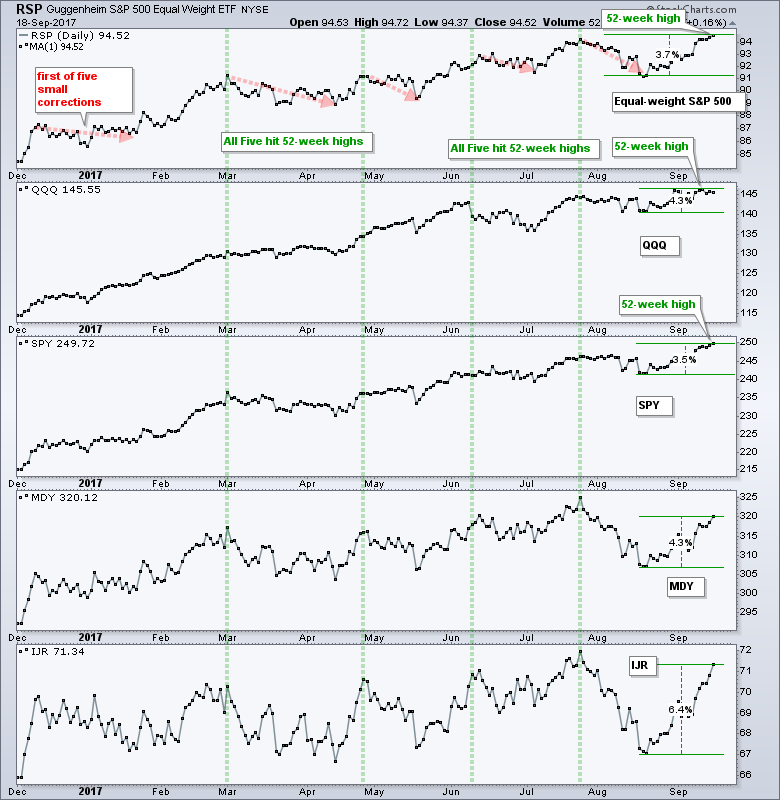
Weekly Market Review & Outlook - Small-Caps and Finance Extend their Lead
by Arthur Hill,
Chief Technical Strategist, TrendInvestorPro.com
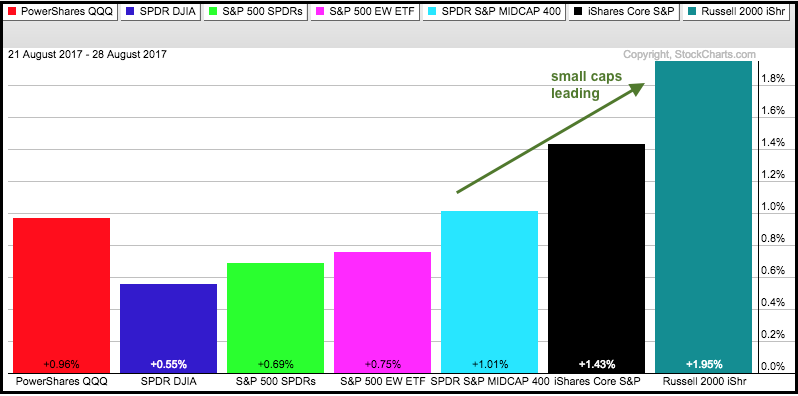
.... Small-caps Lead Broadening Rally
.... Small-caps High-Low Percent hits 2017 High
.... Death of QQQ Greatly Exaggerated
.... IJR Extends on Breakout
.... Sectors Reflect Broad Strength
.... Tech, Finance, Industrials and Materials Lead
.... HealthCare SPDR Turns Up after Pullback
.... XLY Catches a Strong Bid
.... XLU Goes for a Flag Breakout
.... Energy Stalls after Big...
READ MORE
MEMBERS ONLY
SystemTrader - Testing a Basic PPO System with a Profit Target and Momentum Filter
by Arthur Hill,
Chief Technical Strategist, TrendInvestorPro.com
.... Testing the Basic PPO Signal Line Cross
.... Setting the Benchmark
.... Consulting, Software and Data
.... System Ground Rules
.... PPO Signal Line System
.... A Winning Chart and a Losing Chart
.... Breaking a Tie and Favoring Momentum
.... Backtest Results Favor Large-caps
.... Profit Factor Metric
.... Conclusions and Caveat Emptor ....
Testing the Basic PPO Signal...
READ MORE
MEMBERS ONLY
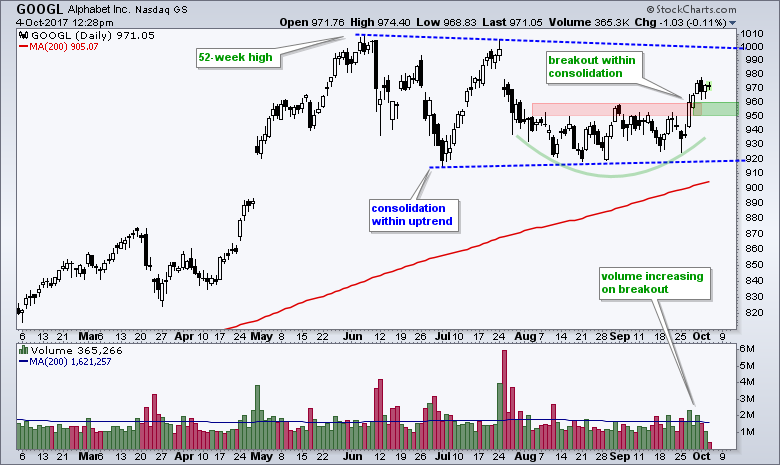
Alphabet Turns up with Increase in Volume
by Arthur Hill,
Chief Technical Strategist, TrendInvestorPro.com
Alphabet, which some of you may know as Google, surged off a support zone with good volume and broke short-term resistance. This breakout could evolve into more because the big picture is also bullish. GOOGL advanced to a new high in May and then consolidated with a long consolidation. The...
READ MORE
MEMBERS ONLY
Techs and Industrials Lead New High List - Metals-Mining and Steel ETFs Turn Up - Four Stock Setups
by Arthur Hill,
Chief Technical Strategist, TrendInvestorPro.com
.... The Little Bull that Could
.... Industrials, Finance and Tech Lead New High List
.... Cyber Security and Networking ETFs Turn Up
.... Strategy Note - A New High in the Future
.... Metals-Mining and Steel ETFs Bid to End Pullbacks
.... Freeport McMoran Stalls within Uptrend
.... Nucor and Steel Dynamics Attempt to End Corrections...
READ MORE
MEMBERS ONLY
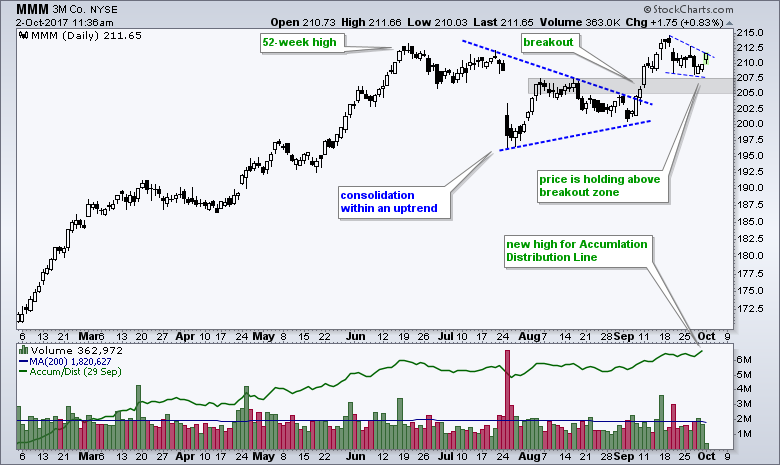
3M Holds the Breakout Zone $MMM
by Arthur Hill,
Chief Technical Strategist, TrendInvestorPro.com
3M (MMM) is helping itself and the Dow Industrials with a breakout in mid September. As a price-weighted average, the stocks with the highest price carry the most weight and MMM, which is the third highest-priced stock, accounts for around 6.5% of the Dow. On the price chart, the...
READ MORE
MEMBERS ONLY
Weekly Market Review & Outlook (w/ Video) - Small and Micro Caps Make a Move
by Arthur Hill,
Chief Technical Strategist, TrendInvestorPro.com
.... VIX Extends its Low Run
.... Revisiting Seasonality
.... QQQ Lags, but Doesn't Drag
.... Small-caps and Micro-caps Take the Lead
.... Biggest Momentum Surge in 10 Years for IJR
.... Sector Participation Supports Bull Market
.... Industrials and Finance Lead with Fresh Highs
.... Technology and Materials Not Far Behind
.... Healthcare and Utilities Correct...
READ MORE
MEMBERS ONLY
Momentum Divergences: Understanding, Knowing When to Ignore and Knowing When to Trade
by Arthur Hill,
Chief Technical Strategist, TrendInvestorPro.com
Most of us are familiar with positive and negative divergences in momentum indicators. These divergences suggest that directional momentum is slowing and there could be a trend reversal. There is just one problem. Most divergences are at odds with the bigger trend. Most negative divergences form in an uptrend and...
READ MORE
MEMBERS ONLY
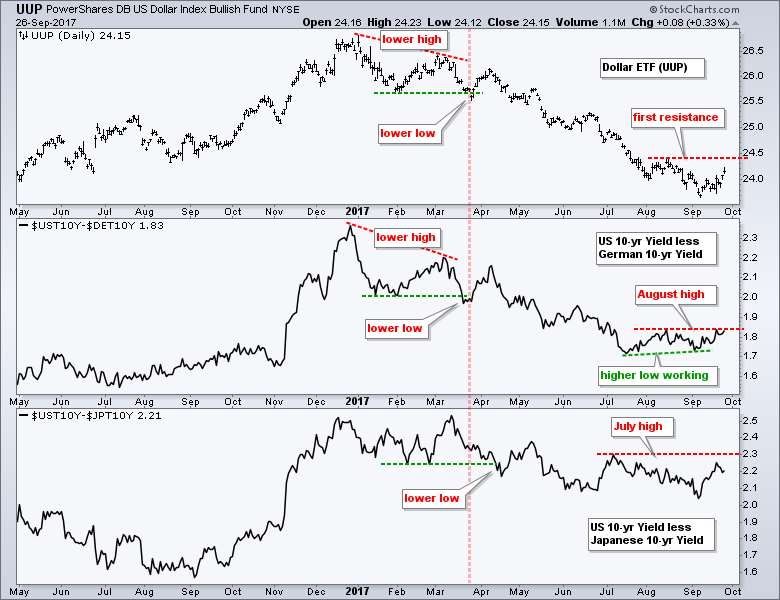
Watch these Yield Spreads for Clues on the Greenback
by Arthur Hill,
Chief Technical Strategist, TrendInvestorPro.com
The US Dollar ETF (UUP) is made of five currency pairings. The Dollar/Euro ($USDEUR) pair accounts for 57.6%, Dollar/Yen ($USDJPY) weighs 13.6%, Dollar/Pound ($USDGBP) is 11.9%, Dollar/Canadian ($USDCD) is 9.1% and Dollar/Swiss ($USDCHF) is 3.6%. Clearly, the Dollar/Euro relationship...
READ MORE
MEMBERS ONLY
Broad Selling in Nasdaq 100 - Biotechs Buck Selling - TLT Turns Up - Five Stocks
by Arthur Hill,
Chief Technical Strategist, TrendInvestorPro.com
.... Small-caps Extend to New Highs
.... Broad Selling in the Nasdaq 100
.... XBI and IBB Edge Higher
.... COPX and JJC Correct within Uptrends
.... TLT Turns Up within Uptrend
.... Charts to Watch: DAL, CB, LEN, RMD, SBAC ....
Small-caps Extend to New Highs
The S&P SmallCap iShares (IJR) and the Russell...
READ MORE
MEMBERS ONLY
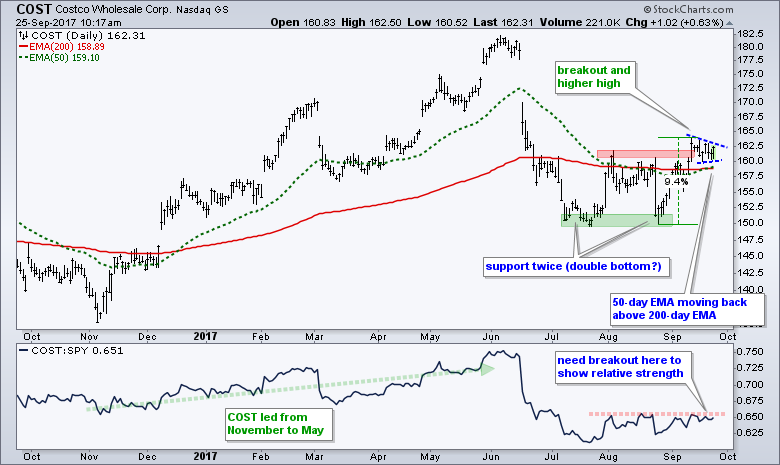
Costco Forms Bullish Pennant Near Breakout
by Arthur Hill,
Chief Technical Strategist, TrendInvestorPro.com
Costco (COST) fell on hard times this summer with a plunge from the low 180s to the 150 area. Despite this gap and sharp decline, the stock firmed in July-August and surged above the red resistance zone in September. Notice that the stock found support in the 150 area with...
READ MORE
MEMBERS ONLY
Weekly Market Review & Outlook (w/ Video) - An Abrupt Change in Leadership
by Arthur Hill,
Chief Technical Strategist, TrendInvestorPro.com
.... An Abrupt Change in Leadership
.... News and No Man's Land
.... New High Parade Continues
.... Uptrends are Slowing, Not Reversing
.... A Strong Surge for Small-caps
.... Finance, Tech, Industrials and Materials Lead
.... Healthcare and Utilities Take a Dip
.... Consumer Discretionary Gets Anemic Bounce
.... Energy SPDR Breaks Summer Highs
.... Strong Selling...
READ MORE
MEMBERS ONLY
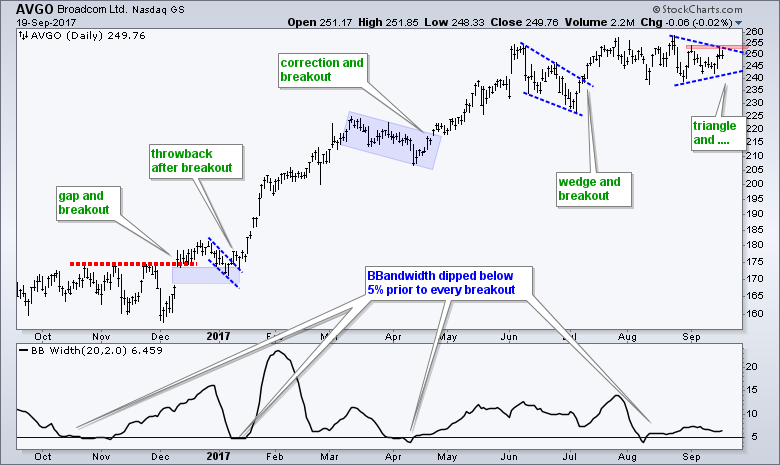
Broadcom Consolidates within Uptrend $AVGO
by Arthur Hill,
Chief Technical Strategist, TrendInvestorPro.com
This is my third straight DITC posting with a semiconductor stock. The first featured Texas Instruments forming a cup-with-handle pattern and the second featured Intel with a surge towards long-term resistance. Today's chart focuses on Broadcom, which is actually lagging the S&P 500 SPDR over the...
READ MORE
MEMBERS ONLY
Materials, Industrials and Tech Lead New High List - GOOGL, AMZN and FB Weigh - Five Stock Setups
by Arthur Hill,
Chief Technical Strategist, TrendInvestorPro.com
.... 52-week Highs Reflect Broad Strength
.... Materials, Industrials and Technology Lead New High List
.... Alphabet, Amazon and Facebook are Dragging
.... CSCO Hits Multi-Month High
.... Fiserv Turns Up after Pullback
.... AMD Bounces off Key Retracement
.... CHD and CL Start Turning UP
.... How to Handle Overvalued Stocks ....
52-week Highs Reflect Broad Strength
Large-caps,...
READ MORE
MEMBERS ONLY
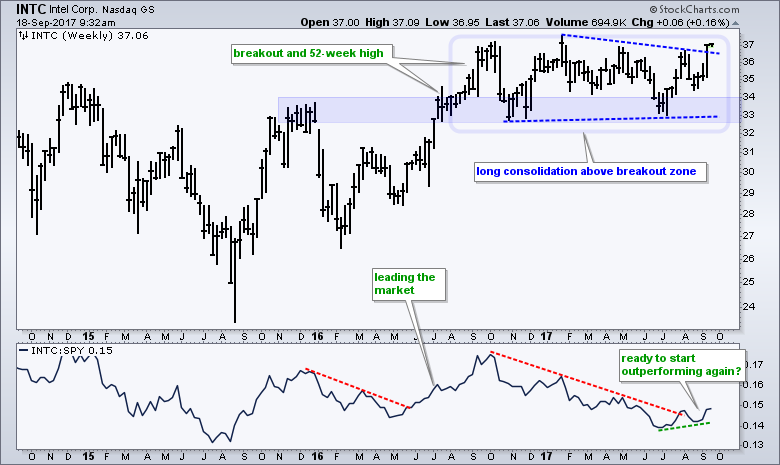
Intel Goes for a Big Breakout $INTC
by Arthur Hill,
Chief Technical Strategist, TrendInvestorPro.com
Some sixty stocks in the S&P 500 were up 5% or more last week, and Intel was one of them. Intel's importance seems to have diminished over the years, but it is still an industry gorilla that accounts for around 11% of the Semiconductor ETF (SMH)...
READ MORE
MEMBERS ONLY
What Does a Trend Line Really Tell Us?
by Arthur Hill,
Chief Technical Strategist, TrendInvestorPro.com
We all know what a trend line is, but does a trend line actually dictate the trend? In other words, does a trend line break actually signal a trend reversal? Or, is a trend line break telling us something else? We cannot use a tool unless we fully understand it...
READ MORE
MEMBERS ONLY
Weekly Market Review & Outlook (w/video) - Small-caps and Energy Lead Late Summer Rally
by Arthur Hill,
Chief Technical Strategist, TrendInvestorPro.com
.... Small-caps Extend Newfound Leadership Role
.... AD Lines Hit New Highs
.... RSI Notches another Overbought Reading for SPY
.... IJR Continues to Grind Higher
.... Tech, Industrials, Healthcare and Materials Lead
.... XLI and XLB Extend after Breakouts
.... XLF Fully Recovers with Flag Line Break
.... XLY Puts Double Top on the Back Burner
.... XLE...
READ MORE
MEMBERS ONLY
RSI(5) versus RSI(10) - Working with Zones, Alerts and Price Action
by Arthur Hill,
Chief Technical Strategist, TrendInvestorPro.com
Price Characteristics and Indicator Effectiveness
There is NO SUCH thing as the perfect indicator. Further more, even if you find the almost perfect indicator, there is no such thing as the optimal setting. A 50-day SMA works great for one stock and lousy for another. 14-day RSI nails the oversold...
READ MORE
MEMBERS ONLY
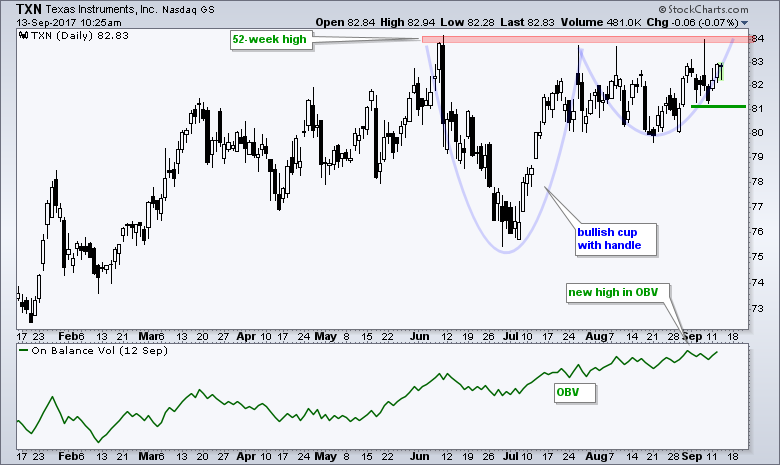
Texas Instruments Traces out Bullish Continuation Pattern $TXN
by Arthur Hill,
Chief Technical Strategist, TrendInvestorPro.com
Texas Instruments (TXN), the semiconductor behemoth, formed a bullish cup-with-handle pattern and a classic volume-based indicator points to a breakout. The chart shows TXN hitting resistance in the 83-84 area from June to September (red zone). In between these resistance points, the stock dipped to the 76 area in June...
READ MORE
MEMBERS ONLY
TDAmeritrade and Etrade Lead Broker-Dealer ETF - Delta and American Lead Airlines
by Arthur Hill,
Chief Technical Strategist, TrendInvestorPro.com
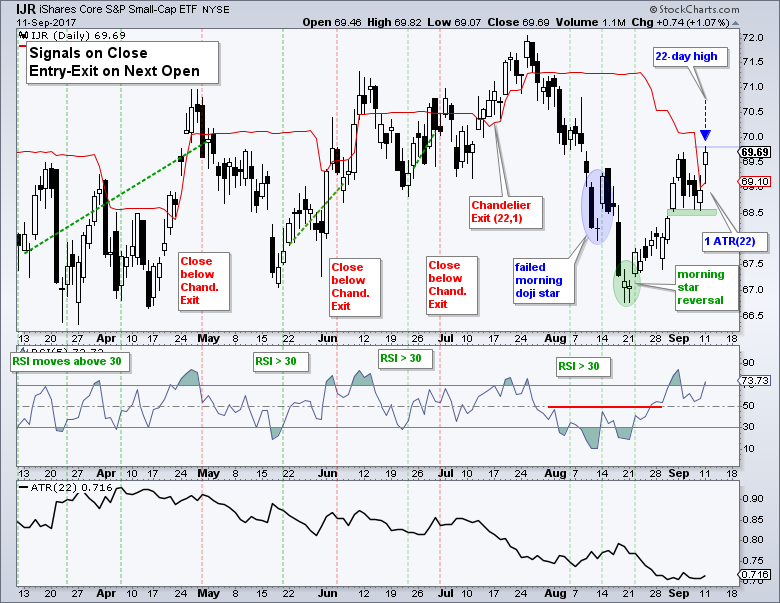
.... Sticking with a Strategy (IJR)
.... Finance Sector Rebounds
.... Broker-Dealer ETF Holds Up Better
.... TD Ameritrade and Etrade Lead Brokers
.... Industrials Sector Breaks Out
.... Airlines Finally Perk Up
.... Delta and American Lead Bounce
.... Cisco, Teradata and Skyworks ....
Sticking with a Strategy (IJR)
Sticking with a strategy is perhaps the hardest part...
READ MORE
MEMBERS ONLY
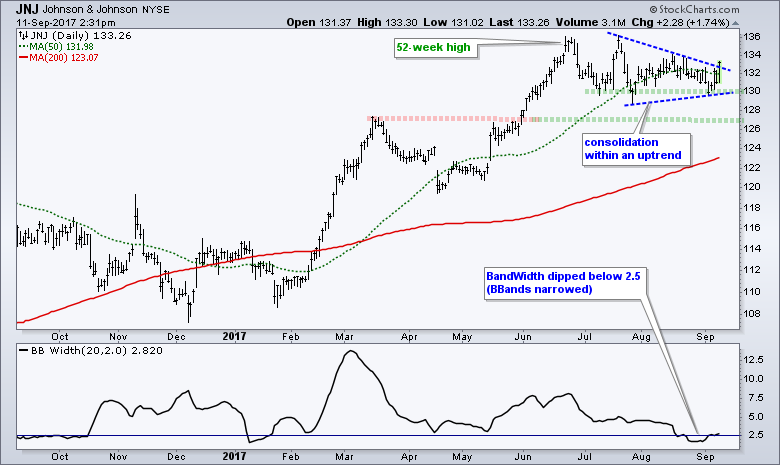
Volatility Contracts as J&J Consolidates
by Arthur Hill,
Chief Technical Strategist, TrendInvestorPro.com
Johnson & Johnson (JNJ) appears to be ending its consolidation period with a surge and triangle breakout over the last three days. Overall, the stock is in a long-term uptrend because it hit a 52-week high in June and remains well above the rising 200-day moving average. JNJ consolidated after...
READ MORE
MEMBERS ONLY
Weekly Market Review & Outlook - New Highs Dwindle and Banks Fall Hard
by Arthur Hill,
Chief Technical Strategist, TrendInvestorPro.com
.... Large-techs Tower over Small-caps
.... September is a Coin Flip
.... High-Low Percent Indicators are Dragging
.... Fewer than 50% of Small-caps Above 200-day EMA
.... SPY and QQQ Hold Flag Breakouts
.... Monitoring the Upswing in IJR
.... Finance Weighs as Healthcare Leads
.... The Three Leaders (XLV, XLK and XLU)
.... XLB Breaks Out as XLI...
READ MORE
MEMBERS ONLY
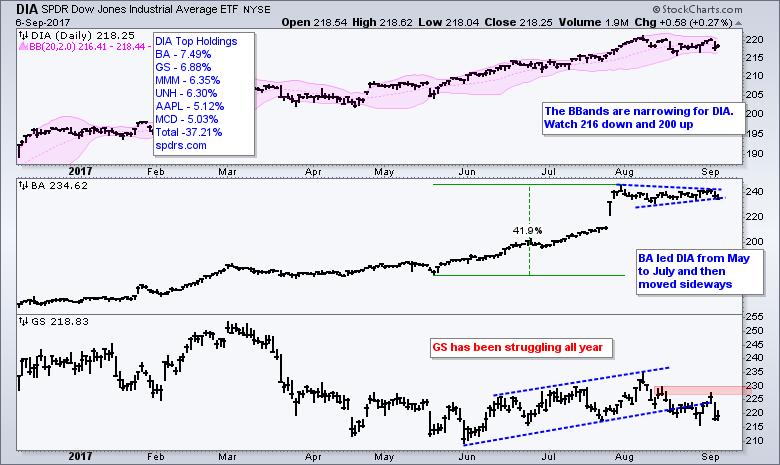
Bands Contract for DIA - QQQ Holds Breakout - Charts for Top 5 QQQ Stocks and More....
by Arthur Hill,
Chief Technical Strategist, TrendInvestorPro.com
.... Bollinger Bands Contract for Dow SPDR (plus BA and GS)
.... QQQ Holds Breakout Zone
.... Setting a Pullback Target for Apple
.... A Boring Uptrend for Microsoft
.... Facebook Breaks Wedge Line
.... Alphabet and Amazon are the Weakest Links
.... Mea Culpa on Intel and Target
.... Charts Worth Watching (CY, PFE, AMGN, AGU, POT)...
READ MORE
MEMBERS ONLY
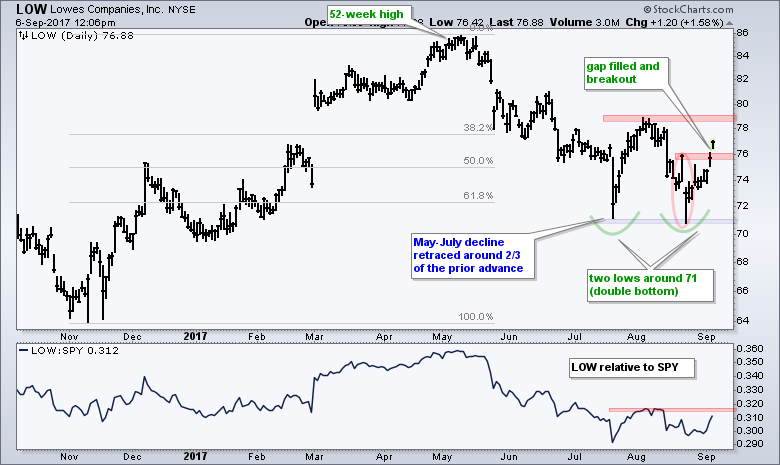
Lowes Holds Support and Forms Potential Reversal Pattern
by Arthur Hill,
Chief Technical Strategist, TrendInvestorPro.com
Lowes (LOW) successfully tested the 71 area twice in July-August and surged above short-term resistance this week. At the risk of jumping the pattern, the two semi circles show a double bottom taking shape and a break above the August high would confirm this bullish reversal pattern. Also notice that...
READ MORE
MEMBERS ONLY
10-yr Yield Tests June Low - Correlations to the 10-yr Yield - A Breakout for Brent
by Arthur Hill,
Chief Technical Strategist, TrendInvestorPro.com
.... Small-caps Take the Short-term Lead
.... But Small-caps are Still Lagging Long-term
.... IJR Surges Toward Chandelier Exit
.... 10-yr T-Yield Firms Near June Lows
.... Correlations with the 10-yr Yield
.... Brent Stronger that WTI
.... Two Bearish Stocks and One Bull ....
There was a shift in leadership over the last two weeks with small-caps...
READ MORE
MEMBERS ONLY
Are Australian Stocks Flat or Trending Higher? - Weak USD Boosts Australian ETF
by Arthur Hill,
Chief Technical Strategist, TrendInvestorPro.com
The Australia All Ords Index ($AORD) is trading well below its April-May highs and stuck in a long and tight consolidation. In contrast, the Australian iShares (EWA) hit a 52-week high in late July and remains close to this high. Which one are we to believe? Are Australian stocks lagging...
READ MORE
MEMBERS ONLY
Weekly Market Review & Outlook (w/ Video) - Tech and Healthcare Lead as Finance Lags
by Arthur Hill,
Chief Technical Strategist, TrendInvestorPro.com
.... QQQ Leads with Breakout and New High
.... Higher Highs > Weakening Momentum
.... Small-caps Leading for Two Weeks
.... Tech, Utes and Healthcare Lead Sector SPDRs
.... Materials and Industrials Break Flag Lines
.... Consumer Discret. SPDR Bounces off Support
.... Financials Still Dragging
.... Regional Bank SPDR Tests 2017 Lows
.... Consumer Staples Show Internal Weakness...
READ MORE
MEMBERS ONLY
Meet the New Boss, Same as the Old Boss - Tech ETFs Still Leading - Plus 15 Stocks
by Arthur Hill,
Chief Technical Strategist, TrendInvestorPro.com
.... Meet the New Boss, Same as the Old Boss
.... Software Leads Tech with 52-week High
.... Flag Breakouts in Cloud and Internet ETFs
.... Networking and Cyber Security Join the Surge
.... Five Cyber Security Stocks (QLYS, PFPT, FTNT, PANW, FEYE)
.... SOXX Goes for Breakout as XSD Surges off Support
.... Five Semiconductor Stocks...
READ MORE
MEMBERS ONLY
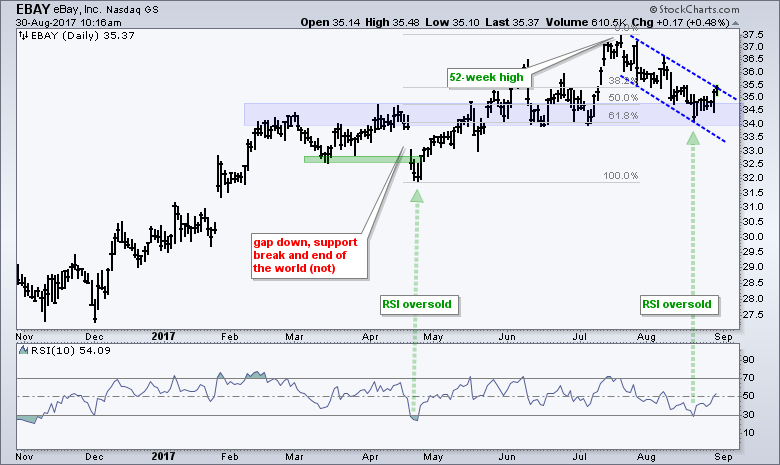
Ebay Reverses Near Key Retracement
by Arthur Hill,
Chief Technical Strategist, TrendInvestorPro.com
EBAY shows signs that the correction is ending and the bigger uptrend is resuming. First, the long-term trend is up because the stock hit a 52-week high in July. The stock then corrected with a move back to a support zone around 34-34.5. Notice that broken resistance and the...
READ MORE
MEMBERS ONLY
Measuring the Risk Appetite - 4 Inside Days and No Follow Thru - 6 Stock Charts
by Arthur Hill,
Chief Technical Strategist, TrendInvestorPro.com
.... Small-caps Lead Five Day Bounce
.... Stocks are Underperforming Bonds in August
.... Four Inside Days and No Follow Thru
.... Chandelier Exit Falls for IJR
.... 10 Stocks and A Mixed Bag over the Past Week
.... Amazon and Google Tests Support as Facebook Corrects
.... Intel Lags in 2017
.... Discover Financial Breaks Wedge Line...
READ MORE
MEMBERS ONLY
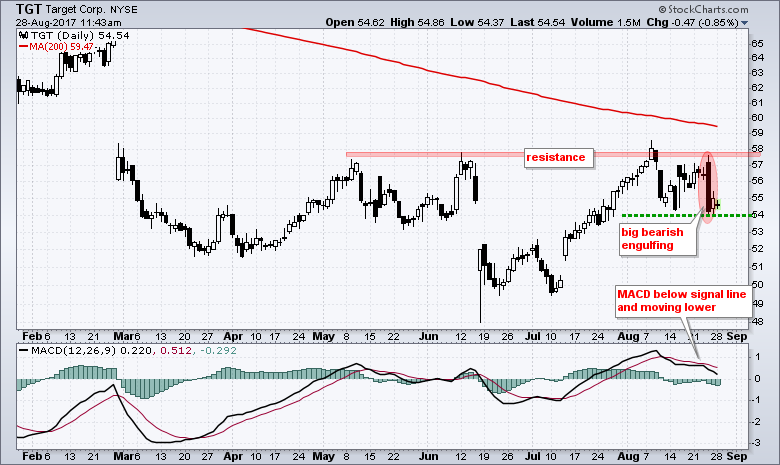
Target Reverses at Resistance with Big Engulfing Pattern
by Arthur Hill,
Chief Technical Strategist, TrendInvestorPro.com
The Retail SPDR (XRT) is one of the worst performing industry group ETFs and Target (TGT) is one of the downside leaders. Even though the stock is up sharply since early July, it is down over 20% year-to-date and seriously lagging the broader market in 2017. Note that SPY is...
READ MORE
MEMBERS ONLY
Weekly Market Review & Outlook (w/ Video) - When is Volatility a Problem? - Energy Stocks Buck Oil
by Arthur Hill,
Chief Technical Strategist, TrendInvestorPro.com
.... Volatile, but not that Volatile
.... When Does Volatility Become a Problem?
.... SPY and QQQ Correct with Flag Patterns
.... IJR Hits Prior Reversal Zone
.... Bull Flags working in XLI, XLV, XLF and XLB
.... XLY Toys with Double Top Support
.... EW Consumer Discretionary ETF Breaks Down
.... Consumer Staples Break Down
.... Bottom Fishing...
READ MORE
MEMBERS ONLY
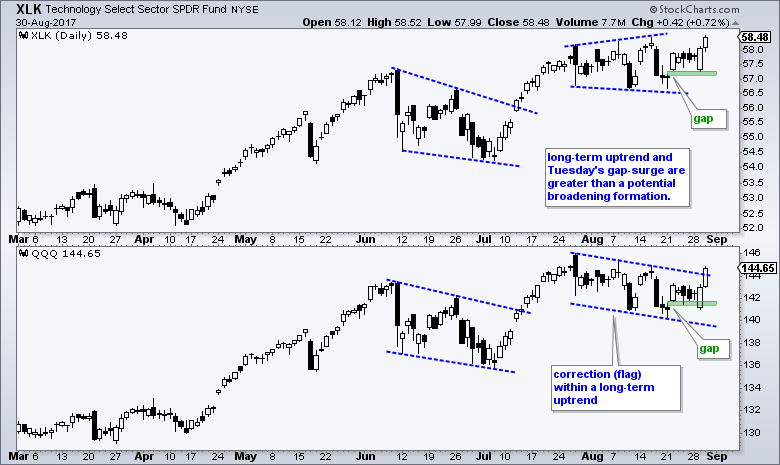
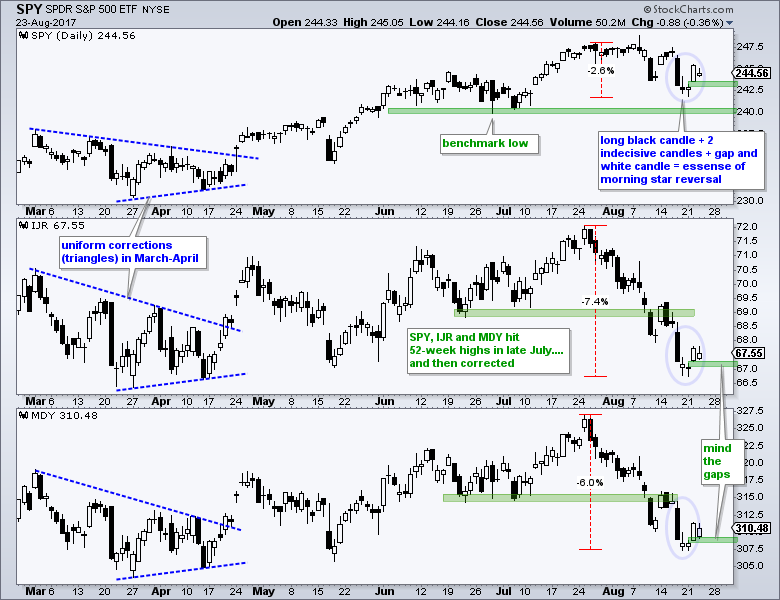
Minding the Gaps in QQQ and SPY - Plus Bullish Setups in Tech-related ETF and Stocks
by Arthur Hill,
Chief Technical Strategist, TrendInvestorPro.com
.... Minding the Gaps (SPY, MDY, IJR)
.... QQQ and XLK are Still Leading
.... Cloud Computer and Internet ETFs Form Flags
.... HACK Hits Potential Reversal Zone
.... SOXX Coils after New High
.... Biotech ETFs Firm in Potential Reversal Zones
.... XME Turns after Small Correction (plus SLX)
.... International Steel versus US Steel
.... Silver Goes...
READ MORE
MEMBERS ONLY
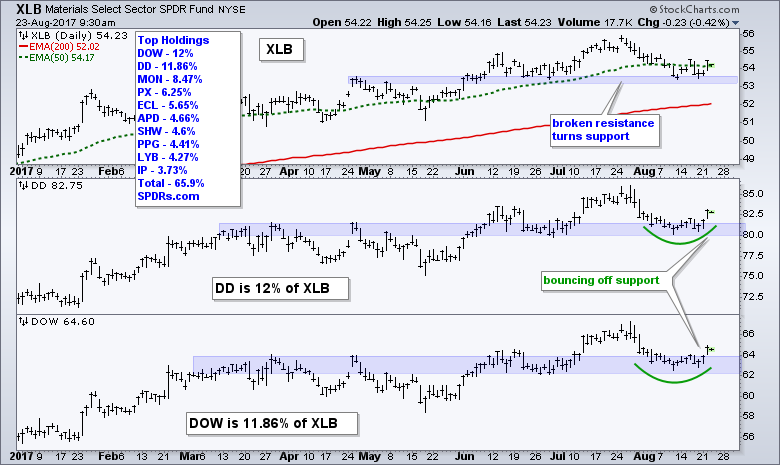
Dow and DuPont Lead XLB, and Threaten to Take Over the Sector
by Arthur Hill,
Chief Technical Strategist, TrendInvestorPro.com
The sector SPDRs are weighted by market-cap and this means the biggest stocks carry the most weight. The Materials SPDR (XLB), for example, is dominated by Dow Chemical (11.86%) and DuPont (12%). These two behemoths are poised to merge and the combined company will clearly dominate XLB going forward....
READ MORE
MEMBERS ONLY
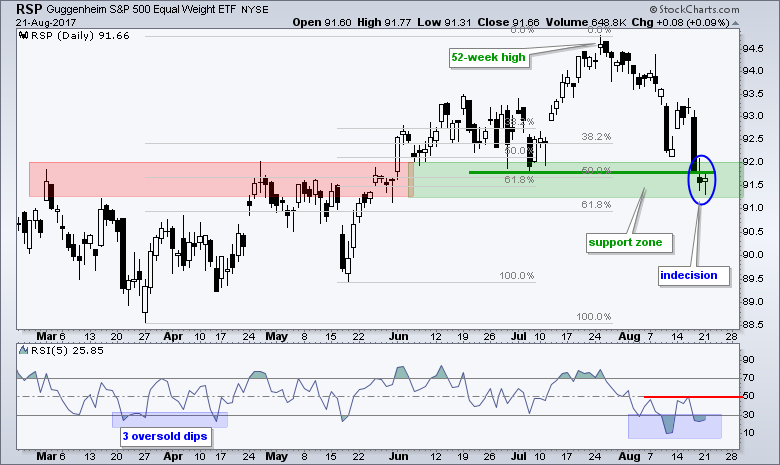
S&P 500, Five Percent and the 200-day SMA - Plus Scanning for Relative Strength within Sectors
by Arthur Hill,
Chief Technical Strategist, TrendInvestorPro.com
.... EW S&P 500 ETF Stalls in Potential Reversal Zone
.... Checking the Chandelier Exit on IJR
.... S&P 500, Five Percent and the 200-day
.... Scanning for Short-term Relative Strength
.... Scanning within a Sector
.... Bottom Fishing for the Long-term
.... PKI Firms at a Key Retracement
.... Small-cap Breadth, Large-cap Leadership,...
READ MORE
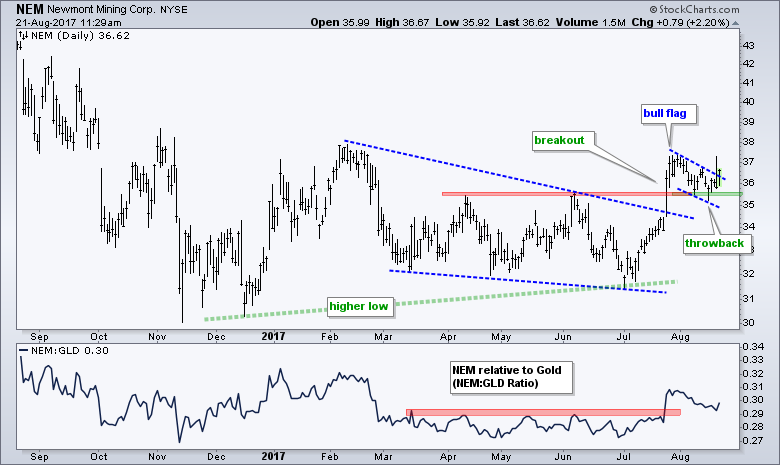
MEMBERS ONLY
Newmont Holds Breakout Zone with a Bounce
by Arthur Hill,
Chief Technical Strategist, TrendInvestorPro.com
Newmont Mining (NEM) is one of the bigger gold players and its performance is tied to the price of gold, which is challenging resistance. Note that the Gold SPDR (GLD) has yet to break above its April-June highs, but Newmont is starting to outperform bullion with a break above these...
READ MORE