MEMBERS ONLY
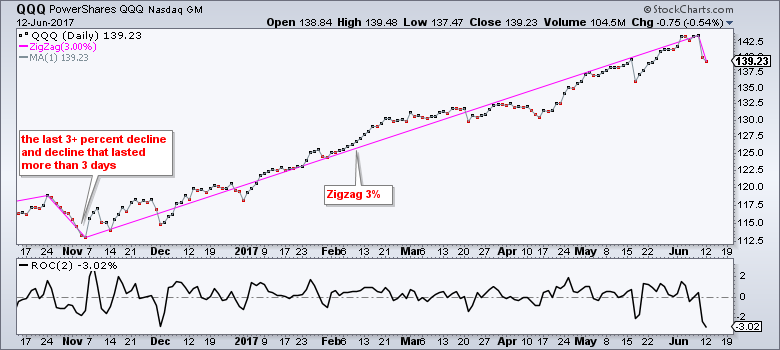
QQQ Takes a Hit, Two Leading EW Sectors and Eight Stock Setups
by Arthur Hill,
Chief Technical Strategist, TrendInvestorPro.com
.... QQQ Suffers Biggest Loss since early November
.... EW Industrials Sector Nears New High
.... Cummins and JetBlue Lead Industrials
.... New Highs for EW Materials ETF and Cemex
.... CA Forms Out-of-Place Ascending Triangle
.... Cypress Semi Falls Back into Correction
.... Double Top and Death Cross for F5, but
.... Zimmer Biomet Fills Gap with...
READ MORE
MEMBERS ONLY
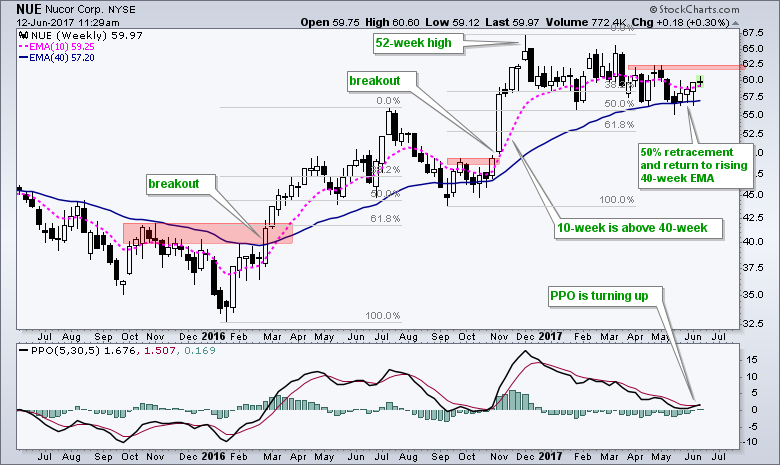
NUE Shows Early Signs of Ending its Correction $NUE
by Arthur Hill,
Chief Technical Strategist, TrendInvestorPro.com
Nucor (NUE) is flat year-to-date and lagging the S&P 500, but the bigger trend is up and short-term momentum is turning up. The bigger trend is up because Nucor surged to a 52-week high in early December and the 10-week EMA remains above the 40-week EMA, even after...
READ MORE
MEMBERS ONLY
Weekly Market Review & Outlook (w/ Video) - Small-caps, Finance and Miners Bid to End Corrections
by Arthur Hill,
Chief Technical Strategist, TrendInvestorPro.com
.... Bullish until it Ain't (seasonality)
.... SPY Extend Higher
.... Small-caps Challenge for Leadership
.... Finance Sector Bids to End Correction
.... Insurance Leads and Regionals Play Catch Up
.... Materials Sector Hits New High
.... XME Makes a Bid to End Correction (plus steel)
.... Copper and Aluminum Bid to End Corrections
.... Four Aluminum...
READ MORE
MEMBERS ONLY
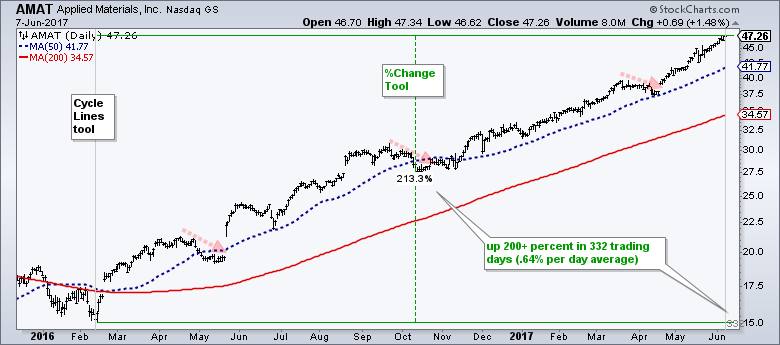
Determining Trend Direction and Trend Strength with Simple Indicators - Plus Scan Code
by Arthur Hill,
Chief Technical Strategist, TrendInvestorPro.com
.... Finding Strong and Persistent Uptrends
.... Understanding Your Indicators
.... A Simple Trend Following
.... Measuring Trend Strength
.... Focus on a Failure
.... Strong Uptrend Scan Code
.... Current State of the Market ....
Finding Strong and Persistent Uptrends
There are some incredibly strong and persistent uptrends in the market right now and I would like...
READ MORE
MEMBERS ONLY
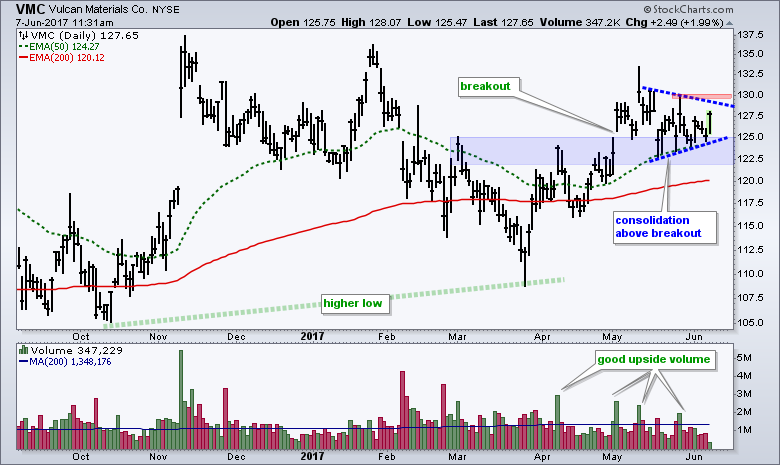
Vulcan Materials Consolidates above Breakout Zone $VMC
by Arthur Hill,
Chief Technical Strategist, TrendInvestorPro.com
After struggling the first three months of the year, Vulcan Materials (VMC) is showing signs of life since late March with good upside volume and a breakout in early May. Notice that the stock broke above a resistance zone in the 122-125 area and this zone turns into support. The...
READ MORE
MEMBERS ONLY
Using EMA Ribbons to Define Strong Trends - Gold Leaves the Gold Miners Behind
by Arthur Hill,
Chief Technical Strategist, TrendInvestorPro.com
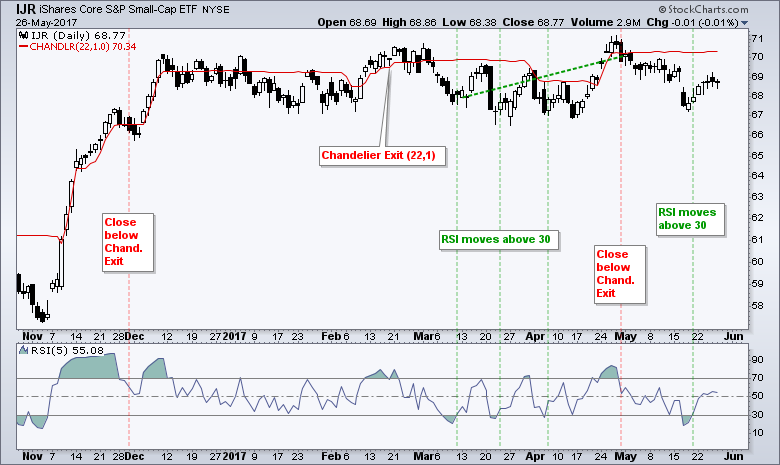
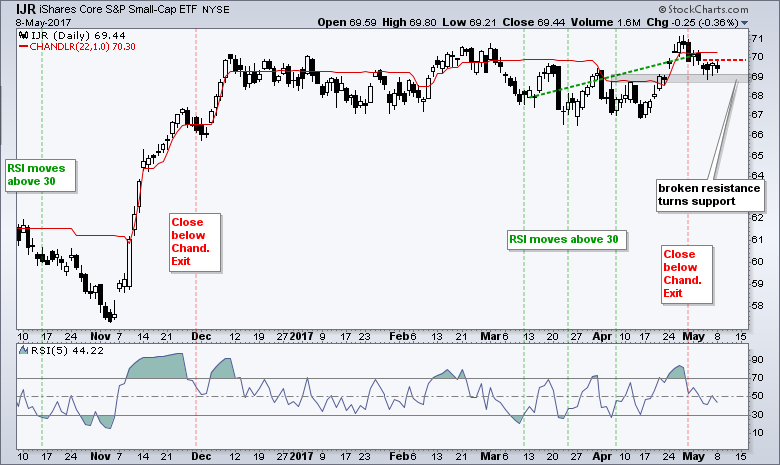
.... IJR Mean-Reversion Trade Exit
.... Gold Rises without the Gold Miners
.... Regional Banks Continue to Struggle
.... Using an EMA Ribbon to Define the Trend (MA)
.... Three Failed Setups (NTAP, STX, BMY)
.... Hawaiian Holdings Bounces off Breakout
.... Bullish Setups for MLM and CSRA
.... A Bearish Setup for IRM ....
IJR Mean-Reversion Trade Exit...
READ MORE
MEMBERS ONLY
UPS Goes for a Breakout
by Arthur Hill,
Chief Technical Strategist, TrendInvestorPro.com
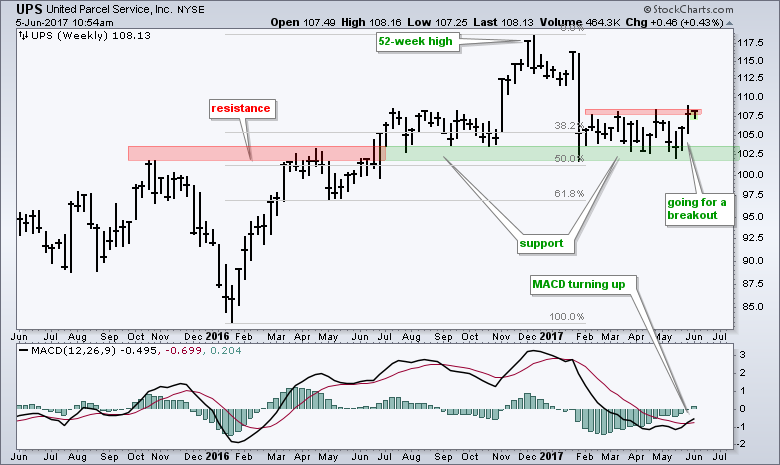
United Parcel Service (UPS) has been lagging the broader market this year, but may be turning around as it bounces off support and momentum turns up. UPS surged to a 52-week high in December and then retraced 50% with a sharp decline in January. The stock managed to firm near...
READ MORE
MEMBERS ONLY
The Most Important Assumption in Trading
by Arthur Hill,
Chief Technical Strategist, TrendInvestorPro.com
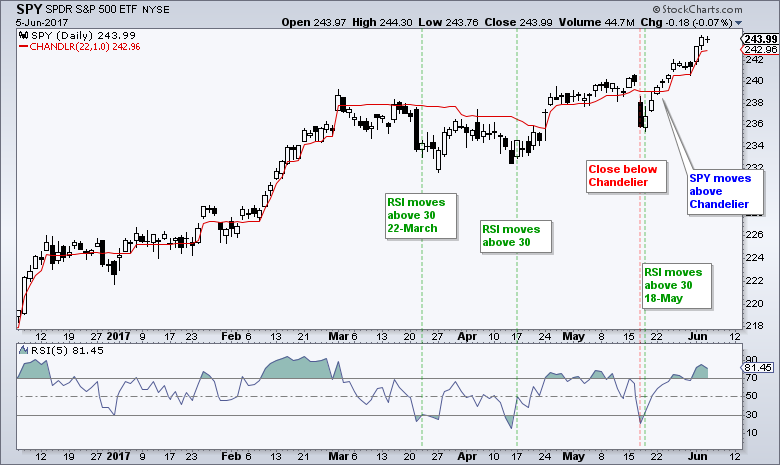
Trading and investing are all about putting the odds in your favor, and chartists can increase their odds with one key assumption: the trend will remain in force until proven otherwise. Coming from the writings of Charles Dow, this assumption means a trend in motion is expected to stay in...
READ MORE
MEMBERS ONLY
Weekly Market Review & Outlook with Video - Participation is Broad Enough as New Highs Expand
by Arthur Hill,
Chief Technical Strategist, TrendInvestorPro.com
.... New Highs Expand in Large-caps and Mid-caps
.... EW S&P 500 Reflects Broad Strength
.... SPY Hits another New High
.... QQQ Extends its "Overbought" Streak
.... Small-caps and Mid-caps Perk Up
.... New highs in XLY, XLK, XLI, XLV, XLU and XLP
.... Good Weekend Stocks Lead XLY to New High...
READ MORE
MEMBERS ONLY
Small-caps Rebound - Plus A Big Chemical Breakout, an Industrial Breakout, Four Tech Corrections and Two Big Pharmas Perk Up
by Arthur Hill,
Chief Technical Strategist, TrendInvestorPro.com
.... Small-caps Bounce Back from the Abyss
.... Lots of Winners and Losers Out There
.... A Big Chemical Stock Breaking Flag Resistance
.... An Industrial Stock Bouncing off Support
.... Four Tech Stocks with Small Corrections
.... Big Pharma Stocks Perk Up
.... Three Miscellaneous Stocks: FBHS, SYY and XRAY....
Small-caps Bounce Back from the Abyss...
READ MORE
MEMBERS ONLY
Russian Index Forms Bearish Continuation Pattern
by Arthur Hill,
Chief Technical Strategist, TrendInvestorPro.com
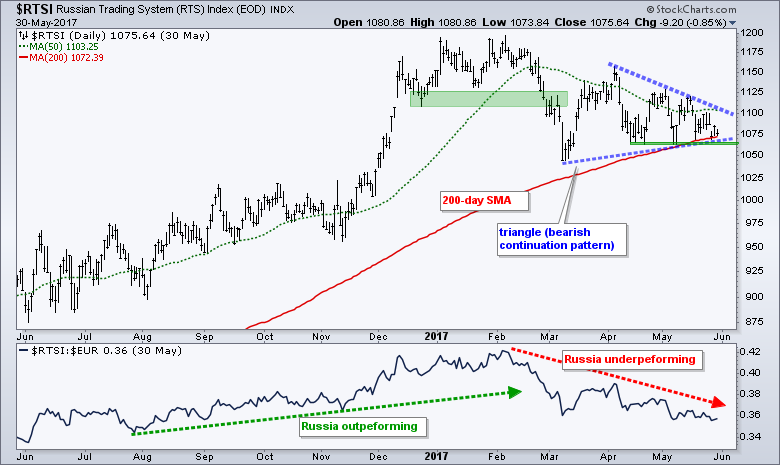
The Russian Trading System Index ($RTSI) is struggling this year and down around 6.5% year-to-date. In contrast, the S&P 500 is up over 7% year-to-date and the Eurotop 100 ($EUR) is up around 6.5%. In addition to relative weakness, the index sports a bearish continuation pattern...
READ MORE
MEMBERS ONLY
Mean-Reversion for IJR - Plus China, Asia, Aluminum, Railroads and Six Stocks to Watch
by Arthur Hill,
Chief Technical Strategist, TrendInvestorPro.com
.... IJR Mean-Reversion Trade in Play
.... Marking Upswing Support for MDY
.... Chinese Stocks Spring to Life
.... Asian Index ETFs Show Broad Strength
.... Finding Stocks within an Industry Group
.... Aluminum Stocks Look Poised for Upturn
.... Railroad Stocks Lead with Big Gains
.... Stocks to Watch: MON, FLIR, CY, PANW, PAYX, WWW ....
IJR Mean-Reversion...
READ MORE
MEMBERS ONLY
Video - Weekly Market Review & Outlook - Still a Large-cap World
by Arthur Hill,
Chief Technical Strategist, TrendInvestorPro.com
.... Stocks Bounce without Biotechs
.... Breadth Remains Bullish, but Weakening
.... Nasdaq Stocks Support S&P 500
.... QQQ Hits Yet Another New High
.... Small-caps Not Feeling the Love
.... Sector Balance Clearly Bullish
.... %Above 200-day Ranking for Sectors
.... XLU, XLP, XLI and XLK Lead with Fresh Highs
.... TLT Holds Surge and Breakout...
READ MORE
MEMBERS ONLY
SystemTrader - Trailing Stops versus Profit Targets for a Moving Average Crossover System
by Arthur Hill,
Chief Technical Strategist, TrendInvestorPro.com
.... Do stops really help?
.... Setting the Benchmark
.... System Ground Rules
.... Consulting, Software and Data
.... Testing Some Basic EMA Crossovers
.... Base System and Sample Charts
.... Trailing Stops, Profit Targets and Both
.... Backtest Results
.... Testing a Percent Profit Target
.... Conclusions and Caveat Emptor
.... Scan Code ....
Do stops really help?
We have all...
READ MORE
MEMBERS ONLY
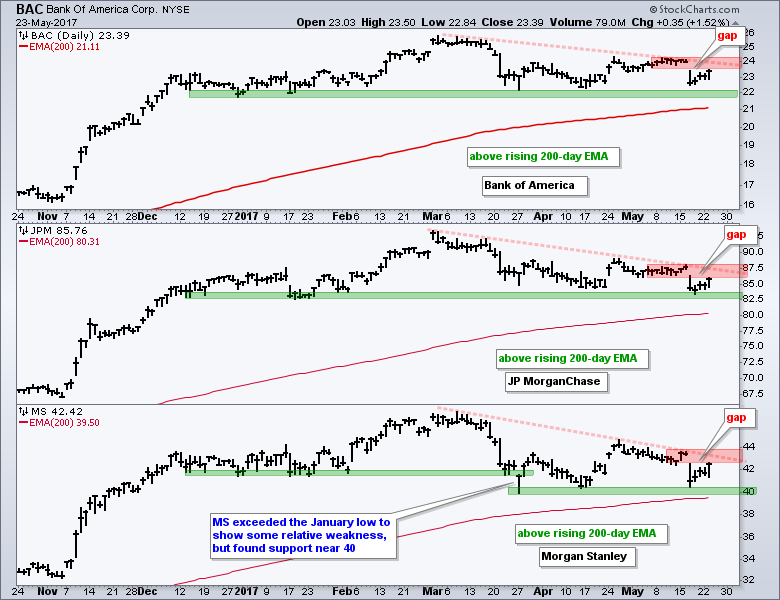
Minding Three Gaps for Three Big Banks
by Arthur Hill,
Chief Technical Strategist, TrendInvestorPro.com
Banking stocks bounced on Tuesday as the 20+ YR T-Bond ETF (TLT) fell and the 10-yr T-Yield ($TNX) moved higher. These bounces reinforce the positive correlation with TLT and the negative correlation with $TNX. The chart below shows three big banks in long-term uptrends and six month stalls. Technically, Bank...
READ MORE
MEMBERS ONLY
Five Sectors Lead New High List - 10 Bullish Stock Setups
by Arthur Hill,
Chief Technical Strategist, TrendInvestorPro.com
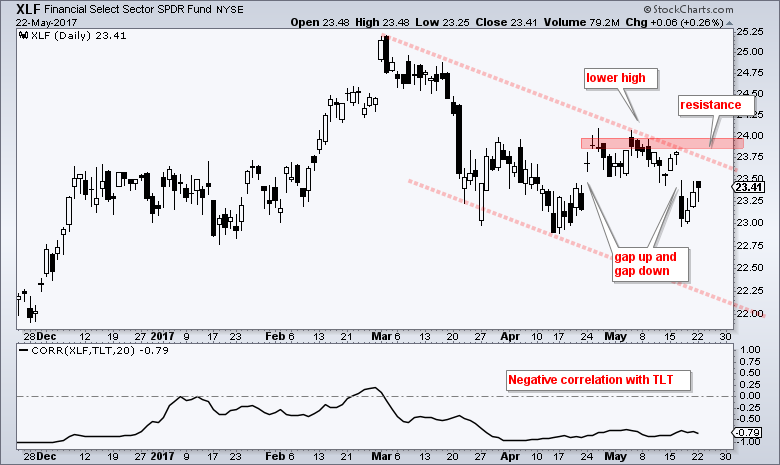
.... XLF Lags as TLT Surges
.... A Classic Corrective Sequence for KRE
.... TLT Holds Breakout and Nears 200-day
.... T-bond Correlations in Play
.... Large-caps Continue to Lead New High List
.... Utilities and Staples Lead Sector New High List
.... Charts: MMC, CB, TRV, MDLZ, KHC, DPS, CMCSA, AAL, JBLU, MDT ....
XLF Lags as...
READ MORE
MEMBERS ONLY
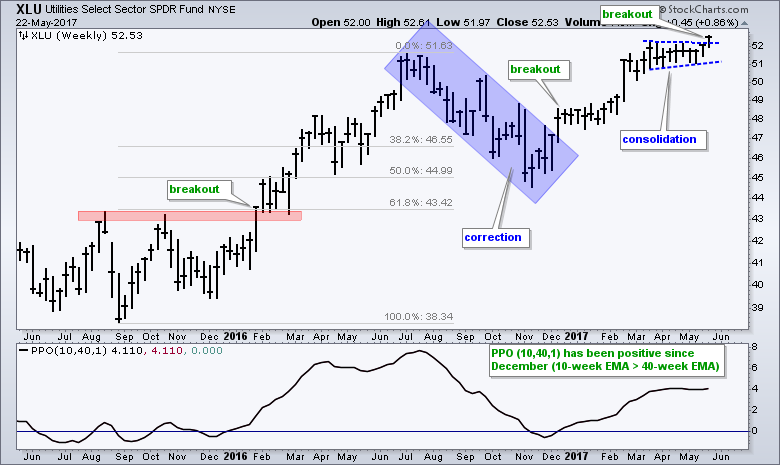
Utilities Take the Lead with a Triangle Breakout
by Arthur Hill,
Chief Technical Strategist, TrendInvestorPro.com
The Utilities SPDR (XLU) is clearly one of the leading sectors in 2017 because it is trading at its highest level of the year. XLU, by the way, is the only sector SPDR that hit a year-to-date high on Monday. The chart shows XLU correcting into November 2016, breaking out...
READ MORE
MEMBERS ONLY
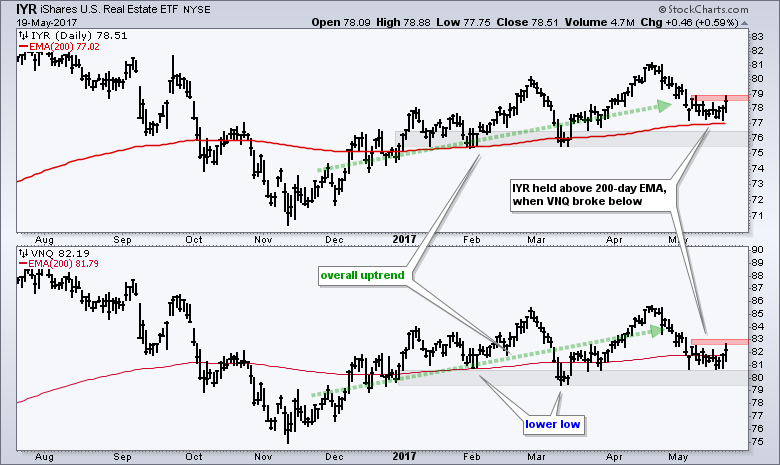
Broad REIT ETFs Hit Interesting Junctures, but Hotel and Retail REITs Weigh
by Arthur Hill,
Chief Technical Strategist, TrendInvestorPro.com
The REIT iShares (IYR) and the Vanguard REIT ETF (VNQ) are at interesting junctures because they corrected within an uptrend. Even though both are at potential reversal zones, chartists should be careful because retail REITs and hotel REITs are weak spots within the REIT universe. The chart below shows IYR...
READ MORE
MEMBERS ONLY
Video - Weekly Market Review & Outlook - Correction Evidence Builds
by Arthur Hill,
Chief Technical Strategist, TrendInvestorPro.com
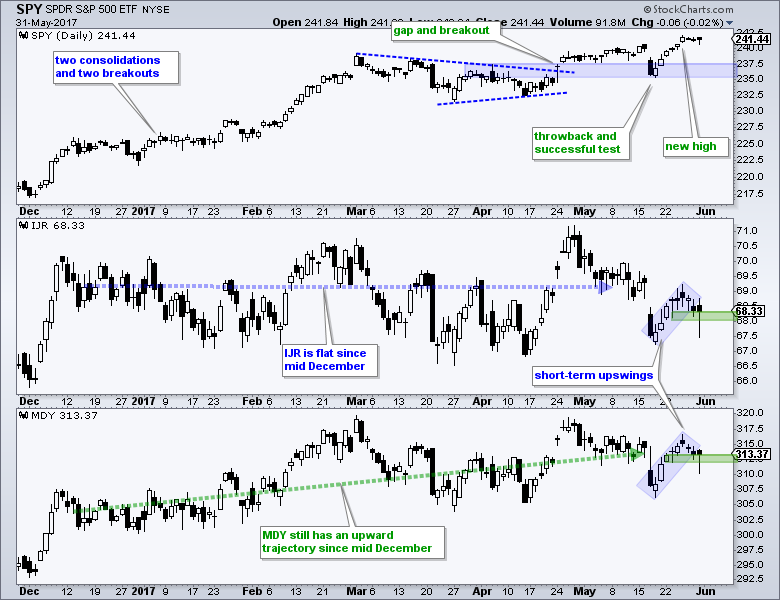
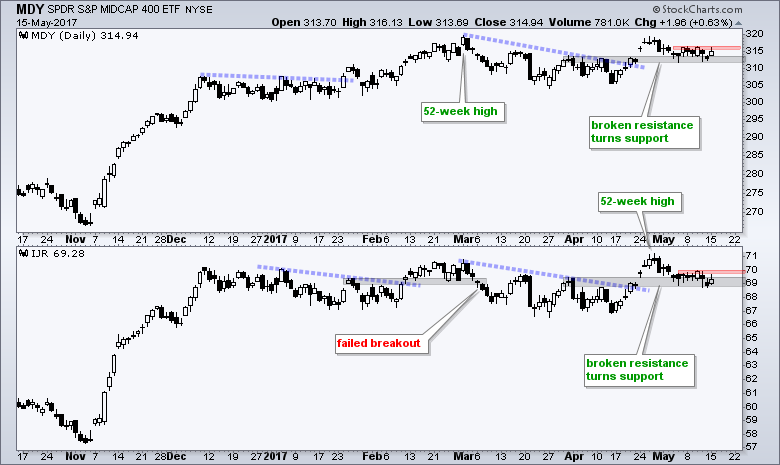
The stock market has been in correction mode since early March when looking at the EW S&P 500 ETF (RSP) and S&P MidCap SPDR (MDY). Together, these two ETFs represent 900 stocks and cover the majority of the market, and they have been flat since March...
READ MORE
MEMBERS ONLY
Weekly Market Review & Outlook - A Stealthy Correction
by Arthur Hill,
Chief Technical Strategist, TrendInvestorPro.com
.... The Stealthy Looking Correction
.... AD Volume Lines Reflect Corrective Period
.... High-Low Lines Have Yet to Turn Down
.... Percent Above 200-day EMA Deteriorates Further
.... SPY Gaps Down like its September 2016
.... Setting a Correction Zone for QQQ
.... IJR: Breakout Failed, but Short-term Oversold
.... Finance and Industrials Gap Lower
.... Low Correlations are...
READ MORE
MEMBERS ONLY
Setting Up a Stock-Picker's ChartList for a Possible Correction - S&P 500 Mimics September
by Arthur Hill,
Chief Technical Strategist, TrendInvestorPro.com
.... Passive versus Too Active
.... Using the Inspect Feature on SharpCharts
.... The Good, the Bad and the Neutral
.... Scan Code to Measure Performance
.... Building a Correction ChartList
.... S&P 500 Breadth, Momentum and Correction Target ....
The active versus passive debate has been raging for some time now. On one side...
READ MORE
MEMBERS ONLY
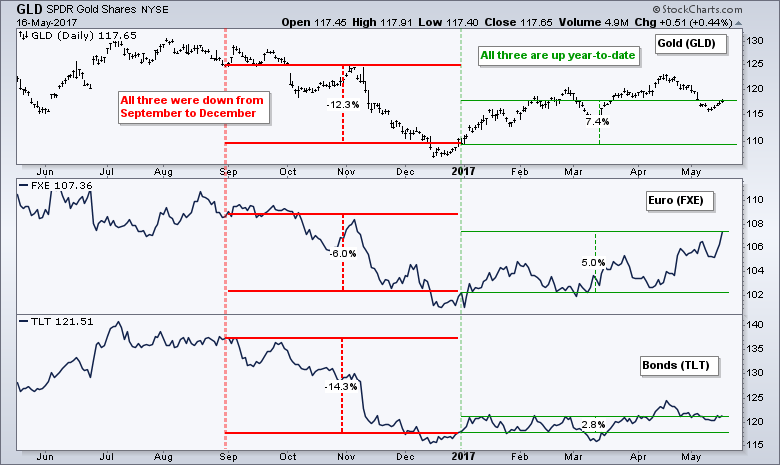
Gold, Euro and Bonds: The Three Inter-market Amigos
by Arthur Hill,
Chief Technical Strategist, TrendInvestorPro.com
The Gold SPDR (GLD), Euro ETF (FXE) and the 20+ YR T-Bond ETF (TLT) are all up year-to-date and showing positive correlation. This is not a big surprise because gold is negatively correlated to the Dollar and negatively correlated to the 10-yr T-Yield ($TNX). The Euro accounts for around 57%...
READ MORE
MEMBERS ONLY
Will Bonds or Small-caps Turn Up First?
by Arthur Hill,
Chief Technical Strategist, TrendInvestorPro.com
.... Will Bonds or Small-caps Turn Up First? (IJR, MDY, TLT, IEF)
.... Citigroup is Leading the Big Banks (XLF, JPM, BAC, MS, GS)
.... A Big ETF Provider and Two Brokers (BLK, SCHW, ETFC)
.... Three Railroads with Long-term Uptrends (UNP, NSC, KSU)
.... Three Big Utilities Go for Breakouts (AES, D, DUK, SO)...
READ MORE
MEMBERS ONLY
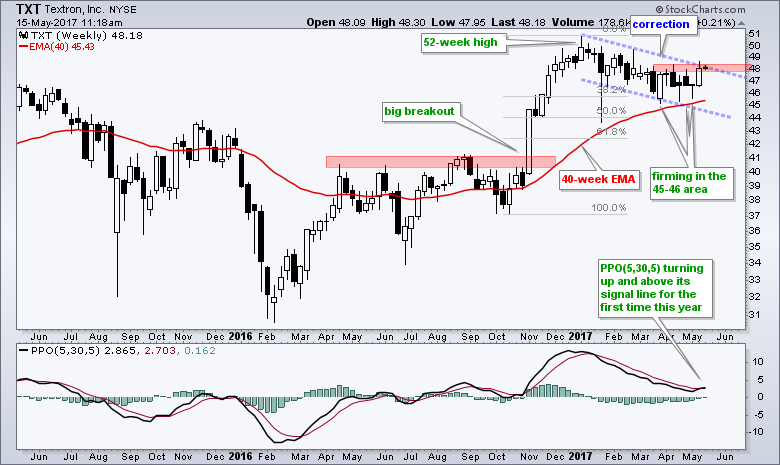
PPO Upturn Points to a Correction-ending Breakout for Textron
by Arthur Hill,
Chief Technical Strategist, TrendInvestorPro.com
Textron (TXT), which is part of the industrials sector and the defense-aerospace industry, surged to new highs after the election and then declined in 2017. I consider this a correction within a bigger uptrend because the decline retraced less than 50% of the prior advance and the stock remains above...
READ MORE
MEMBERS ONLY
Video - Weekly Market Review & Outlook - Plotting the High-Low Line for Small-caps
by Arthur Hill,
Chief Technical Strategist, TrendInvestorPro.com
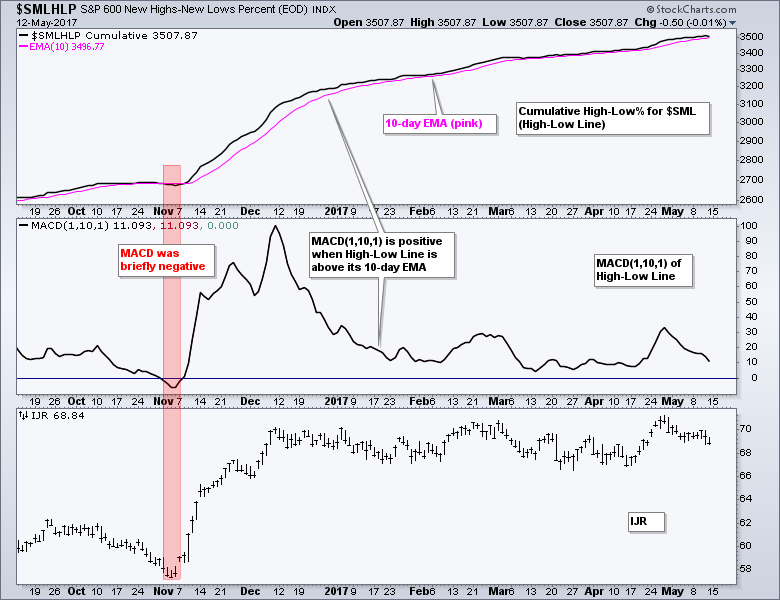
Small-Cap High-Low Line is Still Rising
The bulk of the evidence remains bullish for stocks, but small-caps and mid-caps continue to drag their feet. The chart below shows the cumulative High-Low Line for S&P SmallCap High-Low Percent ($SMLHLP) with the 10-day EMA (pink). Notice that the High-Low Line...
READ MORE
MEMBERS ONLY
Weekly Market Review & Outlook - Mixed Breadth - Bond ETFs Hit Inflection Point
by Arthur Hill,
Chief Technical Strategist, TrendInvestorPro.com
Weekly Market Review & Outlook
.... On a Road to Nowhere ($VIX and $SPX)
.... High-Low Lines Continue to Rise
.... Deterioration in %Above 200-day Indicators
.... SPY Holds the Breakout and the Gaps
.... IJR and MDY Tests their Breakout Zones
.... Mind the Gap-Breakouts in XLI and XLF
.... Correlations with the 20+ YR T-Bond...
READ MORE
MEMBERS ONLY
Performance Drags with Biotech, Healthcare and Transports - Refiners Perk Up - Plus AES, EMR, FLIR and NTAP
by Arthur Hill,
Chief Technical Strategist, TrendInvestorPro.com
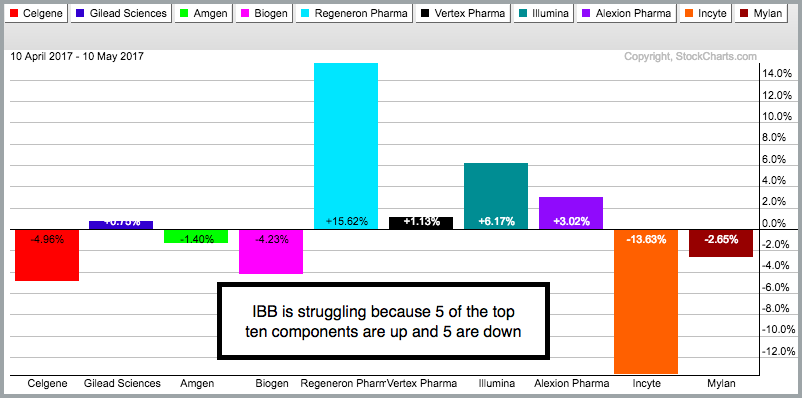
.... Split Performance Hinders Biotech ETF
.... Amgen Lagging Biotechs and Market
.... HealthCare SPDR Holds Breakout
.... Pfizer Slows to a Crawl
.... Delivery and Trucking Weigh on Dow Transports
.... Use Sector Summary to Drill Down
.... Refiner Stocks Catch a Bid
.... Stocks to Watch: AES, EMR, FLIR, NTAP
Split Performance Hinders Biotech ETF
The...
READ MORE
MEMBERS ONLY
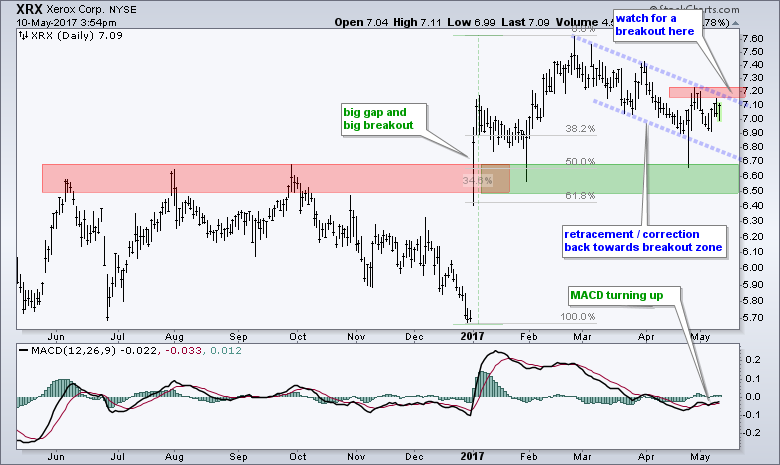
Xerox Rises from the Ashes
by Arthur Hill,
Chief Technical Strategist, TrendInvestorPro.com
I was running through some charts today and came across and interesting setup - in Xerox of all names. It has been a long time since Xerox crossed my path. The company provides document management solutions with both hardware and services. It is a $7.2 billion company and part...
READ MORE
MEMBERS ONLY
IJR and MDY Tests their Breakout Zone - Watching the Banks and 8 Stocks
by Arthur Hill,
Chief Technical Strategist, TrendInvestorPro.com
.... IJR and MDY Tests their Breakouts
.... Stocks and Junk Outperforming Treasuries
.... Watch BAC, C, GS and JPM for Big Banks
.... Watch USB, FITB, HBAN and ZION for Regionals
.... Aroons Signal Consolidaiton for Arconic
.... A Small Correction for Natty?
.... BHI and XOM Held Up Better than their Peers
.... Charts to Watch:...
READ MORE
MEMBERS ONLY
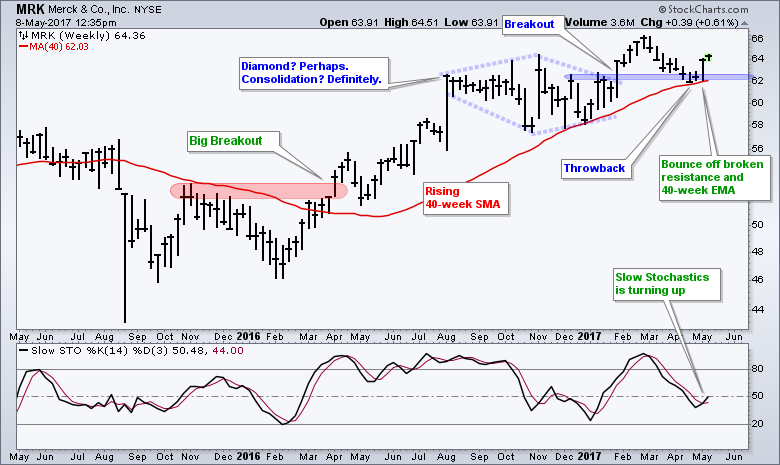
Merck Makes a Move $MRK
by Arthur Hill,
Chief Technical Strategist, TrendInvestorPro.com
Merck is showing signs of life as it bounces off a breakout zone and the Stochastic Oscillator turns up. The overall trend is up because the stock hit a 52-week high in February and is above the rising 40-week moving average. After a breakout surge earlier this year, the stock...
READ MORE
MEMBERS ONLY
Video - Weekly Market Review & Outlook - The Relationship between Stocks and Bonds, and Bonds and Oil
by Arthur Hill,
Chief Technical Strategist, TrendInvestorPro.com
----- Video Link ----- Art's Charts ChartList (updated 6-May) -----
Stocks were mixed this past week as the S&P 500 SPDR (SPY) and Nasdaq 100 ETF (QQQ) moved higher, while the Russell 2000 iShares (IWM) and S&P SmallCap iShares (IJR) edged lower. SPY is...
READ MORE
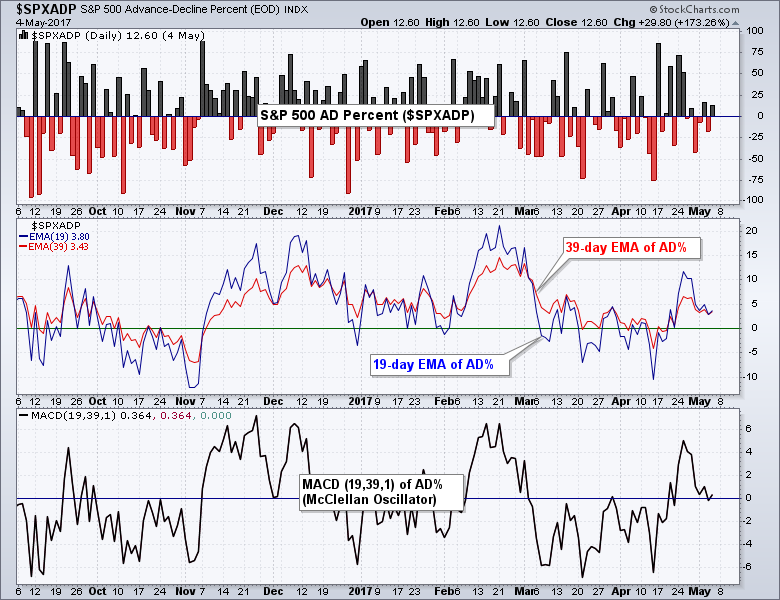
MEMBERS ONLY
Create McClellan Oscillators for the Nine Sector SPDRs and the Gold Miners
by Arthur Hill,
Chief Technical Strategist, TrendInvestorPro.com
The McClellan Oscillator is a breadth indicator that Chartists can use to enhance their analysis of an index. StockCharts carries the McClellan Oscillator for dozens of broad market indexes, but not for the S&P sectors. There is no need to fret because StockCharts users can create the McClellan...
READ MORE
MEMBERS ONLY
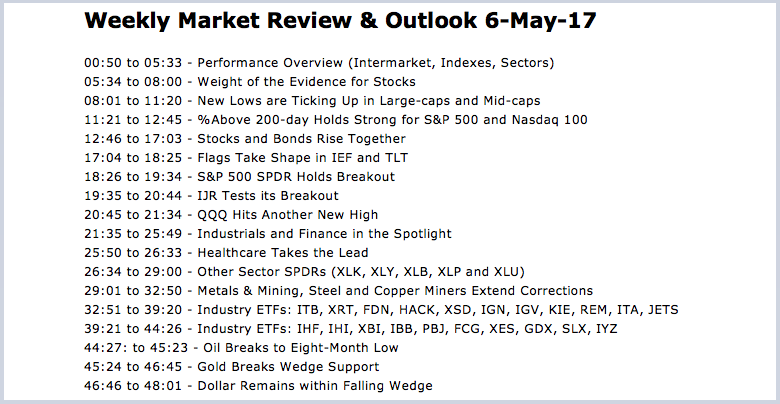
Weekly Market Review & Outlook - New Lows Expand, but Weight of the Evidence Remains Bullish
by Arthur Hill,
Chief Technical Strategist, TrendInvestorPro.com
... Weight of the Evidence for Stocks
.... New Lows are Ticking Up in Large-caps and Mid-caps
.... %Above 200-day Holds Strong for SPX and NDX
.... Stocks and Bonds Rise Together
.... Flags Take Shape in IEF and TLT
.... S&P 500 SPDR Holds Breakout
.... IJR Tests its Breakout
.... QQQ Hits Another New...
READ MORE
MEMBERS ONLY
SystemTrader - How to Sell in June and Avoid a Swoon
by Arthur Hill,
Chief Technical Strategist, TrendInvestorPro.com
.... Sell in June to Avoid a Swoon
.... Testing the Best Six Months Strategy
.... A Twenty Year Testing Period
.... Best versus Worst Six Months
.... Four Months Stand out on Seasonality Chart
.... Testing the Strongest Eight Months
.... Seasonality Plus Timing Improves Returns
.... Conclusions ....
Testing the Best Six Months Strategy
Seasonal patterns are...
READ MORE
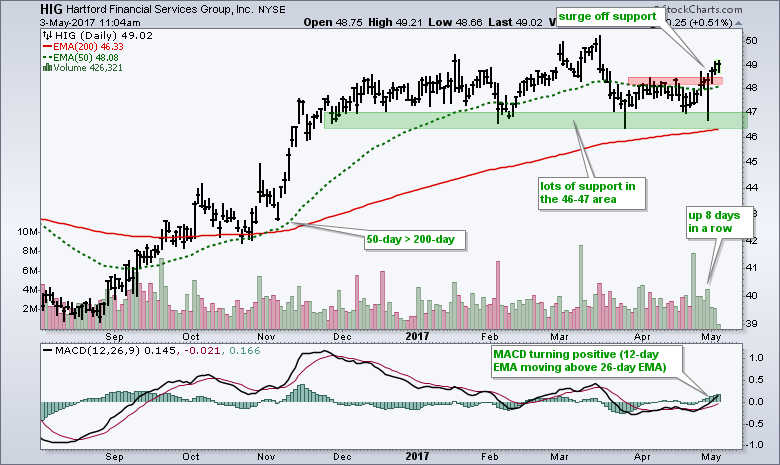
MEMBERS ONLY
Hartford Surges off Support with 7-day Move
by Arthur Hill,
Chief Technical Strategist, TrendInvestorPro.com
Hartford (HIG) is a big insurance concern and part of the Insurance SPDR (KIE), which is one of the best performing industry group ETFs over the last six months. The stock surged from late August to mid November and continued higher at a slower pace from January to March, hitting...
READ MORE
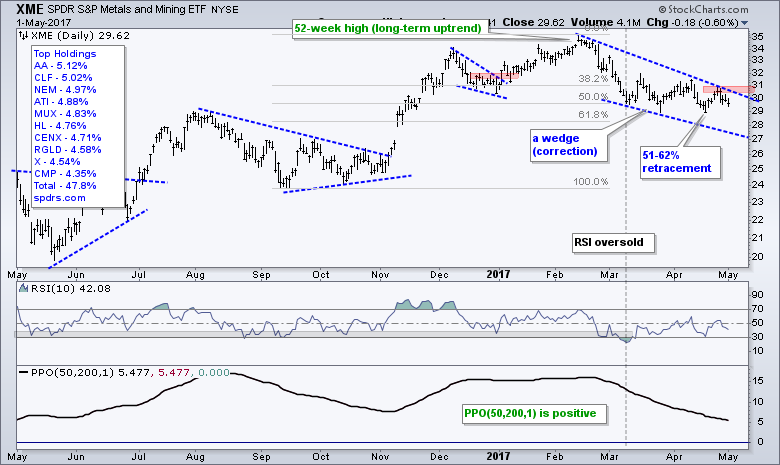
MEMBERS ONLY
Identifying Corrections within a Bigger Uptrend (XME, COPX, IGN) - Do You Really Know what Drives Prices?
by Arthur Hill,
Chief Technical Strategist, TrendInvestorPro.com
.... XME - A Mere Correction or More? (plus COPX)
.... Steel Stocks Dominate XME
.... HACK and IGN Perk Up within Technology
.... Vanguard Finance ETF Stalls after Gap
.... Respect for Bank Analyst Dick Bové (plus GS)
.... Think you Really Know what Drives a Stock?....
XME - A Mere Correction or More? (plus...
READ MORE
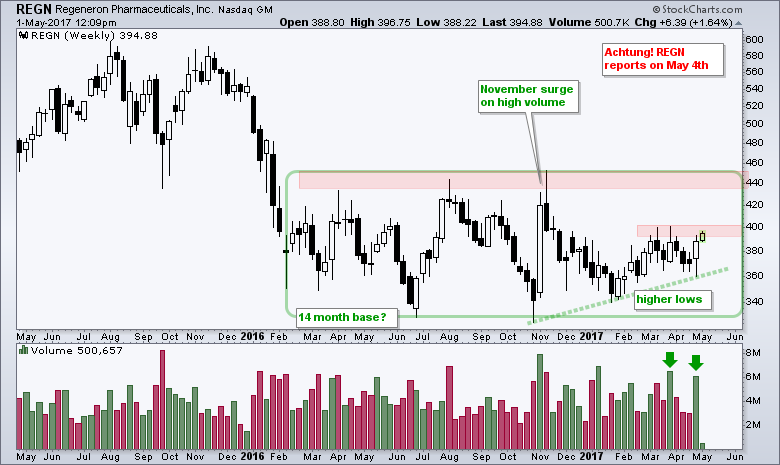
MEMBERS ONLY
Regeneron Bounces within a Massive Base
by Arthur Hill,
Chief Technical Strategist, TrendInvestorPro.com
Regeneron has gone nowhere since February 2016, but recent volume bars suggest that this may be a massive base. The stock surged off the 325 area with big volume in November. After falling back into January, the stock held above the October low and turned up the last 14 weeks....
READ MORE
MEMBERS ONLY
Video - Weekly Market Review & Outlook - Watching the Bond Market for Clues on Banks and the S&P 500
by Arthur Hill,
Chief Technical Strategist, TrendInvestorPro.com
----- Video Link ----- Art's Charts ChartList (updated 29-Apr) -----
Stocks followed through this past week with further gains, but small-caps took a hit on Friday and underperformed for the week. Friday's hit was not enough to overshadow the breakouts in the S&P 500...
READ MORE
MEMBERS ONLY
Weekly Market Review & Outlook - Indicators and Index ETFs Follow Through
by Arthur Hill,
Chief Technical Strategist, TrendInvestorPro.com
.... Weekly Market Review & Outlook
.... High-Low Percent Follow Through
.... MDY and SPY Follow Through
.... Large Techs and Small Caps Lead
.... Sector Balance is Clearly Bullish
.... Percent above 200-day EMA Reflects Broad Strength
.... XLK, XLY, XLI and XLB Lead with New Highs
.... Equal-weight and Small-cap Healthcare Lead
.... Biotech ETFs End Corrections...
READ MORE
MEMBERS ONLY
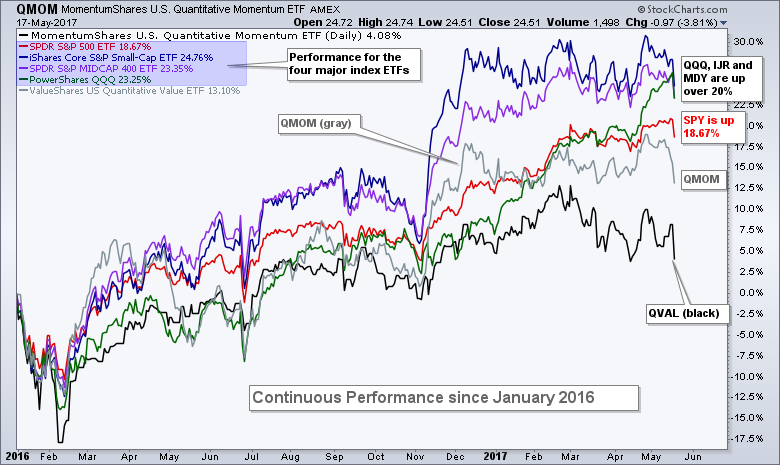
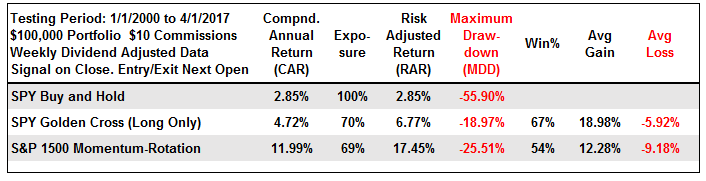
Comparing Momentum ETFs to the Major Index ETFs - Revisiting the ChartCon Momentum-Rotation Strategy
by Arthur Hill,
Chief Technical Strategist, TrendInvestorPro.com
.... ChartCon Momentum-Rotation Update
.... What can we learn from this?
.... Comparing with the Momentum-Driven ETFs
.... Comparing Performance with PerfCharts
.... Ranking Performance with the Summary View
.... Measuring Relative Performance with RRGs
.... Performance Since Bull Run Began
.... Measuring Rolling Performance
.... Volatility Can Hurt Momentum ....
Today I am going to look at some momentum-style...
READ MORE