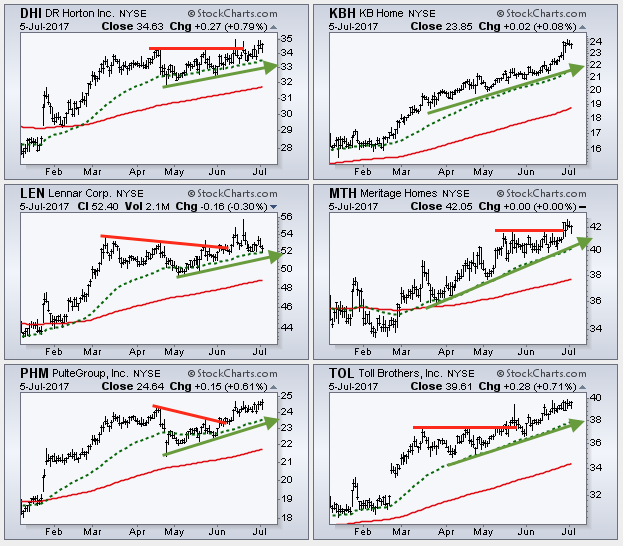
MEMBERS ONLY
Homebuilders March Higher - Customizing CandleGlance - Plus 2 Housing Stocks, 3 Biotechs, 3 Cyber Security Plays and 3 for the Road
by Arthur Hill,
Chief Technical Strategist, TrendInvestorPro.com
.... Home Builders Continue to March Higher
.... Customize your CandleGlance Charts
.... Caesarstone and USG May Play Catchup
.... High and Tight Flags for Two Biotechs (AMGN, GILD)
.... 3 Cyber Security Stocks (PANW, FTNT, PFPT)
.... Three Charts for the Road (DOX, WEN, VLKAY)
The Home Construction iShares (ITB) is one of the strongest...
READ MORE
MEMBERS ONLY
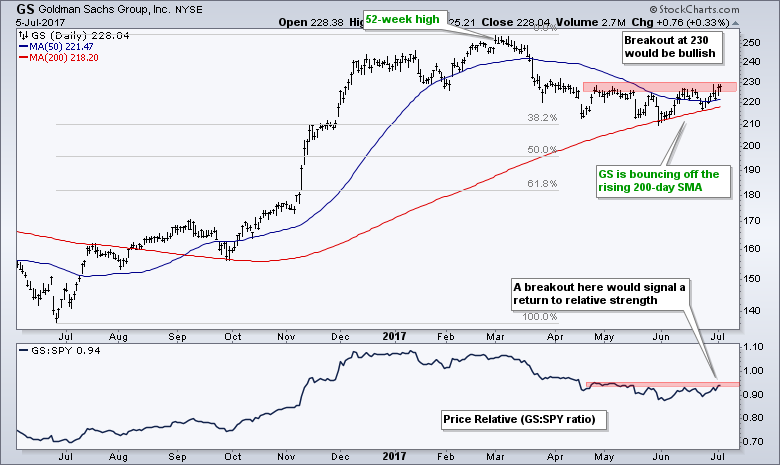
Goldman Goes for a Breakout $GS
by Arthur Hill,
Chief Technical Strategist, TrendInvestorPro.com
Goldman Sachs (GS) appears to be ending its correction as it bounces off the rising 200-day moving average. The chart shows GS hitting a 52-week high in March and then declining into June. I consider this a correction because the stock was entitled to a pullback after a...
READ MORE
MEMBERS ONLY
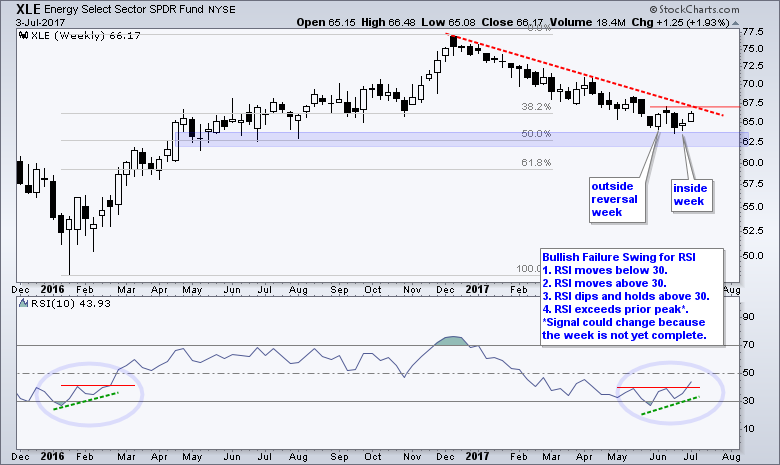
A Bullish Failure Swing for RSI on XLE
by Arthur Hill,
Chief Technical Strategist, TrendInvestorPro.com
The Energy SPDR (XLE) continues to firm after an extended decline and RSI could trigger a bullish signal this week. On the price chart, XLE shows signs of stabilization with an outside reversal five weeks ago and an inside week last week. Notice that XLE is firming near support from...
READ MORE
MEMBERS ONLY
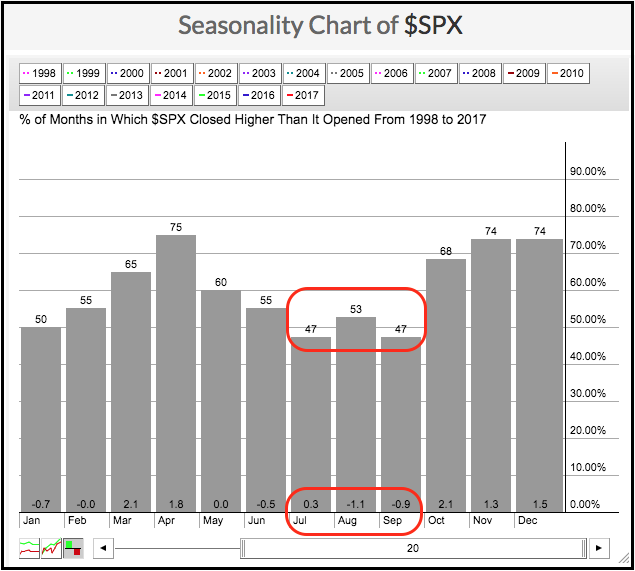
S&P 500 Seasonality and the Dog Days of Summer
by Arthur Hill,
Chief Technical Strategist, TrendInvestorPro.com
The chart below shows the seasonal tendency for the S&P 500 over the last twenty years (1998 to 2017). The number at the top of each bar shows the percentage of months the S&P 500 advanced for that particular month, while the number at the bottom...
READ MORE
MEMBERS ONLY
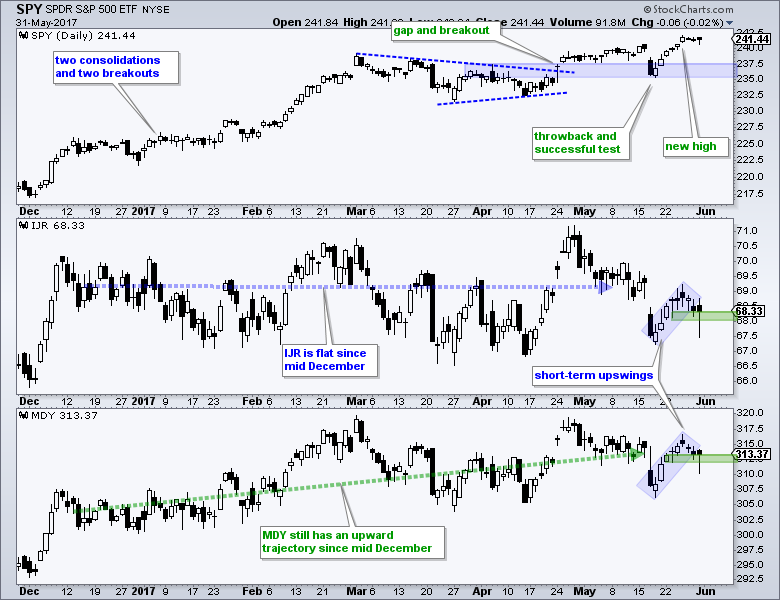
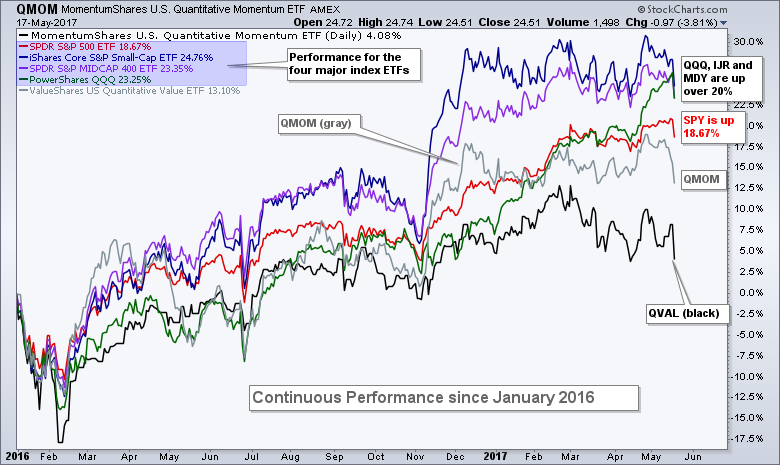
Weekly Market Review & Outlook - QQQ Starts Correction as SPY and IJR Hold Up
by Arthur Hill,
Chief Technical Strategist, TrendInvestorPro.com
.... Weekly Market Review & Outlook
.... SPY has Yet to Start a Correction
.... Small-caps Continue to Drift Higher
.... QQQ Forms Second Big Engulfing Pattern
.... S&P 500 Enters Weakest 3-month Stretch
.... So Does 10-yr Yield!
.... 10-yr T-Yield Bounces within Downtrend
.... TLT Forms Big Bearish Engulfing,...
READ MORE
MEMBERS ONLY
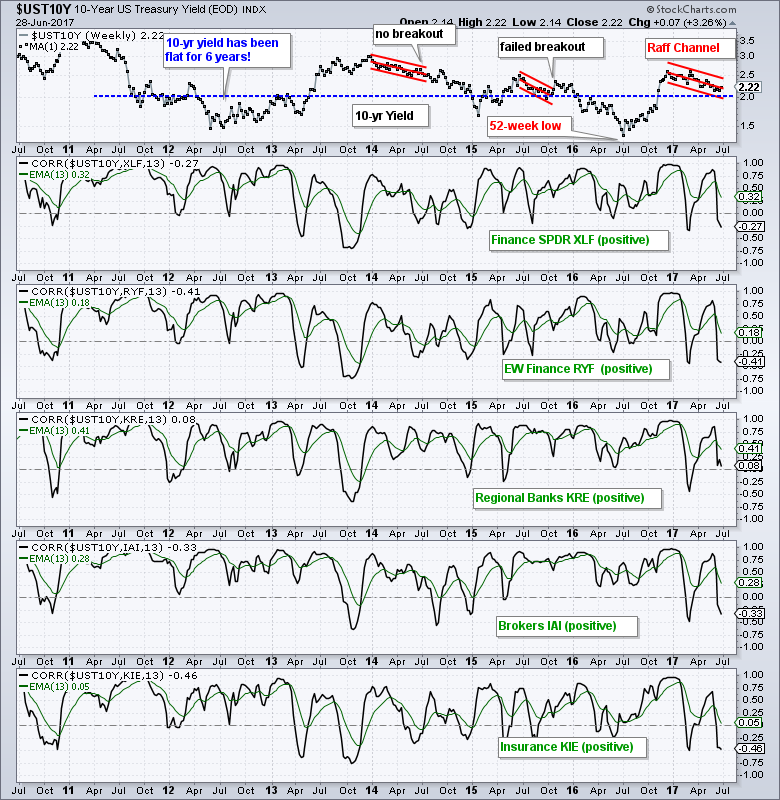
The Great Rate Debate - 4 Regional Banks and 3 Steel Stocks Bid to End Corrections
by Arthur Hill,
Chief Technical Strategist, TrendInvestorPro.com
.... The Great Rate Debate
.... Correlations Do Not Reflect Magnitude
.... BB&T Takes Two Steps Forward and One Step Backward
.... Fifth Third, Huntington and PNC Financial
.... Three Steel Stocks on the Move ....
The Great Rate Debate
Are yields rising, falling or flat? This depends, as always, on your timeframe. Chartists...
READ MORE
MEMBERS ONLY
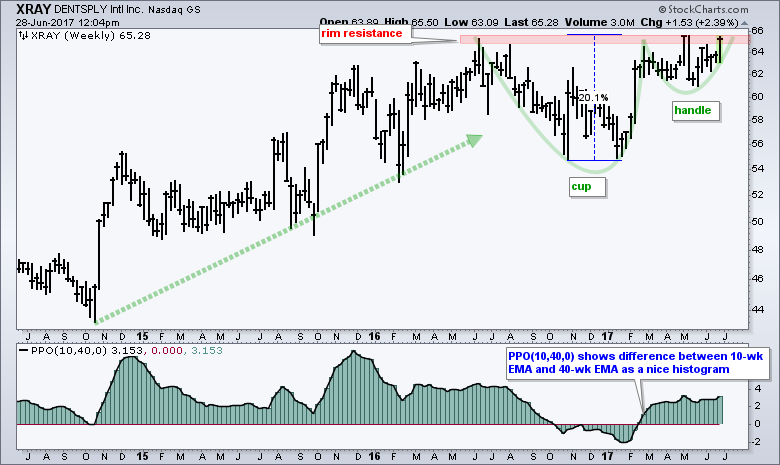
XRAY Traces Out a Classic Bullish Continuation Pattern
by Arthur Hill,
Chief Technical Strategist, TrendInvestorPro.com
Dentsply International (XRAY) has a large cup-with-handle pattern forming over the last twelve months and the stock is on the verge of breaking rim resistance. Popularized by William O'Neil of Investors Business Daily, the cup-with-handle is a bullish continuation pattern. This means it forms...
READ MORE
MEMBERS ONLY
Bearish Candles Hit Big Tech Stocks - Plus two Brokers, Two Big Banks and More
by Arthur Hill,
Chief Technical Strategist, TrendInvestorPro.com
.... QQQ and Facebook hit with Dark Clouds
.... Alphabet and Amazon Form Engulfing Patterns
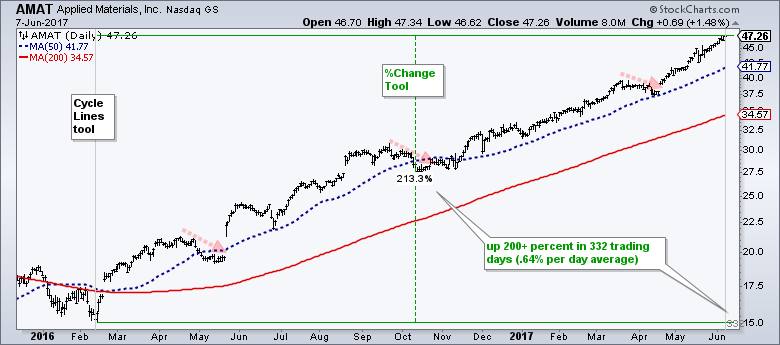
.... AMAT Forms Bearish Pennant
.... A Feeble Bounce for Apple
.... Etrade and Schwab Stall after Breakouts
.... Citigroup Leads, but JP Morgan Shows Short-term Strength
.... Cypress Forms Engulfing within Correction ....
There were quite a few bearish candlestick patterns...
READ MORE
MEMBERS ONLY
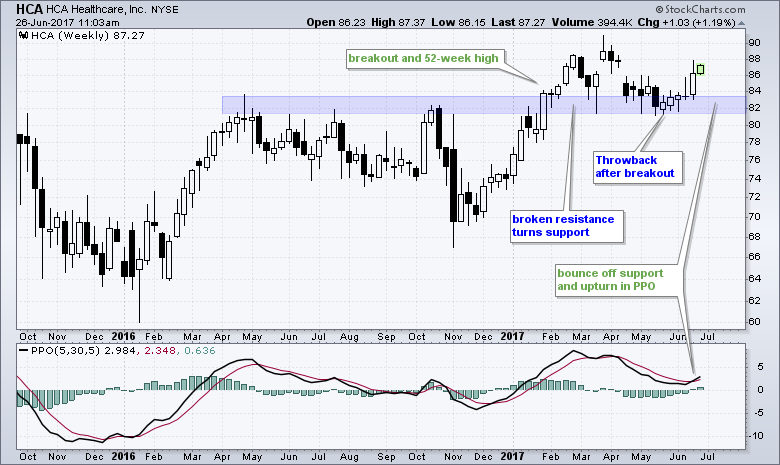
HCA Healthcare Bounces off Breakout Zone
by Arthur Hill,
Chief Technical Strategist, TrendInvestorPro.com
HCA Healthcare (HCA) is turning up at a key level and showing signs that the long-term uptrend is resuming. HCA is in a long-term uptrend because it broke out in January and recorded a 52-week high. This breakout zone turned into support around 82 as the stock...
READ MORE
MEMBERS ONLY
Weekly Market Review & Outlook (w/ Video) - Two of Nine Sector SPDRs Hit New Highs
by Arthur Hill,
Chief Technical Strategist, TrendInvestorPro.com
.... SPY Breaks out of Flag Pattern
.... QQQ Holds the Gap as IJR Forms Bull Flag
.... Industrials and Healthcare Lead with New Highs
.... Tech, Discretionary and Finance Lag a Bit
.... First Supports for Materials, Staples and Utilities
.... Energy - Enough Said
.... Tech ETF Bounce from Oversold Levels
.... Insurance and Regional Banks Fall...
READ MORE
MEMBERS ONLY
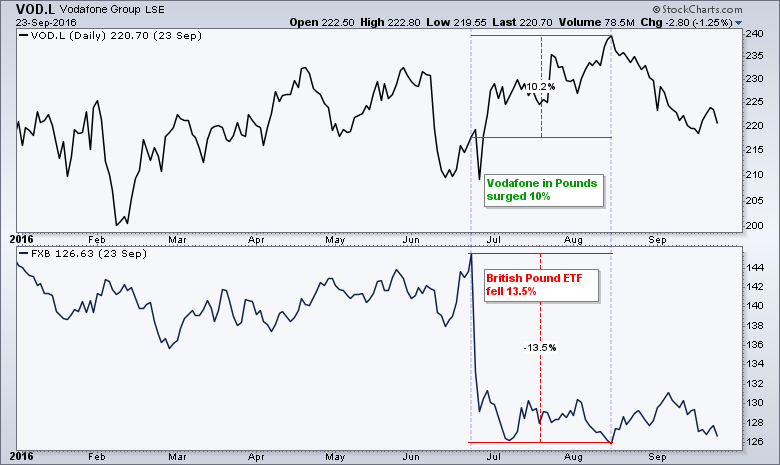
ADRs, ETFs and Currency - Analysis for EEM, Poland, China, Italy and Spain
by Arthur Hill,
Chief Technical Strategist, TrendInvestorPro.com
.... Vodafone in Dollars vs Pounds
.... Index versus ETF versus Currency
.... Emerging Markets ETF Hits Top of Channel
.... Poland ETF Stalls within Uptrend
.... China A-Shares ETF Breaks Out
.... Italy and Spain Consolidate Gains ....
Vodafone in Dollars vs Pounds
Today I will take a look at some international ETFs. Before looking...
READ MORE
MEMBERS ONLY
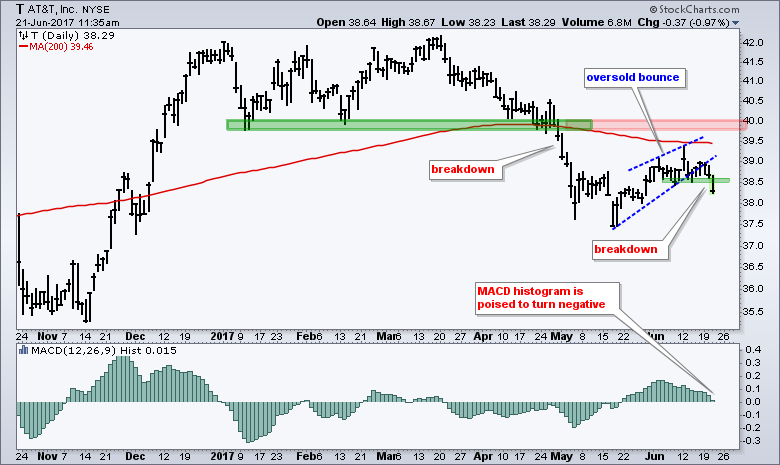
MACD Histogram Teeters as AT&T Breaks Wedge Line
by Arthur Hill,
Chief Technical Strategist, TrendInvestorPro.com
Despite a strong stock market in 2017, AT&T ($T) is having a tough time with a breakdown in early May and a sharp decline below the 200-day SMA. The stock rebounded after a double-digit decline with a bounce back to the 200-day SMA, which is...
READ MORE
MEMBERS ONLY
Market Shows Broad Strength, Techs Get Mojo Back, Bank ETFs Stall and 12 Stock Setups
by Arthur Hill,
Chief Technical Strategist, TrendInvestorPro.com
.... Big Techs Regain their Mojo
.... Finance, Healthcare, Industrials and Materials Lead
.... Short-term Yields Diverge from Long-term Yields
.... Bank ETFs Stall after Breakouts
.... Two Big Pharma Stocks: BMY and MRK
.... 3 Hospital Stocks: HCA, LPNT, THC
.... Four Networking Stocks: ARRS, CIEN, CSCO, FNSR
.... XRX Breaks Out, FEYE Forms Flag...
READ MORE
MEMBERS ONLY
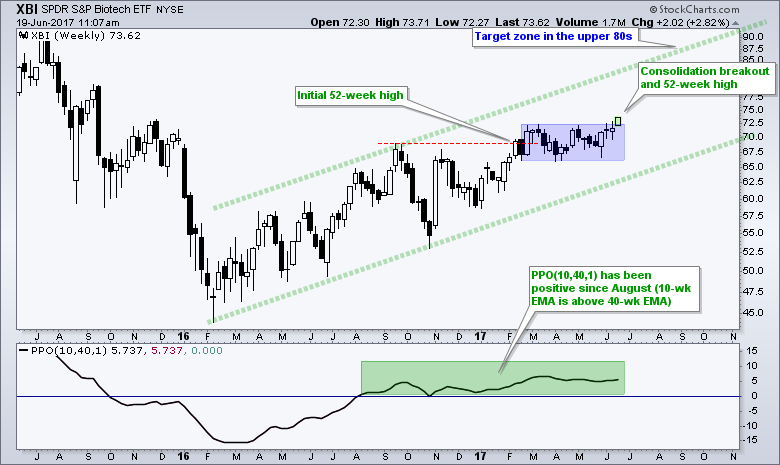
Breakout in Biotech SPDR Signals Trend Continuation
by Arthur Hill,
Chief Technical Strategist, TrendInvestorPro.com
The Biotech SPDR (XBI) is starting to lead the market again with a consolidation breakout and 52-week high. The chart shows the ETF hitting an initial 52-week high in February and then consolidating for four months. It looks like this consolidation is ending and the bigger uptrend is...
READ MORE
MEMBERS ONLY
Charles Dow and Leonardo Fibonacci Walk into a Bar
by Arthur Hill,
Chief Technical Strategist, TrendInvestorPro.com
The bar was 61.8 inches off the floor, but Leondardo still did not see it. All (bad) joking aside, I would like to look at corrections through the eyes of Charles Dow and Leonardo Fibonacci. These two may seem miles apart at first glance, but the numbers suggest otherwise....
READ MORE
MEMBERS ONLY
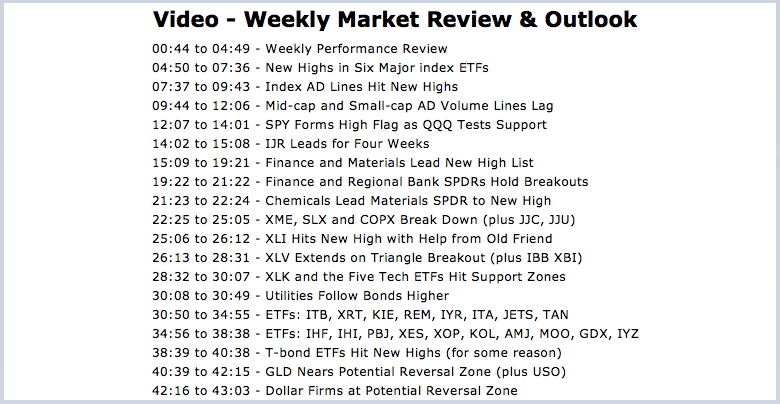
Weekly Market Review & Outlook (w/ Video) - New Highs for Major Index ETFs and New Sector Leadership
by Arthur Hill,
Chief Technical Strategist, TrendInvestorPro.com
* New Highs in Six Major index ETFs
* Index AD Lines Hit New Highs
* Mid-cap and Small-cap AD Volume Lines Lag
* SPY Forms High Flag as QQQ Tests Support
* IJR Leads for Four Weeks
* Finance and Materials Lead New High List
* Finance and Regional Bank SPDRs Hold Breakouts
* Chemicals...
READ MORE
MEMBERS ONLY
SystemTrader - Putting the VIX Through the Wringer and Testing Signals with SPY
by Arthur Hill,
Chief Technical Strategist, TrendInvestorPro.com
.... Does the VIX Add Any Value?
.... Setting the Benchmark
.... System Ground Rules
.... Consulting, Software and Data
.... Normalizing the VIX with the PPO
.... Testing Different PPO Extremes
.... Testing with the VIX PPO Histogram
.... Conclusions and Caveat Emptor ....
Does the VIX Add Any Value?
The S&P 500 Volatility Index ($VIX)...
READ MORE
MEMBERS ONLY
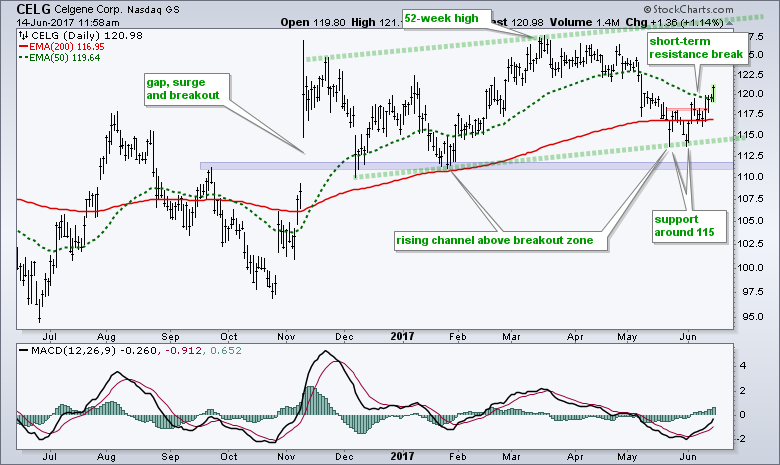
Celgene Holds Breakout Zone and Turns Up
by Arthur Hill,
Chief Technical Strategist, TrendInvestorPro.com
Celgene (CELG) is a large biotech stock that is part of the Biotech iShares (IBB) and the Biotech SPDR (XBI). Overall, I would suggest that the long-term trend is up because the stock hit a 52-week high in mid-March and the 50-day EMA is above the...
READ MORE
MEMBERS ONLY
QQQ Takes a Hit, Two Leading EW Sectors and Eight Stock Setups
by Arthur Hill,
Chief Technical Strategist, TrendInvestorPro.com
.... QQQ Suffers Biggest Loss since early November
.... EW Industrials Sector Nears New High
.... Cummins and JetBlue Lead Industrials
.... New Highs for EW Materials ETF and Cemex
.... CA Forms Out-of-Place Ascending Triangle
.... Cypress Semi Falls Back into Correction
.... Double Top and Death Cross for F5, but
.... Zimmer Biomet Fills...
READ MORE
MEMBERS ONLY
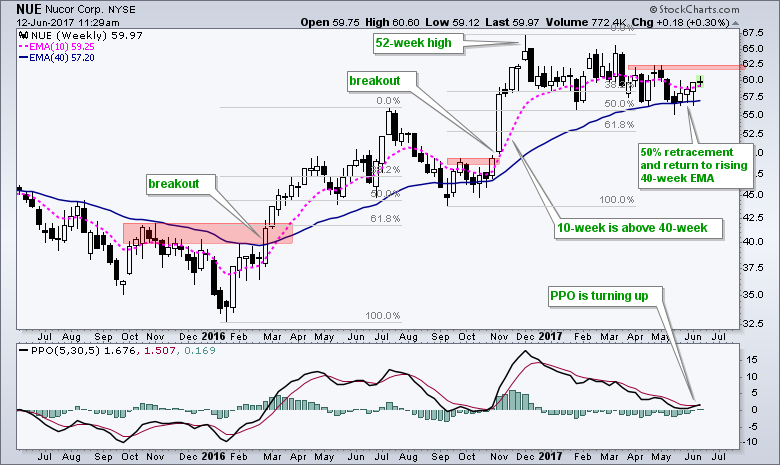
NUE Shows Early Signs of Ending its Correction $NUE
by Arthur Hill,
Chief Technical Strategist, TrendInvestorPro.com
Nucor (NUE) is flat year-to-date and lagging the S&P 500, but the bigger trend is up and short-term momentum is turning up. The bigger trend is up because Nucor surged to a 52-week high in early December and the 10-week EMA remains above...
READ MORE
MEMBERS ONLY
Weekly Market Review & Outlook (w/ Video) - Small-caps, Finance and Miners Bid to End Corrections
by Arthur Hill,
Chief Technical Strategist, TrendInvestorPro.com
.... Bullish until it Ain't (seasonality)
.... SPY Extend Higher
.... Small-caps Challenge for Leadership
.... Finance Sector Bids to End Correction
.... Insurance Leads and Regionals Play Catch Up
.... Materials Sector Hits New High
.... XME Makes a Bid to End Correction (plus steel)
.... Copper and Aluminum Bid to End Corrections
.... Four...
READ MORE
MEMBERS ONLY
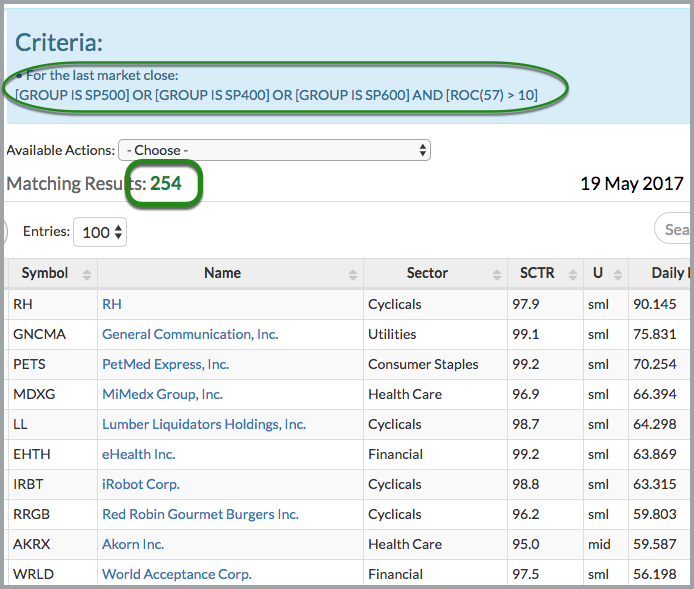
Determining Trend Direction and Trend Strength with Simple Indicators - Plus Scan Code
by Arthur Hill,
Chief Technical Strategist, TrendInvestorPro.com
.... Finding Strong and Persistent Uptrends
.... Understanding Your Indicators
.... A Simple Trend Following
.... Measuring Trend Strength
.... Focus on a Failure
.... Strong Uptrend Scan Code
.... Current State of the Market ....
Finding Strong and Persistent Uptrends
There are some incredibly strong and persistent uptrends in the market right now and I would like...
READ MORE
MEMBERS ONLY
Vulcan Materials Consolidates above Breakout Zone $VMC
by Arthur Hill,
Chief Technical Strategist, TrendInvestorPro.com
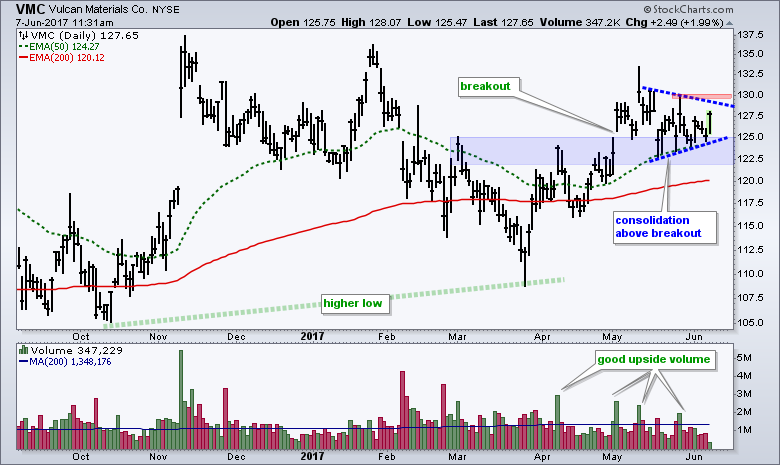
After struggling the first three months of the year, Vulcan Materials (VMC) is showing signs of life since late March with good upside volume and a breakout in early May. Notice that the stock broke above a resistance zone in the 122-125 area and this zone turns into support....
READ MORE
MEMBERS ONLY
Using EMA Ribbons to Define Strong Trends - Gold Leaves the Gold Miners Behind
by Arthur Hill,
Chief Technical Strategist, TrendInvestorPro.com
.... IJR Mean-Reversion Trade Exit
.... Gold Rises without the Gold Miners
.... Regional Banks Continue to Struggle
.... Using an EMA Ribbon to Define the Trend (MA)
.... Three Failed Setups (NTAP, STX, BMY)
.... Hawaiian Holdings Bounces off Breakout
.... Bullish Setups for MLM and CSRA
.... A Bearish Setup for IRM ....
IJR Mean-Reversion...
READ MORE
MEMBERS ONLY
UPS Goes for a Breakout
by Arthur Hill,
Chief Technical Strategist, TrendInvestorPro.com
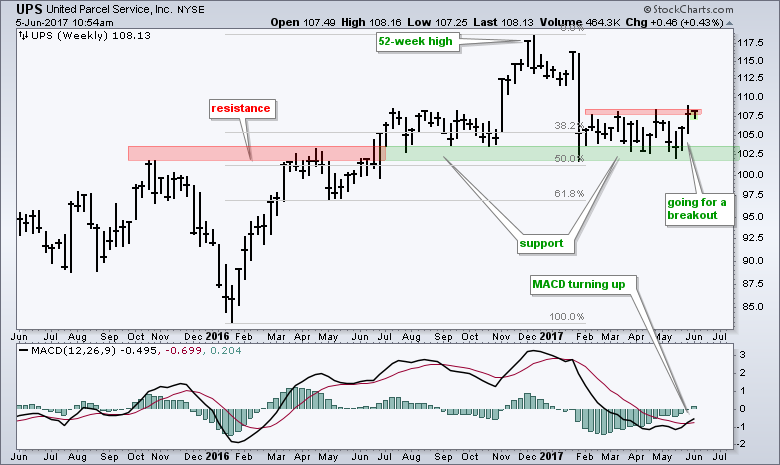
United Parcel Service (UPS) has been lagging the broader market this year, but may be turning around as it bounces off support and momentum turns up. UPS surged to a 52-week high in December and then retraced 50% with a sharp decline in January. The stock managed to firm...
READ MORE
MEMBERS ONLY
The Most Important Assumption in Trading
by Arthur Hill,
Chief Technical Strategist, TrendInvestorPro.com
Trading and investing are all about putting the odds in your favor, and chartists can increase their odds with one key assumption: the trend will remain in force until proven otherwise. Coming from the writings of Charles Dow, this assumption means a trend in motion is expected to stay in...
READ MORE
MEMBERS ONLY
Weekly Market Review & Outlook with Video - Participation is Broad Enough as New Highs Expand
by Arthur Hill,
Chief Technical Strategist, TrendInvestorPro.com
.... New Highs Expand in Large-caps and Mid-caps
.... EW S&P 500 Reflects Broad Strength
.... SPY Hits another New High
.... QQQ Extends its "Overbought" Streak
.... Small-caps and Mid-caps Perk Up
.... New highs in XLY, XLK, XLI, XLV, XLU and XLP
.... Good Weekend Stocks Lead...
READ MORE
MEMBERS ONLY
Small-caps Rebound - Plus A Big Chemical Breakout, an Industrial Breakout, Four Tech Corrections and Two Big Pharmas Perk Up
by Arthur Hill,
Chief Technical Strategist, TrendInvestorPro.com
.... Small-caps Bounce Back from the Abyss
.... Lots of Winners and Losers Out There
.... A Big Chemical Stock Breaking Flag Resistance
.... An Industrial Stock Bouncing off Support
.... Four Tech Stocks with Small Corrections
.... Big Pharma Stocks Perk Up
.... Three Miscellaneous Stocks: FBHS, SYY and XRAY....
Small-caps Bounce Back from...
READ MORE
MEMBERS ONLY
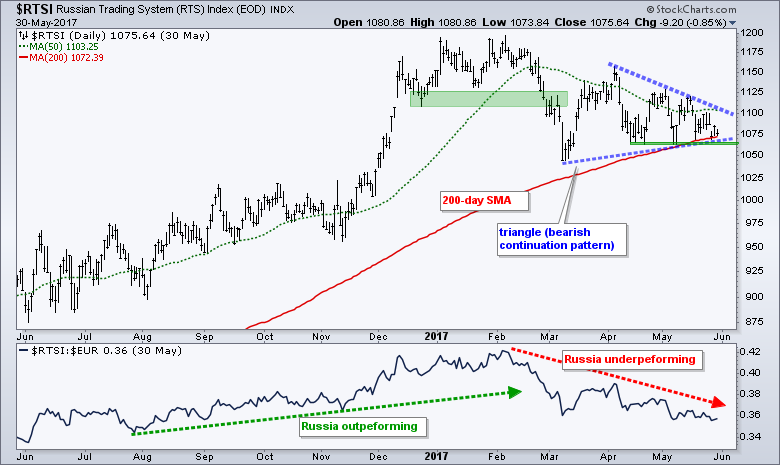
Russian Index Forms Bearish Continuation Pattern
by Arthur Hill,
Chief Technical Strategist, TrendInvestorPro.com
The Russian Trading System Index ($RTSI) is struggling this year and down around 6.5% year-to-date. In contrast, the S&P 500 is up over 7% year-to-date and the Eurotop 100 ($EUR) is up around 6.5%. In addition to relative weakness, the index sports...
READ MORE
MEMBERS ONLY
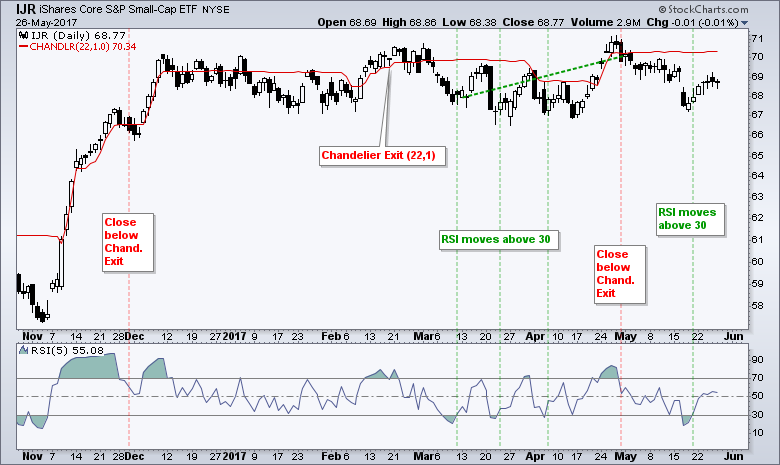
Mean-Reversion for IJR - Plus China, Asia, Aluminum, Railroads and Six Stocks to Watch
by Arthur Hill,
Chief Technical Strategist, TrendInvestorPro.com
.... IJR Mean-Reversion Trade in Play
.... Marking Upswing Support for MDY
.... Chinese Stocks Spring to Life
.... Asian Index ETFs Show Broad Strength
.... Finding Stocks within an Industry Group
.... Aluminum Stocks Look Poised for Upturn
.... Railroad Stocks Lead with Big Gains
.... Stocks to Watch: MON, FLIR, CY, PANW, PAYX, WWW ....
IJR...
READ MORE
MEMBERS ONLY
Video - Weekly Market Review & Outlook - Still a Large-cap World
by Arthur Hill,
Chief Technical Strategist, TrendInvestorPro.com
.... Stocks Bounce without Biotechs
.... Breadth Remains Bullish, but Weakening
.... Nasdaq Stocks Support S&P 500
.... QQQ Hits Yet Another New High
.... Small-caps Not Feeling the Love
.... Sector Balance Clearly Bullish
.... %Above 200-day Ranking for Sectors
.... XLU, XLP, XLI and XLK Lead with Fresh Highs
.... TLT Holds Surge...
READ MORE
MEMBERS ONLY
SystemTrader - Trailing Stops versus Profit Targets for a Moving Average Crossover System
by Arthur Hill,
Chief Technical Strategist, TrendInvestorPro.com
.... Do stops really help?
.... Setting the Benchmark
.... System Ground Rules
.... Consulting, Software and Data
.... Testing Some Basic EMA Crossovers
.... Base System and Sample Charts
.... Trailing Stops, Profit Targets and Both
.... Backtest Results
.... Testing a Percent Profit Target
.... Conclusions and Caveat Emptor
.... Scan Code ....
Do stops really help?
We have all...
READ MORE
MEMBERS ONLY
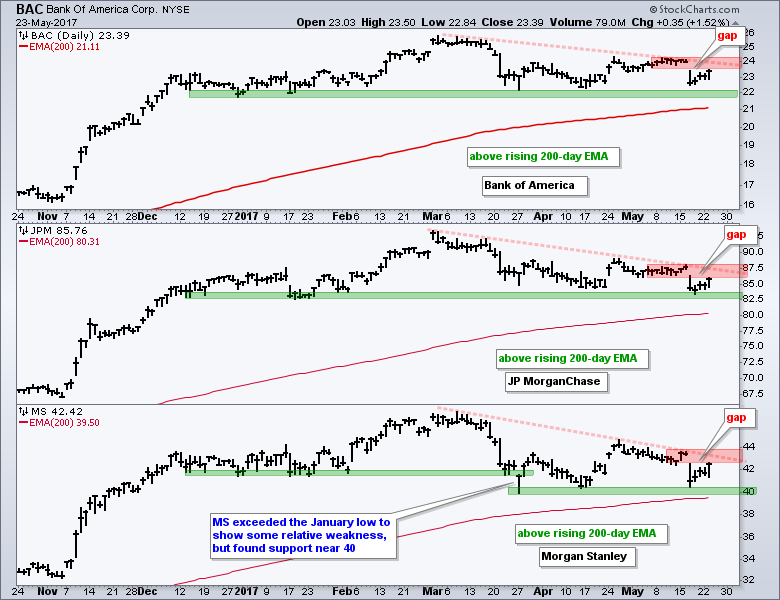
Minding Three Gaps for Three Big Banks
by Arthur Hill,
Chief Technical Strategist, TrendInvestorPro.com
Banking stocks bounced on Tuesday as the 20+ YR T-Bond ETF (TLT) fell and the 10-yr T-Yield ($TNX) moved higher. These bounces reinforce the positive correlation with TLT and the negative correlation with $TNX. The chart below shows three big banks in long-term uptrends and six...
READ MORE
MEMBERS ONLY
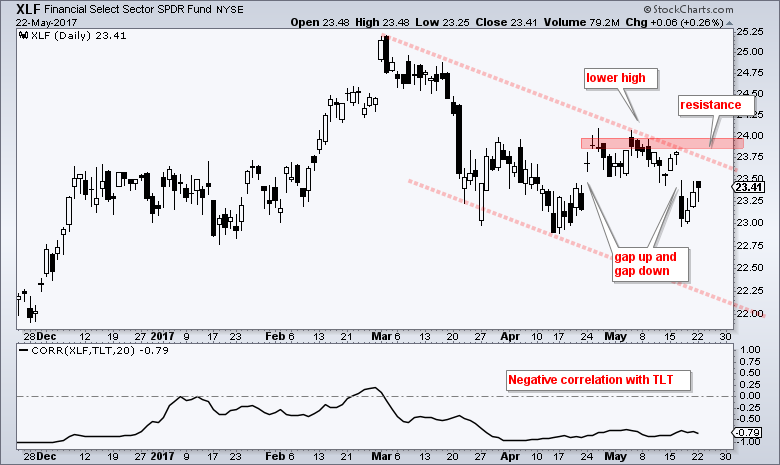
Five Sectors Lead New High List - 10 Bullish Stock Setups
by Arthur Hill,
Chief Technical Strategist, TrendInvestorPro.com
.... XLF Lags as TLT Surges
.... A Classic Corrective Sequence for KRE
.... TLT Holds Breakout and Nears 200-day
.... T-bond Correlations in Play
.... Large-caps Continue to Lead New High List
.... Utilities and Staples Lead Sector New High List
.... Charts: MMC, CB, TRV, MDLZ, KHC, DPS, CMCSA, AAL, JBLU, MDT...
READ MORE
MEMBERS ONLY
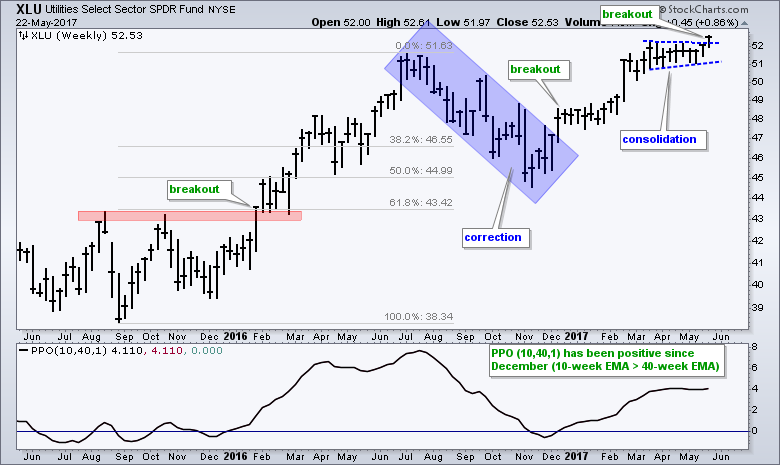
Utilities Take the Lead with a Triangle Breakout
by Arthur Hill,
Chief Technical Strategist, TrendInvestorPro.com
The Utilities SPDR (XLU) is clearly one of the leading sectors in 2017 because it is trading at its highest level of the year. XLU, by the way, is the only sector SPDR that hit a year-to-date high on Monday. The chart shows XLU correcting into November 2016,...
READ MORE
MEMBERS ONLY
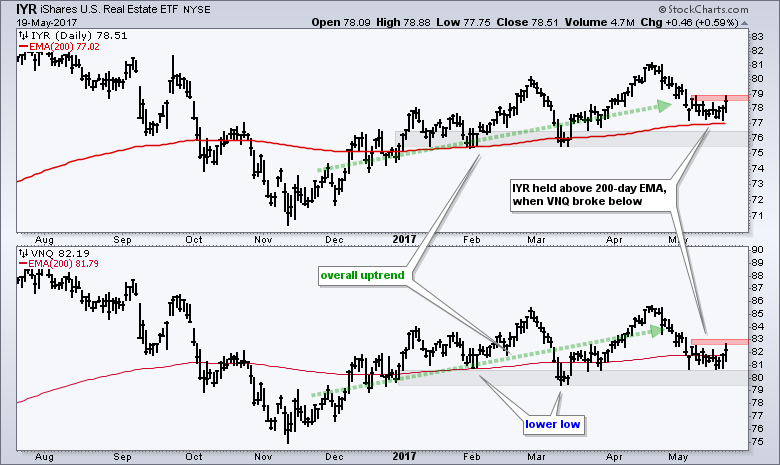
Broad REIT ETFs Hit Interesting Junctures, but Hotel and Retail REITs Weigh
by Arthur Hill,
Chief Technical Strategist, TrendInvestorPro.com
The REIT iShares (IYR) and the Vanguard REIT ETF (VNQ) are at interesting junctures because they corrected within an uptrend. Even though both are at potential reversal zones, chartists should be careful because retail REITs and hotel REITs are weak spots within the REIT universe. The chart below shows IYR...
READ MORE
MEMBERS ONLY
Video - Weekly Market Review & Outlook - Correction Evidence Builds
by Arthur Hill,
Chief Technical Strategist, TrendInvestorPro.com
The stock market has been in correction mode since early March when looking at the EW S&P 500 ETF (RSP) and S&P MidCap SPDR (MDY). Together, these two ETFs represent 900 stocks and cover the majority of the market, and they have been flat since March...
READ MORE
MEMBERS ONLY
Weekly Market Review & Outlook - A Stealthy Correction
by Arthur Hill,
Chief Technical Strategist, TrendInvestorPro.com
.... The Stealthy Looking Correction
.... AD Volume Lines Reflect Corrective Period
.... High-Low Lines Have Yet to Turn Down
.... Percent Above 200-day EMA Deteriorates Further
.... SPY Gaps Down like its September 2016
.... Setting a Correction Zone for QQQ
.... IJR: Breakout Failed, but Short-term Oversold
.... Finance and Industrials Gap Lower...
READ MORE
MEMBERS ONLY
Setting Up a Stock-Picker's ChartList for a Possible Correction - S&P 500 Mimics September
by Arthur Hill,
Chief Technical Strategist, TrendInvestorPro.com
.... Passive versus Too Active
.... Using the Inspect Feature on SharpCharts
.... The Good, the Bad and the Neutral
.... Scan Code to Measure Performance
.... Building a Correction ChartList
.... S&P 500 Breadth, Momentum and Correction Target ....
The active versus passive debate has been raging for some time now. On one side...
READ MORE
MEMBERS ONLY
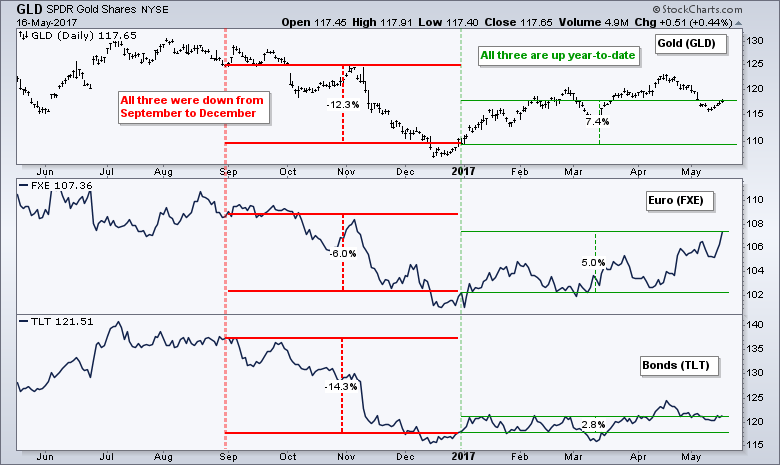
Gold, Euro and Bonds: The Three Inter-market Amigos
by Arthur Hill,
Chief Technical Strategist, TrendInvestorPro.com
The Gold SPDR (GLD), Euro ETF (FXE) and the 20+ YR T-Bond ETF (TLT) are all up year-to-date and showing positive correlation. This is not a big surprise because gold is negatively correlated to the Dollar and negatively correlated to the 10-yr T-Yield ($TNX). The...
READ MORE