MEMBERS ONLY
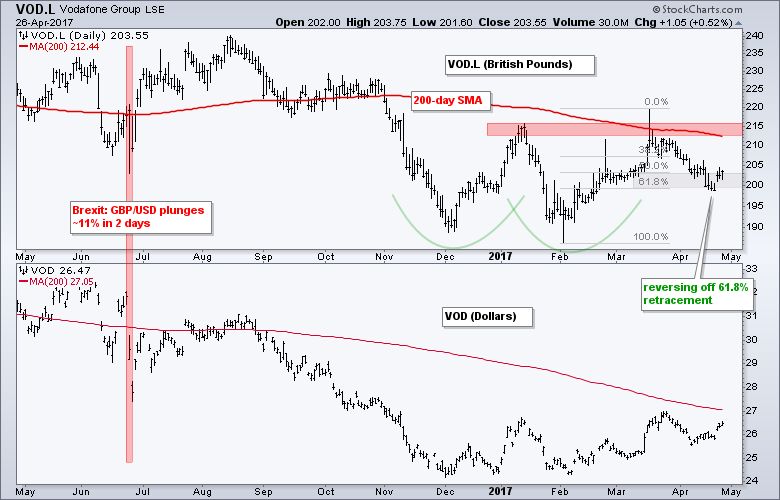
Vodafone and Cable Could be Bottoming
by Arthur Hill,
Chief Technical Strategist, TrendInvestorPro.com
Even though Vodafone remains in a long-term downtrend, the stock has been on my watch-list recently because it could be putting in bottom. Analysis of Vodafone and other ADRs is not straight-forward because there is a currency component. Usually, the movement of the stock is more than enough to compensate...
READ MORE
MEMBERS ONLY
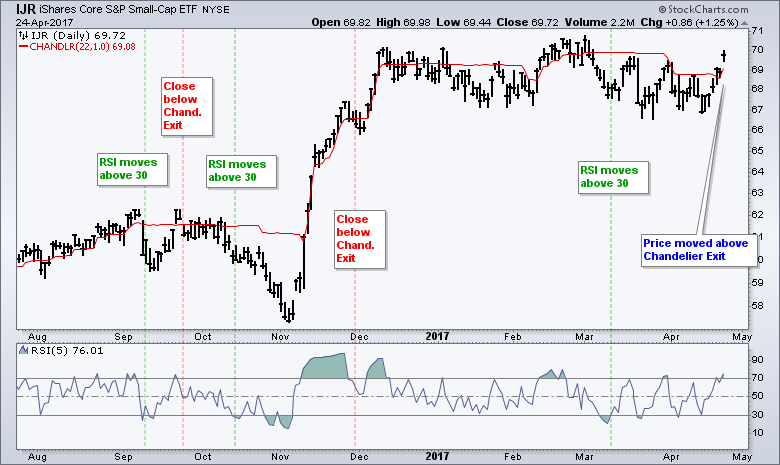
Major Index ETFs Finally Surge above Chandelier Exit - Chinese Stocks Remain Subdued
by Arthur Hill,
Chief Technical Strategist, TrendInvestorPro.com
.... Small-cap ETF Closes above Chandelier Exit
.... New Highs Expand within Tech and Industrials
.... Tech Stocks and ETFs Dominate New High List
.... Agribusiness ETF Gets a Wedge Breakout
.... Chinese Stocks Remain Subdued
.... Stocks to Watch: HBAN, JBHT, CA, PFPT, NKE, WBC ....
IJR Closes above Chandelier Exit
With a big surge in...
READ MORE
MEMBERS ONLY
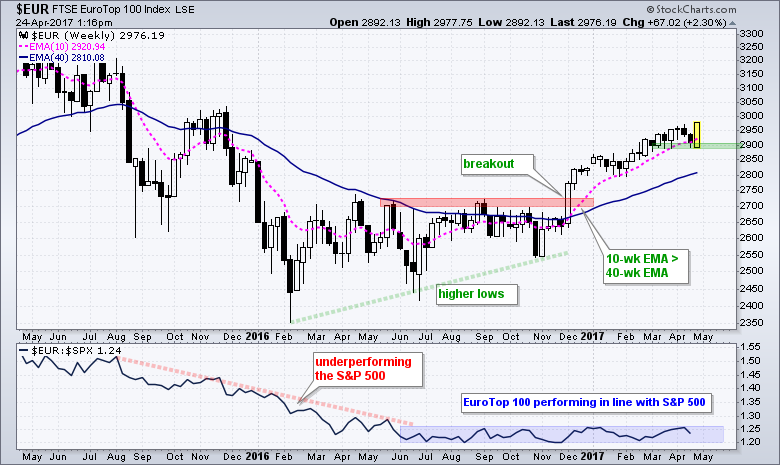
EuroTop 100 Hits New High, but Still Not Outperforming S&P 500
by Arthur Hill,
Chief Technical Strategist, TrendInvestorPro.com
The Eurotop 100 Index surged over 2% and hit a new high to affirm its current uptrend, which began with the breakout and golden cross in early December. The index established support around 2900 over the last two months and this is the first area to watch going forward. A...
READ MORE
MEMBERS ONLY
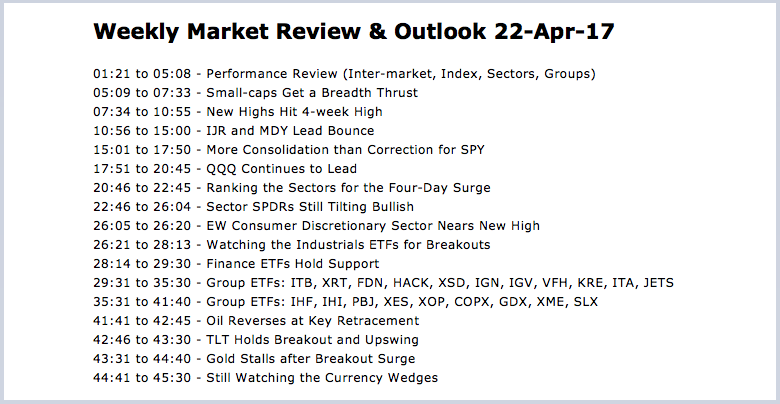
Video - Weekly Market Review & Outlook - Is the Correction Over?
by Arthur Hill,
Chief Technical Strategist, TrendInvestorPro.com
----- Video Link ----- Art's Charts ChartList (updated 22-Apr) -----
This video is a companion to the written commentary, which was posted on Friday. Small-caps and mid-caps led a market rebound this past week and we even saw a breadth improvement. This is an encouraging spark, but the...
READ MORE
MEMBERS ONLY
Weekly Market Review & Outlook - Small-caps Perk Up and Sector Balance is Bullish
by Arthur Hill,
Chief Technical Strategist, TrendInvestorPro.com
.... Weekly Market Review & Outlook
.... Economically Sensitive Groups Take the Lead
.... Small-caps Get a Breadth Thrust
.... New Highs Hit 4-week High
.... IJR and MDY Lead Bounce
.... More Consolidation than Correction for SPY
.... QQQ Continues to Lead
.... Ranking the Sectors for the Four Day Surge
.... Sector SPDRs Still Tilting Bullish
.... EW...
READ MORE
MEMBERS ONLY
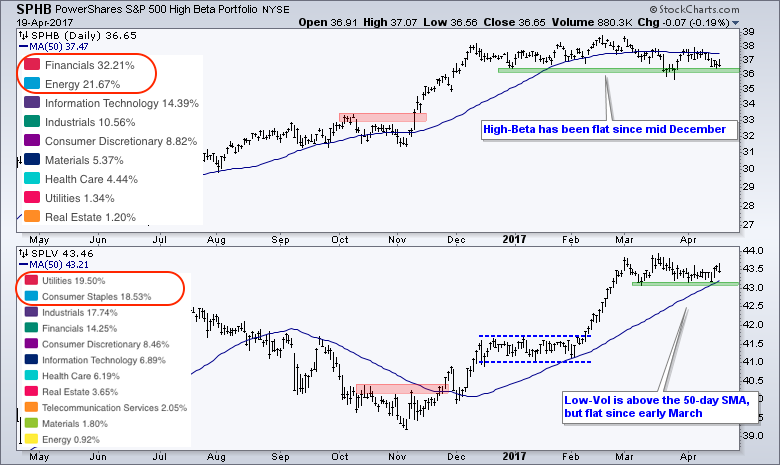
Measuring the Risk Appetite with Beta, Volatility and Ratios - GDX Underperforms GLD
by Arthur Hill,
Chief Technical Strategist, TrendInvestorPro.com
.... High-Beta/Low-Vol Ratio Reflects Risk Environment
.... Risk Ratios Stabilize within Downtrends
.... Stock:Bond Ratio Turns Down
.... High Yield Bond SPDR Could be Vulnerable
.... Internet, Software and Cloud-Computing Hold Up
.... Gold Miners ETF Underperforms Gold ....
High-Beta/Low-Vol Ratio Reflects Risk Environment
There are a number of ways to measure the risk...
READ MORE
MEMBERS ONLY
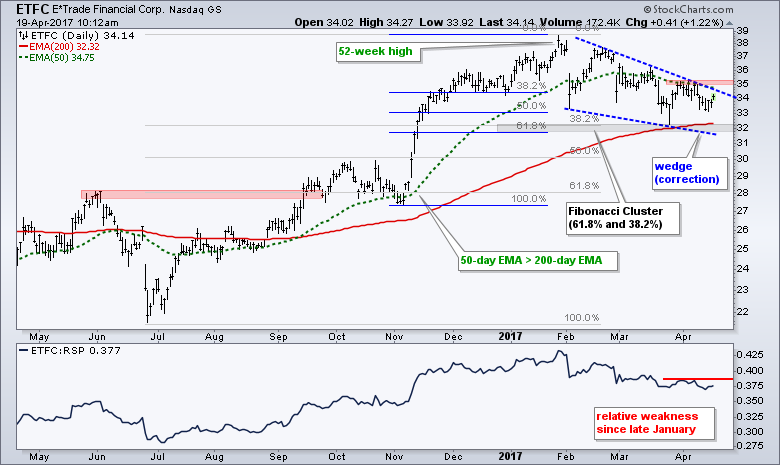
Etrade Corrects into Fibonacci Cluster
by Arthur Hill,
Chief Technical Strategist, TrendInvestorPro.com
It has been a rough year for small-caps because the Russell 2000 iShares is up just 1.34% year-to-date and severely trailing the S&P 500 SPDR, which is up around 5.5%. Chartists looking for clues of a small-cap revival may want to watch E-Trade Financial (ETFC) and...
READ MORE
MEMBERS ONLY
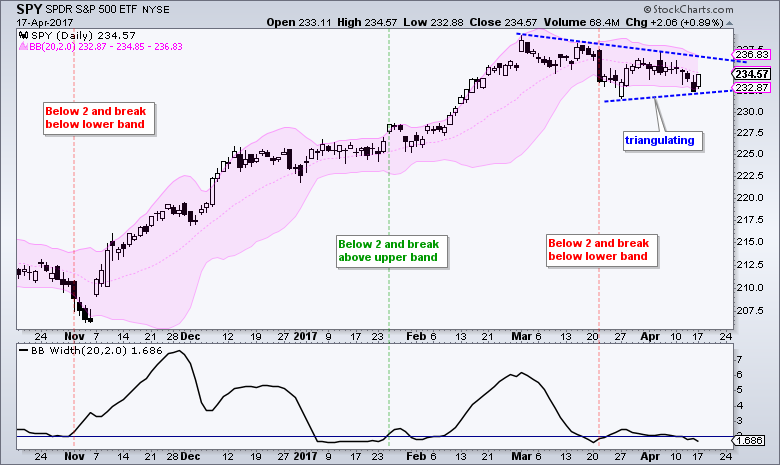
Conflicting Bollinger Band Signals for SPY and QQQ - Stocks to Watch
by Arthur Hill,
Chief Technical Strategist, TrendInvestorPro.com
.... SPY Remains with Bearish Bollinger Band Signal
.... QQQ Counters with Bullish Band Signal
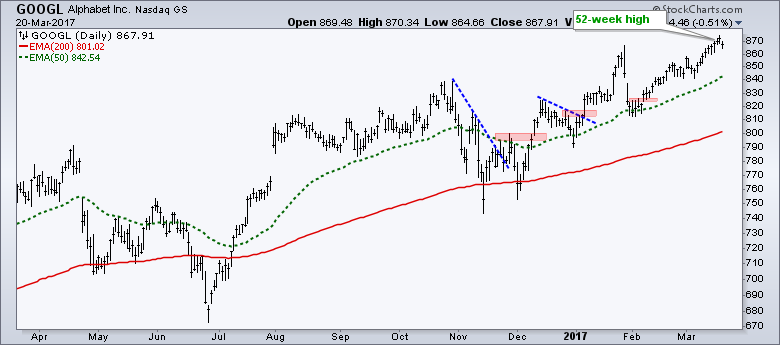
.... GOOGL Springs to Life - Plus FB, AMZN, AAPL, MSFT
.... A Year of Frustration for IJR
.... Airlines Remain Strong Overall
.... Stocks: CTRL, FEYE, SQ, TDC, MDT and MRK ....
The major stock indices are downright boring right now...
READ MORE
MEMBERS ONLY
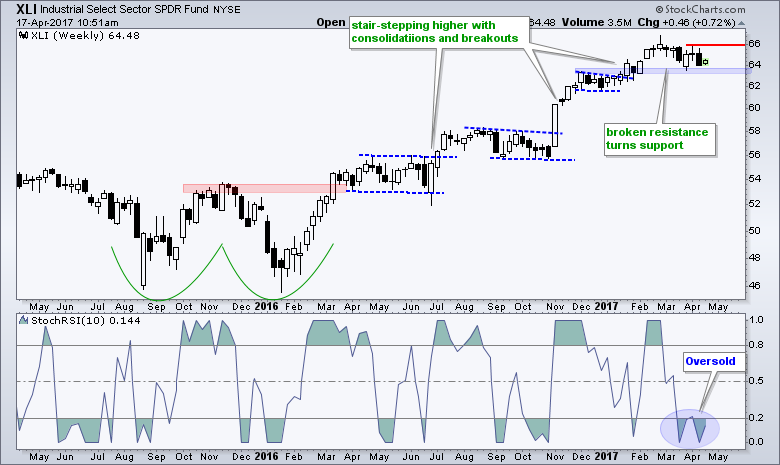
Industrials SPDR Becomes Oversold and Finds Support
by Arthur Hill,
Chief Technical Strategist, TrendInvestorPro.com
The Industrials SPDR (XLI) is at an interesting juncture because the long-term trend is up and it is testing the January breakout. After hitting a 52-week high in February, the ETF fell back to the breakout zone in the 63.50 area and firmed with a long white candlestick four...
READ MORE
MEMBERS ONLY
How to Track ETF Tracking Errors - Examples for USO and GLD
by Arthur Hill,
Chief Technical Strategist, TrendInvestorPro.com
Most of us are aware of the tracking error between oil and the US Oil Fund. There is indeed a tracking error, but a few charts reveal that this tracking error is subject to fluctuations and can even remain stable for extended periods. Today I will show how to measure...
READ MORE
MEMBERS ONLY
Weekly Market Review & Outlook - Correction Extends but Sectors Remain Mixed (with Video)
by Arthur Hill,
Chief Technical Strategist, TrendInvestorPro.com
----- Video Link ----- Art's Charts ChartList (updated 14-Apr) -----
Note that the Art's Charts ChartList has been updated with 30 annotated charts covering the industry group ETFs. Not all of these charts are covered in the written commentary. See the video timeline (above) for details....
READ MORE
MEMBERS ONLY
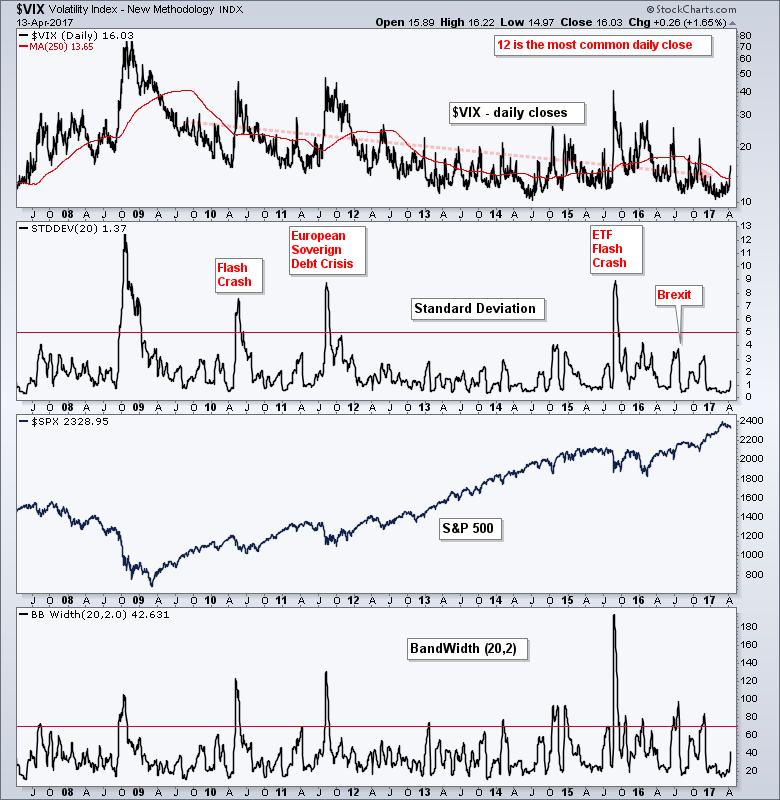
Measuring VIX Contractions and Expansions - Charting the Fear and Greed Index
by Arthur Hill,
Chief Technical Strategist, TrendInvestorPro.com
.... Applying Standard Deviation and BandWidth to the VIX
.... Trade XIV Instead of SPY
.... Combining Technicals and Fundamentals
.... Monthly MACD for Long-term Trend
.... Charting the Fear & Greed Index
.... Machines Dominate the Bond Market ....
I will post the Weekly Market Review & Outlook on Friday with a video. Instead of the...
READ MORE
MEMBERS ONLY
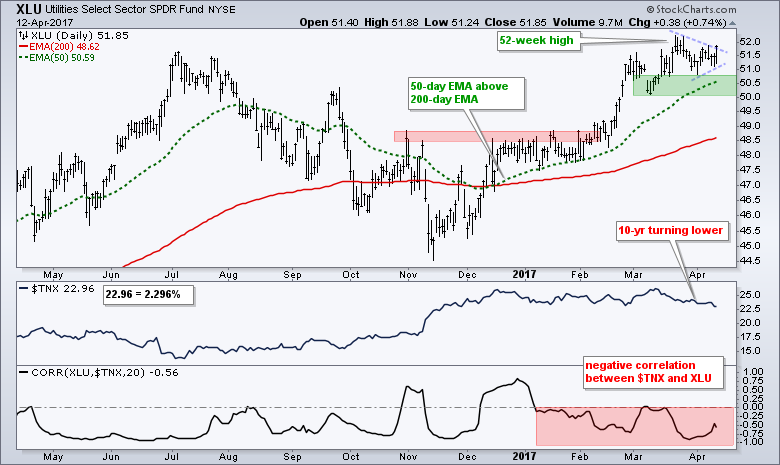
Utilities Surge as 10-yr T-Yield Drops below 2.3%
by Arthur Hill,
Chief Technical Strategist, TrendInvestorPro.com
The Utilities SPDR (XLU) surged as the S&P 500 fell below its 50-day SMA on Wednesday. Overall, notice that the 50-day EMA crossed the 200-day EMA in mid December and the ETF hit a 52-week high in late March. XLU is the strongest of the nine sectors since...
READ MORE
MEMBERS ONLY
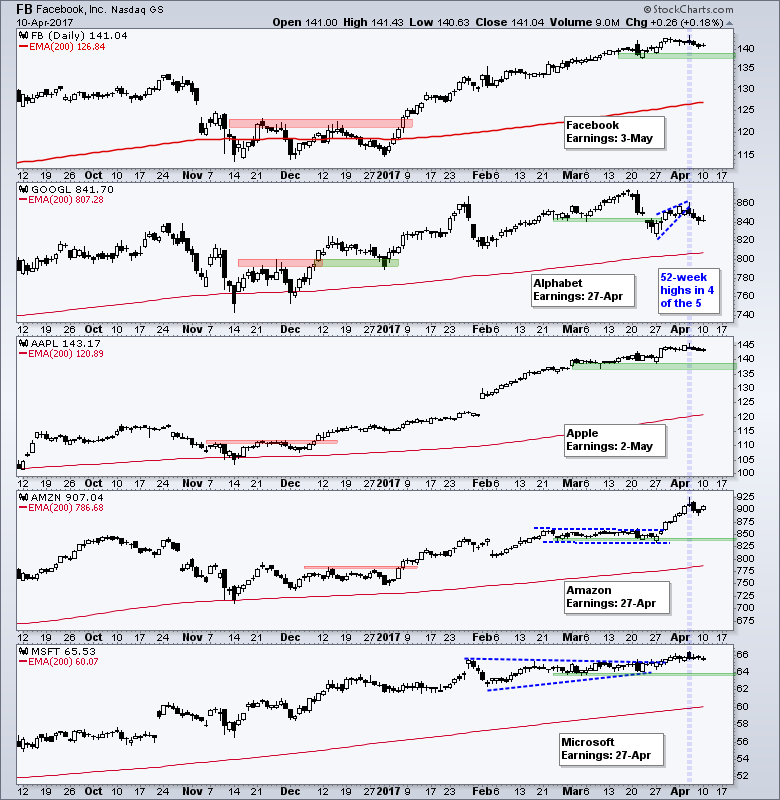
Alphabet Lags within the Fab Five - Celgene and Illumina Lead Biotechs
by Arthur Hill,
Chief Technical Strategist, TrendInvestorPro.com
.... Alphabet Lags within the Fab Five
.... Banks Hold Support, but Fail to Follow Through on Reversal
.... UAL Bounces on Seemingly Bad News
.... Celgene and Illumina Lead Biotechs (XBI)
.... Measured Move Target for NVDA ....
QQQ remains one of the strongest major index ETFs because four of the five top stocks hit...
READ MORE
MEMBERS ONLY
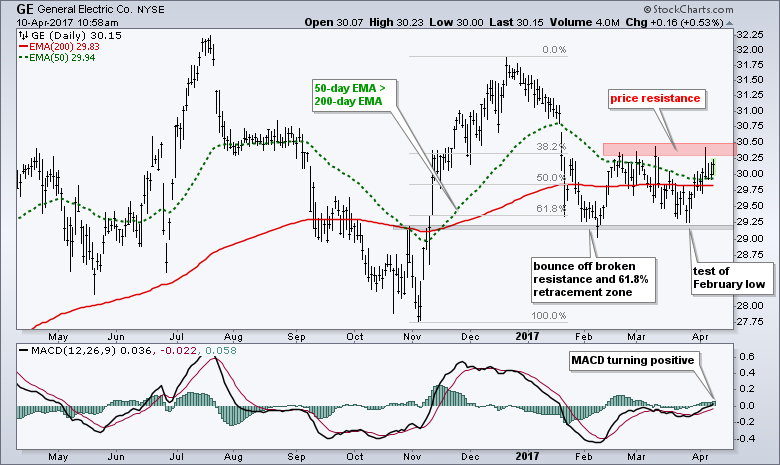
General Electric Finds Support, but Remains Short of a Breakout
by Arthur Hill,
Chief Technical Strategist, TrendInvestorPro.com
It has been a rough year for General Electric (GE) because the stock is down around 4% and underperforming the S&P 500 SPDR (SPY), which is up around 6% this year. Despite relative weakness, momentum is improving as MACD edges into positive territory and the stock is bouncing...
READ MORE
MEMBERS ONLY
Weekly Market Review & Outlook - Stocks and Bonds Yawn as Oil Wakes Up
by Arthur Hill,
Chief Technical Strategist, TrendInvestorPro.com
.... Broad Market Breadth Remains Weak
.... SPY Stalls within Pullback
.... Bearish Failure Swing forms in QQQ
.... IJR Tests Consolidation Lows
.... Tech, Discretionary and Staples Hold Up
.... Utilities and Materials Stay Strong
.... Finance, Industrials and Healthcare Correct
.... XLE Attempts a Channel Breakout (plus XOM)
.... Oil Holds Uptrend with Surge
.... TLT Challenges Consolidation...
READ MORE
MEMBERS ONLY
SystemTrader - Scan Code for Bollinger Band Squeeze - Plus Coding Tips and Techniques
by Arthur Hill,
Chief Technical Strategist, TrendInvestorPro.com
.... Universe and Trend Filter
.... Bollinger Band Setup Code
.... StockRSI Trigger Code
.... Rate-of-Change Sort Code
.... Scan Code in Full
.... TTM Technologies Setup and Signal
.... Conclusions and Suggestions ....
Scan Code for Bollinger Band Squeeze
This article will focus on the scan code for last week's System Trader article featuring the...
READ MORE
MEMBERS ONLY
Correction Update - Plus Gold and Newmont are in Focus this Week
by Arthur Hill,
Chief Technical Strategist, TrendInvestorPro.com
.... Still in Corrective Mode
.... Newmont Mining Stalls with Pennant
.... Surge in TLT and Bounce in the Dollar Baffles Gold
.... Watch Baker Hughes and ExxonMobil for Clues on Energy Stocks
.... Kellogg and Monster Turn Lower within Downtrends
.... Pfizer and Thermo Fisher Correct after Surge ....
Still in Corrective Mode
I have a...
READ MORE
MEMBERS ONLY
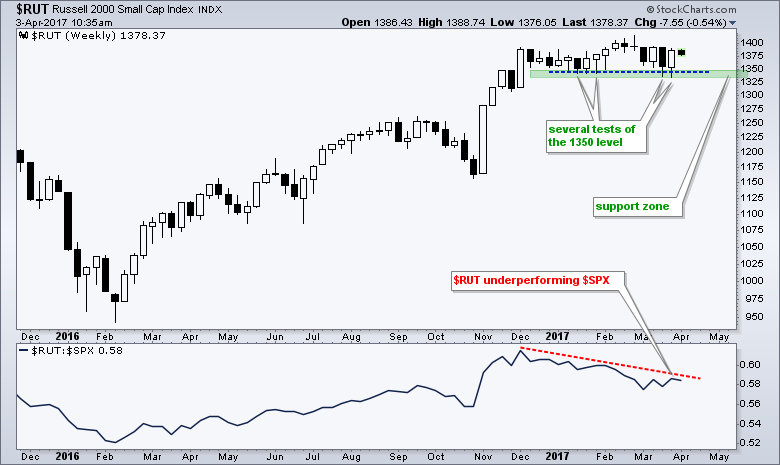
Russell 2000 Establishes a Clear Line-in-the-Sand $RUT
by Arthur Hill,
Chief Technical Strategist, TrendInvestorPro.com
The Russell 2000 surged last week and this bounce gives chartists a clear level to watch going forward. The chart below shows the small-cap index surging from early November to early December and then stalling between 1330 and 1390 for nine weeks. The index exceeded the early December high and...
READ MORE
MEMBERS ONLY
Mixing it up with Oil, Industrial Metals, 3 Emerging Market ETFs and a Kiwi
by Arthur Hill,
Chief Technical Strategist, TrendInvestorPro.com
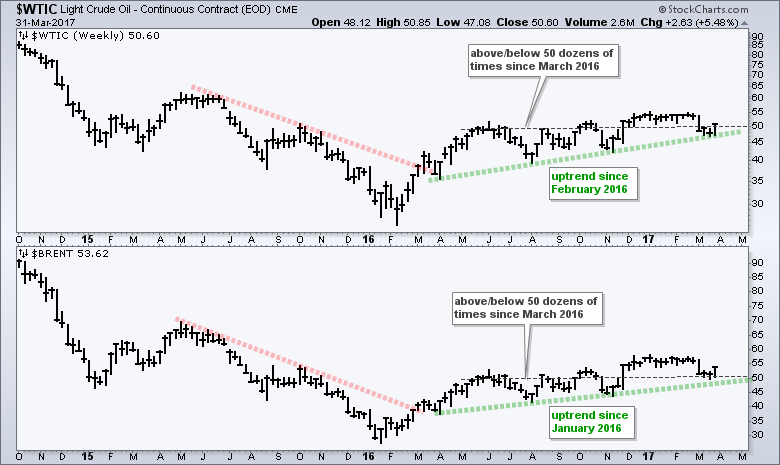
.... WTI and Brent Battle the $50 Level
.... Gasoline Looks Poised to Continue Uptrend
.... Industrial Metals Remain in Uptrends
.... Silver Surges off Breakout Zone
.... Two Emerging Market ETFs in Asia
.... New Zealand ETF Bounces off Breakout Zone
.... Colombia ETF Breaks Out of Flag ....
I am going to mix it up a...
READ MORE
MEMBERS ONLY
Finding New Highs and Measuring Trend Strength with Stochastics
by Arthur Hill,
Chief Technical Strategist, TrendInvestorPro.com
The Stochastic Oscillator is best known as a momentum indicator, but a careful look at the formula reveals that it can also be used to measure trend strength. As noted in a previous article on MACD, it is imperative that chartists fully understand an indicator to get the most out...
READ MORE
MEMBERS ONLY
Weekly Market Review & Outlook (with Video) - Is One Week of Risk-On Enough?
by Arthur Hill,
Chief Technical Strategist, TrendInvestorPro.com
.... Is One Week of Risk-On Enough?
.... Breadth Underwhelms on latest Surge
.... SPY Remains in Corrective Mode
.... IJR Gets a Mini-Breakout within a Consolidation
.... Another New High for QQQ, but..,
.... Five Sectors Still Holding Up
.... Finance and Regional Bank ETFs Reverse
.... Watch TLT and the 10-yr Yield for Clues
.... Watch GE...
READ MORE
MEMBERS ONLY
SystemTrader - Testing a Bollinger Band Squeeze System for Stocks in the S&P 1500
by Arthur Hill,
Chief Technical Strategist, TrendInvestorPro.com
..... A Bollinger Band Squeeze System
.... Trend Filters and Trading Signals
.... JPM with a Winner and a Loser
.... XOM with Two Losing Trades
.... System Ground Rules
.... Backtest Results for S&P 1500
.... Conclusions - Caveat Emptor! ....
A Bollinger Band Squeeze System
Today we are going to look at a system...
READ MORE
MEMBERS ONLY
Using the 50-day SMA to Compare Performance and Price Levels
by Arthur Hill,
Chief Technical Strategist, TrendInvestorPro.com
.... SPY Remains the Key Yardstick
.... Using the 50-day SMA to Compare Charts
.... IJR Attempts another Oversold Bounce
.... Banking Stocks Hit Support Zones (BAC, C, JPM, WFC, STT)
.... Watch TLT and $TNX for Clues on XLF
.... Technology is Still the Strongest Sector (MSFT, NVDA, QLYS) ....
SPY Remains the Key Yardstick
Stocks...
READ MORE
MEMBERS ONLY
Small-caps Turn Negative Year-to-Date
by Arthur Hill,
Chief Technical Strategist, TrendInvestorPro.com
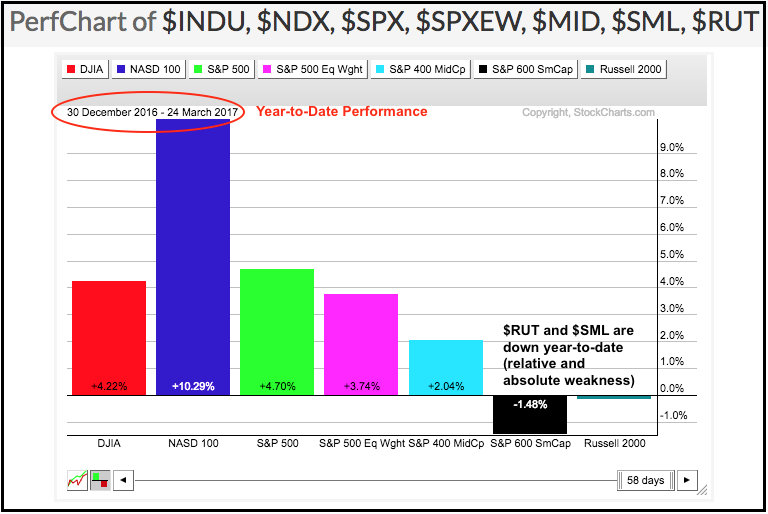
Small-caps are still leading the market since early November, but they are lagging in 2017 as year-to-date performance turned negative. The PerfChart below shows year-to-date performance for seven major stock indexes. The Nasdaq 100 is up around 10% and leading the pack by a wide margin. The Dow Industrials, S&...
READ MORE
MEMBERS ONLY
Video - Weekly Market Review & Outlook - The Art of Fibonacci Applied to SPY
by Arthur Hill,
Chief Technical Strategist, TrendInvestorPro.com
----- Video Link ----- Art's Charts ChartList (updated 25-Mar) -----
Note that the Art's Charts ChartList has been updated with 30 annotated charts covering the industry group ETFs. The outline above is for the video and I cover these industry group ETFs in the video.
See...
READ MORE
MEMBERS ONLY
Weekly Market Review & Outlook 24-Mar-17 - Correction Targets for the Major Index ETFs
by Arthur Hill,
Chief Technical Strategist, TrendInvestorPro.com
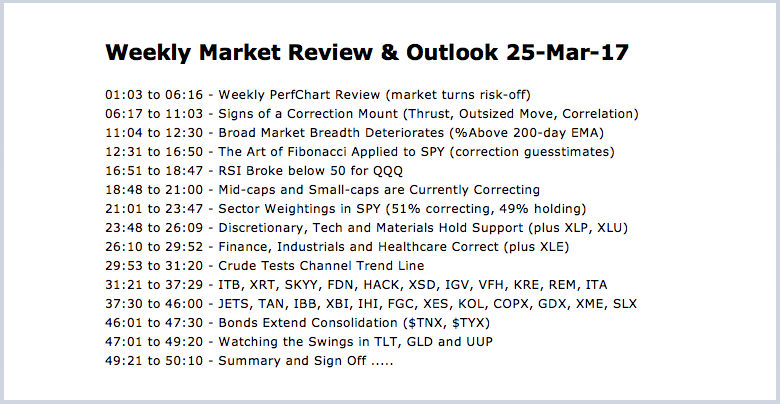
.... Signs of a Correction Mount
.... Broad Market Breadth Deteriorates
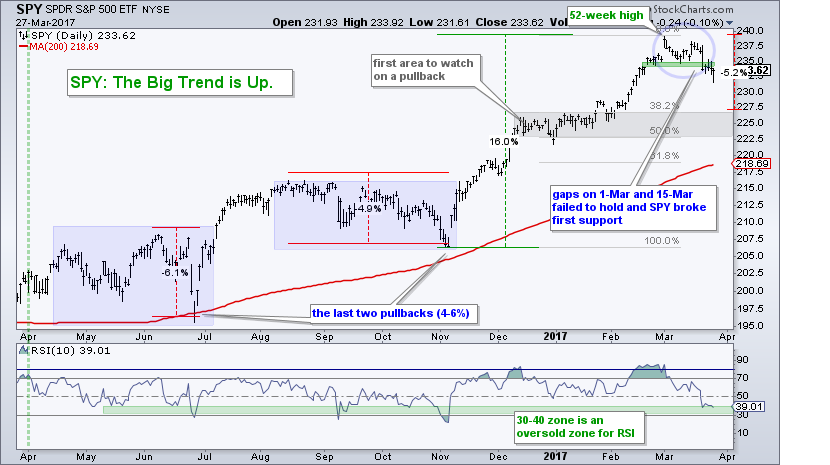
.... The Art of Fibonacci Applied to SPY
.... RSI Breaks below 50 for QQQ
.... Mid-caps and Small-caps are Currently Correcting
.... Discretionary, Tech and Materials Hold Support
.... Staples and Utilities Lead with New Highs
.... Finance, Industrials and Healthcare Correct
.... Energy Remains the Weakest...
READ MORE
MEMBERS ONLY
SystemTrader - Testing Filters for Signal Line and Centerline Crosses using the PPO (MACD)
by Arthur Hill,
Chief Technical Strategist, TrendInvestorPro.com
.... Filtering out PPO Signals
.... MACD versus the Percentage Price Oscillator
.... Testing Signal Line Crossovers
.... Adding Some Filters to the PPO Signals
.... Adding Focus to the Portfolio
.... Conclusions - Caveat Emptor! ....
This System Trader article is a follow up to my ChartWatchers post on MACD. I will test the Percentage Price...
READ MORE
MEMBERS ONLY
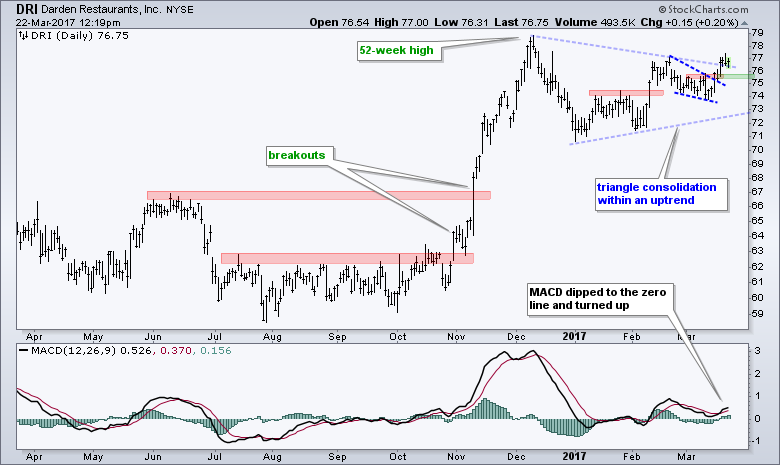
Darden Defies with a Triangle Breakout
by Arthur Hill,
Chief Technical Strategist, TrendInvestorPro.com
Stocks got hammered on Tuesday with the S&P 500 falling the most this year (1.24%) and breaking below its March low. Even with the seemingly big decline, the index is still just 2.25% from an all time high. Darden Restaurants caught my attention because it did...
READ MORE
MEMBERS ONLY
Is the Correction Finally Here or is this Just Noise?
by Arthur Hill,
Chief Technical Strategist, TrendInvestorPro.com
.... Breadth Indicators Plunge to Extremes
.... Finance, Industrials and Tech Get Hit Hard
.... SPY has not Done This since October
.... Small-cap Correlation Turns Down
.... RSI Breaks Key Level for QQQ
.... The Bottom Line ....
What a difference a day makes - 24 little hours. There is selling pressure and then there is...
READ MORE
MEMBERS ONLY
Strong Uptrends Continue in the Fab Five - Three Industrial Stocks to Watch
by Arthur Hill,
Chief Technical Strategist, TrendInvestorPro.com
.... The Fab Five Remain Strong (GOOGL, AAPL, FB, MSFT, AMZN)
.... Equinix Looks Set to Continue Uptrend
.... Think Market, Sector, Group and Trend First (NVDA)
.... A Payment Processor, A Big Data Player and an IoT Leader (PYPL, TDC, XLNX)
.... Crown Castle, Zoetis and General Cable Turn Up (CCI, ZTS, BGC)
.... Watch...
READ MORE
MEMBERS ONLY
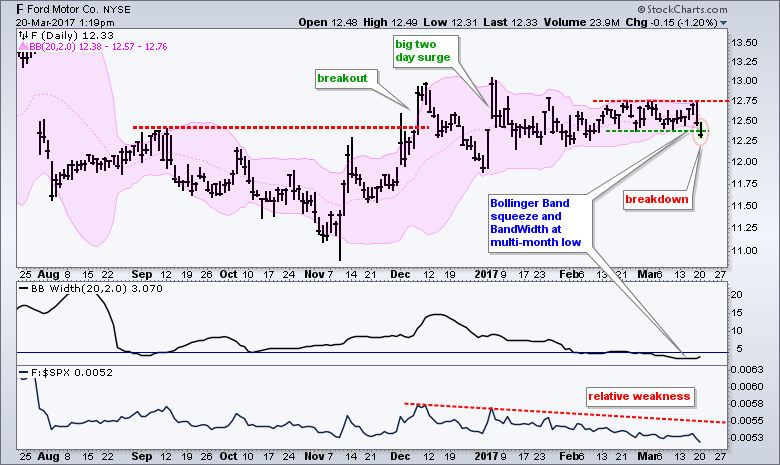
Ford Breaks Bollinger Band after a Long Squeeze
by Arthur Hill,
Chief Technical Strategist, TrendInvestorPro.com
Ford (F) looked as if it was simply consolidating after a sharp surge and breakout, but this consolidation strung out and the stock broke to the downside on Monday. The chart shows Ford breaking above the September high with a surge in November-December. The stock fell back after this breakout...
READ MORE
MEMBERS ONLY
Video - Weekly Market Review & Outlook - Small-caps Catch a Bid
by Arthur Hill,
Chief Technical Strategist, TrendInvestorPro.com
The stock market moved higher again this past week with several sector and industry group ETFs hitting new highs. Four of the five sector SPDRs hit fresh 52-week highs. These include the Technology SPDR, HealthCare SPDR, Consumer Staples SPDR and Consumer Discretionary SPDR. Together, these four sectors account for over...
READ MORE
MEMBERS ONLY
Ignoring Signals is the First Step to Taking Signals - How Well do you Know MACD?
by Arthur Hill,
Chief Technical Strategist, TrendInvestorPro.com
Two Indicators in One
Indicators generate lots of signals and many of these signals are just noise. It is imperative that chartists understand how their indicators work and exactly what these indicators are saying. Understanding the ins and outs of an indicator will help chartists determine which signals to take...
READ MORE
MEMBERS ONLY
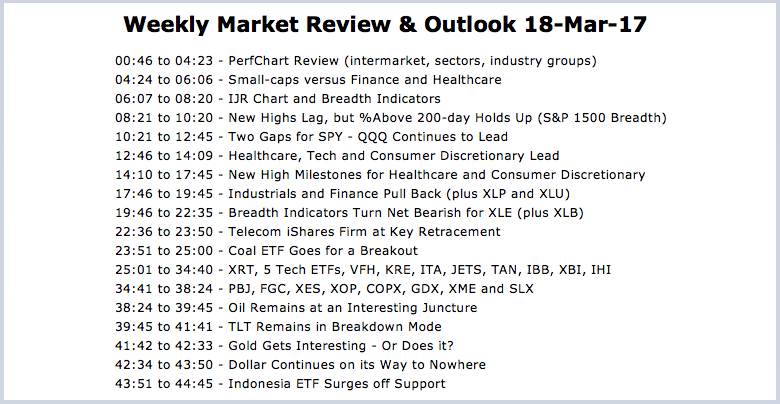
Weekly Market Review & Outlook 17-Mar-17 - Small-Caps Hold the Line as 2-yr Yield Surges
by Arthur Hill,
Chief Technical Strategist, TrendInvestorPro.com
.... Small-caps versus Finance and Healthcare
.... New Highs Lag, but %Above 200-day Holds Up
.... Two Gaps Establish First Support for SPY
.... QQQ Continues to Lead and IJR Continues to Lag
.... Healthcare, Tech and Consumer Discretionary Lead
.... New High Milestones for Healthcare and Consumer discretionary
.... Industrials and Finance Pull Back
.... Breadth Indicators...
READ MORE
MEMBERS ONLY
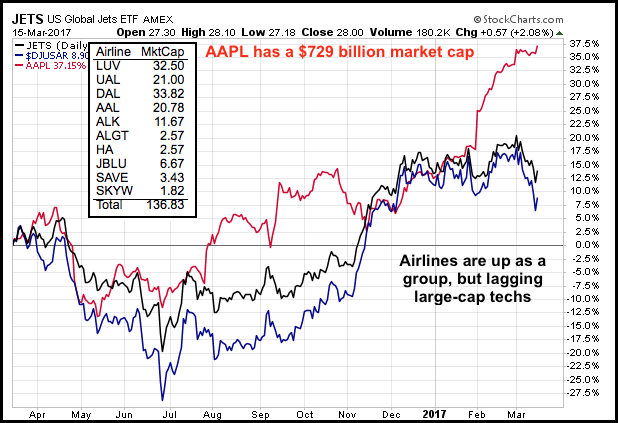
Airline ETF and Six Airline Stocks: Long-term Uptrend and Short-term Oversold - Plus Ford and Akamai
by Arthur Hill,
Chief Technical Strategist, TrendInvestorPro.com
.... The Airline Group is Tiny, Really Tiny
.... Comparing the Airline Index with the Airline ETF
.... JETS Hits Oversold Zone
.... The Big Three (AAL, DAL, UAL)
.... Three Regional Carriers (HA, JBLU, SKYW)
.... Where to Find a List of Airline Stocks
.... Two More Charts with Bullish Setups (F and AKAM)
The Airline...
READ MORE
MEMBERS ONLY
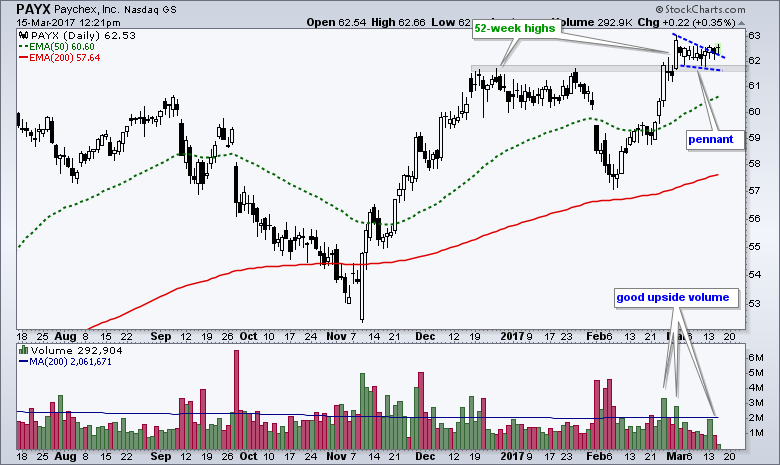
A High and Tight Pennant Takes Shape for Paychex
by Arthur Hill,
Chief Technical Strategist, TrendInvestorPro.com
Flags and pennants are continuation patterns, which means their bias depends on the direction of the prior move. A flag or pennant after a surge is a bullish continuation pattern that represents a rest within the uptrend. An upside break signals an end to this consolidation and a resumption of...
READ MORE
MEMBERS ONLY
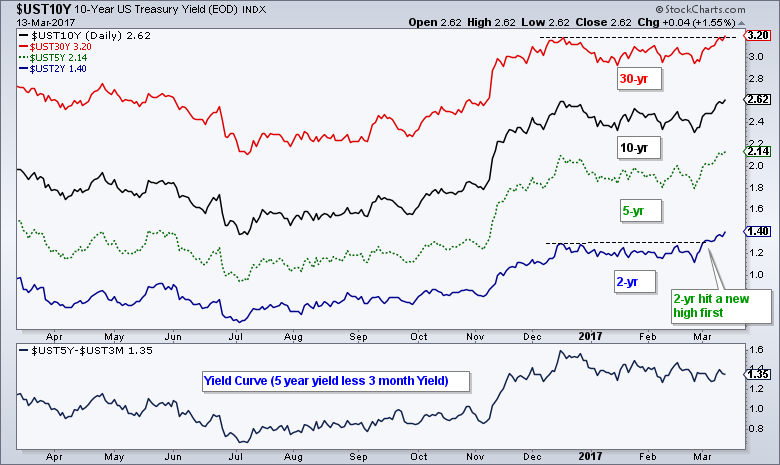
Bond Market Moves Ahead of the Fed - Plus MDY, JJC and 16 Stocks
by Arthur Hill,
Chief Technical Strategist, TrendInvestorPro.com
.... Bond Market Moves Ahead of the Fed
.... S&P MidCap SPDR Becomes Short-term Oversold
.... Copper ETN Pulls Back within Uptrend
.... Valero and Marathon (Refiners) Hold Up within XLE
.... Computer Associates, QQQ and New Highs
.... FFIV, PFPT and QLYS Bounce within Cyber-Security Group
.... Three Biotechs to Watch (CELG, ILMN, REGN)...
READ MORE
MEMBERS ONLY
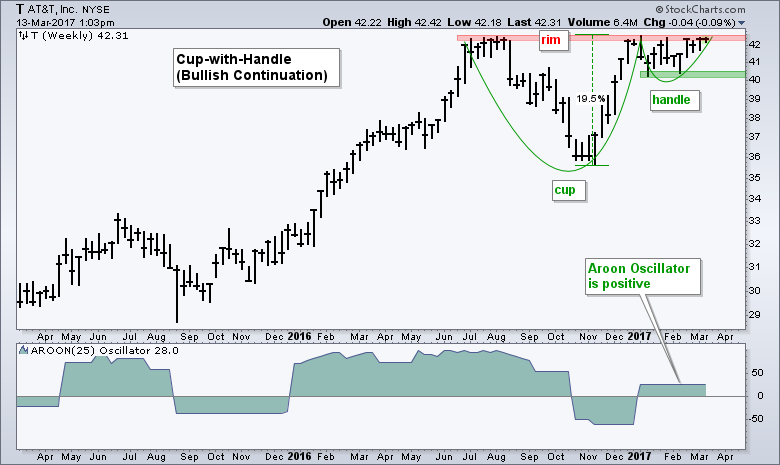
AT&T Forms a Classic Bullish Continuation Pattern
by Arthur Hill,
Chief Technical Strategist, TrendInvestorPro.com
The cup-with-handle is a bullish continuation pattern that forms as part of a bigger uptrend. There are three parts to this pattern. First, a cup forms as prices correct and rebound to form a "V" or "U" shape. Second, prices hit resistance at the prior high...
READ MORE
MEMBERS ONLY
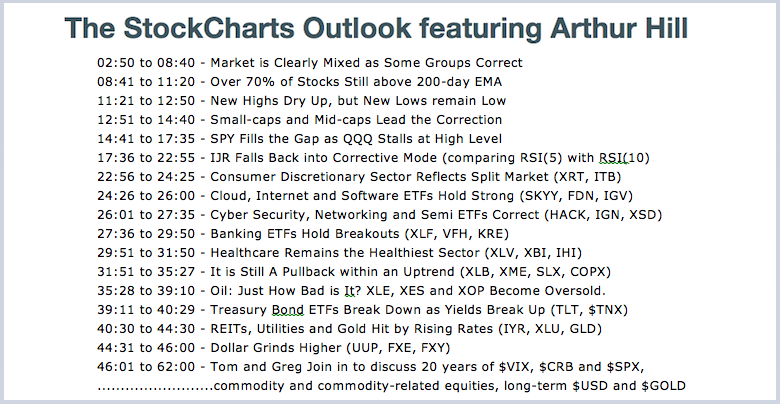
The StockCharts Outlook Webinar Recording with Arthur, Greg and Tom
by Arthur Hill,
Chief Technical Strategist, TrendInvestorPro.com
The image above shows the outline for the StockCharts Outlook webinar. Arthur added some color to the Weekly Market Review & Outlook by going over the each chart and expanding in some areas. Namely, the difference between RSI(5) and RSI(10), the bifurcation in the current market and a...
READ MORE